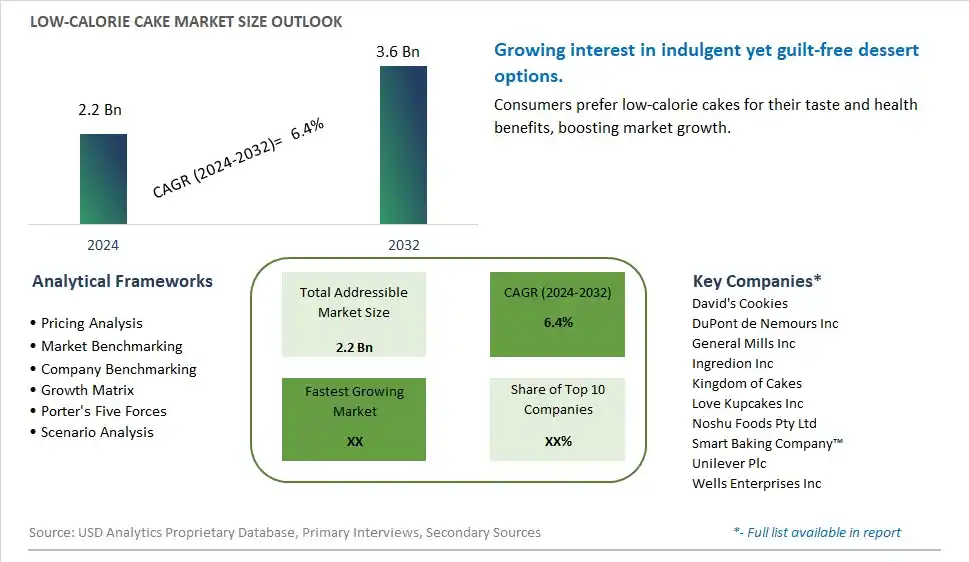
Global Low-Calorie Cake Market Size is valued at $2.2 Billion in 2024 and is forecast to register a growth rate (CAGR) of 6.4% to reach $3.6 Billion by 2032.
The global Low-Calorie Cake Market Comprehensive Study analyzes and forecasts the market size across 6 regions and 24 countries for diverse segments -By Type (Organic cake, Conventional cake), By Application (B2B, B2C)
An Introduction to Low-Calorie Cake Market
The Low-Calorie Cake Market focuses on the production and sale of cakes formulated with reduced calories, catering to health-conscious consumers seeking indulgent yet nutritious dessert options. The market is driven by increasing health consciousness, rising prevalence of obesity and related health conditions, and growing demand for low-calorie and low-sugar foods. Additionally, advancements in cake formulations and the expansion of product offerings support market growth.
Low Calorie Cake Competitive Landscape
The market report analyses the leading companies in the industry including David's Cookies, DuPont de Nemours Inc, General Mills Inc, Ingredion Inc, Kingdom of Cakes, Love Kupcakes Inc, Noshu Foods Pty Ltd, Smart Baking Company™, Unilever Plc, Wells Enterprises Inc, and Others.
Low Calorie Cake Market Dynamics
Low-Calorie Cake Market Trend: Rising Demand for Healthier Dessert Options
The most prominent trend in the Low-Calorie Cake Market is the rising demand for healthier dessert options. Consumers are increasingly seeking cakes that offer indulgence without the guilt, leading to a surge in low-calorie cake products. This trend is driven by the growing awareness of the health impacts of high-calorie desserts and the desire for better-for-you alternatives.
Low-Calorie Cake Market Driver: Health Consciousness and Dietary Preferences
A key driver in the Low-Calorie Cake Market is health consciousness and changing dietary preferences. As more individuals focus on maintaining a balanced diet and managing their weight, there is a rising demand for desserts that align with these health goals. Low-calorie cakes, which provide a satisfying treat with fewer calories, cater to this demand and support market growth.
Low-Calorie Cake Market Opportunity: Innovation in Ingredients and Flavors
One significant opportunity in the Low-Calorie Cake Market lies in innovation in ingredients and flavors. Companies can develop new low-calorie cake recipes using alternative sweeteners, high-fiber flours, and other healthy ingredients. By offering a variety of flavors and creative formulations, manufacturers can attract health-conscious consumers and expand their product offerings.
Low-Calorie Cake Market Share Analysis- Largest Segment by Type
The Conventional Cake segment is the largest in the Low-Calorie Cake Market by type. This dominance is driven by the high consumer demand for affordable and widely available low-calorie cake options that offer the indulgence of traditional cakes with reduced calorie content. Conventional low-calorie cakes provide a satisfying treat for health-conscious consumers and those seeking to manage their calorie intake without sacrificing taste. The continuous innovation in conventional low-calorie cake formulations, including the use of alternative sweeteners, fat replacers, and high-fiber ingredients, enhances their appeal. Additionally, the extensive availability of conventional low-calorie cakes in supermarkets, bakeries, and online platforms further boosts their accessibility to a broad consumer base. The strong consumer preference for delicious yet healthier dessert options reinforces the dominant position of the conventional cake segment in the market.
Low-Calorie Cake Market Share Analysis- Fastest Growing Segment by Application
The B2C (Business-to-Consumer) segment is poised to grow the fastest in the Low-Calorie Cake Market by application over the next five years. This rapid growth is driven by the increasing consumer demand for convenient and direct access to low-calorie cakes through various retail channels. The B2C segment includes sales through supermarkets, specialty stores, online retail, and direct-to-consumer platforms, providing consumers with multiple options to purchase low-calorie cakes. The continuous innovation in product packaging, marketing strategies, and online sales platforms supports the fast growth of the B2C segment. Additionally, the growing trend of personalized and on-demand food delivery services further drives the demand for low-calorie cakes in the B2C market. The influence of health and wellness trends and the increasing focus on providing convenient and accessible healthier dessert options contribute to the rapid growth of the B2C segment.
Low Calorie Cake Market Segmentation
By Type
Organic cake
Conventional cake
By Application
B2B
B2C
Countries Analyzed
North America (US, Canada, Mexico)
Europe (Germany, UK, France, Spain, Italy, Russia, Rest of Europe)
Asia Pacific (China, India, Japan, South Korea, Australia, South East Asia, Rest of Asia)
South America (Brazil, Argentina, Rest of South America)
Middle East and Africa (Saudi Arabia, UAE, Rest of Middle East, South Africa, Egypt, Rest of Africa)
Low Calorie Cake Companies Profiled in the Study
David's Cookies
DuPont de Nemours Inc
General Mills Inc
Ingredion Inc
Kingdom of Cakes
Love Kupcakes Inc
Noshu Foods Pty Ltd
Smart Baking Company™
Unilever Plc
Wells Enterprises Inc
*- List Not Exhaustive
Chapter 1. TABLE OF CONTENTS
Chapter 2. Introduction to Low Calorie Cake Market
2.1. Market Overview
2.2. Key Statistics and Report Highlights
2.3. Scope of the Comprehensive Study
2.3.1. Market Definition
2.3.2 Countries and Regions Covered
2.3.3 Research Objective
2.3.4 Units, Currency, and Conversions
2.3.5 Industry Value Chain
2.4. Key Market Segments
2.5. Key Companies
2.6. Study Period
Chapter 3. Strategic Analysis Review
3.1. Low Calorie Cake Pricing Analysis and Forecast
3.2. Porter’s Five Forces
3.3. Market Ecosystem
3.4. SWOT Analysis
3.5. Regulatory Scenario
3.3. Effects of Inflation, Russia-Ukraine War, moderating economic growth, and other macroeconomic factors
Chapter 4. Competitive Landscape
4.1. Market Share Analysis
4.1.1. Global Low Calorie Cake Market Share by Company, 2023
4.1.2. Product Offerings of Leading Low Calorie Cake Companies
4.2. Market Entropy
4.2.1. New Product Launches in the Industry
4.2.2. Mergers, Acquisitions, Joint ventures, and Partnerships
4.3. Key Strategies and Best Practices
Chapter 5. Global Market Projections: Best, Reference, and Low Case Scenarios
5.1. Growth Analysis- Case Scenario Definitions
5.2. Low Growth Case Scenario Forecasts
5.3. Reference Growth Case Scenario Forecasts
5.4. High Growth Case Scenario Forecasts
Chapter 6. Market Dynamics
6.1. Low Calorie Cake Market Drivers
6.2. Low Calorie Cake Market Challenges
6.6. Low Calorie Cake Market Opportunities
6.4. Low Calorie Cake Market Trends
Chapter 7. Global Low Calorie Cake Market Outlook Trends
7.1. Global Low Calorie Cake Revenue (USD Million) and CAGR (%) by Type (2021-2032)
7.2. Global Low Calorie Cake Revenue (USD Million) and CAGR (%) by Application (2021-2032)
7.3. Global Low Calorie Cake Revenue (USD Million) and CAGR (%) by Product (2021-2032)
By Type
Organic cake
Conventional cake
By Application
B2B
B2C
Chapter 8. Global Low Calorie Cake Regional Analysis and Outlook
8.1. Global Low Calorie Cake Revenue (USD Million) By Regions (2021- 2032)
8.2. North America Low Calorie Cake Revenue (USD Million) by Country (2021-2032)
8.2.1. United States Low Calorie Cake Regional Analysis and Outlook
8.2.2. Canada Low Calorie Cake Regional Analysis and Outlook
8.2.3. Mexico Low Calorie Cake Regional Analysis and Outlook
8.3. Europe Low Calorie Cake Revenue (USD Million), by Country (2021-2032)
8.3.1. Germany Low Calorie Cake Regional Analysis and Outlook
8.3.2. France Low Calorie Cake Regional Analysis and Outlook
8.3.3. United Kingdom Low Calorie Cake Regional Analysis and Outlook
8.3.4. Spain Low Calorie Cake Regional Analysis and Outlook
8.3.5. Italy Low Calorie Cake Regional Analysis and Outlook
8.3.6. Russia Low Calorie Cake Regional Analysis and Outlook
8.3.7. Rest of Europe Low Calorie Cake Regional Analysis and Outlook
8.4. Asia Pacific Low Calorie Cake Revenue (USD Million) by Country (2021-2032)
8.4.1. China Low Calorie Cake Regional Analysis and Outlook
8.4.2. Japan Low Calorie Cake Regional Analysis and Outlook
8.4.3. India Low Calorie Cake Regional Analysis and Outlook
8.4.4. South Korea Low Calorie Cake Regional Analysis and Outlook
8.4.5. Australia Low Calorie Cake Regional Analysis and Outlook
8.4.6. South East Asia Low Calorie Cake Regional Analysis and Outlook
8.4.7. Rest of Asia Pacific Low Calorie Cake Regional Analysis and Outlook
8.5. South America Low Calorie Cake Revenue (USD Million), by Country (2021-2032)
8.5.1. Brazil Low Calorie Cake Regional Analysis and Outlook
8.5.2. Argentina Low Calorie Cake Regional Analysis and Outlook
8.5.3. Rest of South America Low Calorie Cake Regional Analysis and Outlook
8.6. Middle East and Africa Low Calorie Cake Revenue (USD Million) by Country (2021-2032)
8.6.1. Middle East Low Calorie Cake Regional Analysis and Outlook
8.6.2. Africa Low Calorie Cake Regional Analysis and Outlook
Chapter 9. North America Low Calorie Cake Analysis and Outlook
9.1. North America Low Calorie Cake Revenue (USD Million) by Segments (2021-2032)
9.1.1. North America Low Calorie Cake Revenue (USD Million) by Type (2021-2032)
9.1.2. North America Low Calorie Cake Revenue (USD Million) by Application (2021-2032)
9.1.3. North America Low Calorie Cake Revenue (USD Million) by Product (2021-2032)
By Type
Organic cake
Conventional cake
By Application
B2B
B2C
Chapter 10. Europe Low Calorie Cake Analysis and Outlook
10.1. Europe Low Calorie Cake Revenue (USD Million), by Segments (USD Million) (2021-2032)
10.1.1. Europe Low Calorie Cake Revenue (USD Million) by Type (2021-2032)
10.1.2. Europe Low Calorie Cake Revenue (USD Million) by Application (2021-2032)
10.1.3. Europe Low Calorie Cake Revenue (USD Million) by Product (2021-2032)
By Type
Organic cake
Conventional cake
By Application
B2B
B2C
Chapter 11. Asia Pacific Low Calorie Cake Analysis and Outlook
11.1. Asia Pacific Low Calorie Cake Revenue (USD Million), and Revenue (USD Million) by Segments (2021-2032)
11.1.1. Asia Pacific Low Calorie Cake Revenue (USD Million) by Type (2021-2032)
11.1.2. Asia Pacific Low Calorie Cake Revenue (USD Million) by Application (2021-2032)
11.1.3. Asia Pacific Low Calorie Cake Revenue (USD Million) by Product (2021-2032)
By Type
Organic cake
Conventional cake
By Application
B2B
B2C
Chapter 12. South America Low Calorie Cake Analysis and Outlook
12.1. South America Low Calorie Cake Revenue (USD Million), by Segments (2021-2032)
12.1.1. South America Low Calorie Cake Revenue (USD Million) by Type (2021-2032)
12.1.2. South America Low Calorie Cake Revenue (USD Million) by Application (2021-2032)
12.1.3. South America Low Calorie Cake Revenue (USD Million) by Product (2021-2032)
By Type
Organic cake
Conventional cake
By Application
B2B
B2C
Chapter 13. Middle East and Africa Low Calorie Cake Analysis and Outlook
13.1. Middle East and Africa Low Calorie Cake Revenue (USD Million), by Segments (2021-2032)
13.1.1. Middle East and Africa Low Calorie Cake Revenue (USD Million) by Type (2021-2032)
13.1.2. Middle East and Africa Low Calorie Cake Revenue (USD Million) by Application (2021-2032)
13.1.3. Middle East and Africa Low Calorie Cake Revenue (USD Million) by Product (2021-2032)
By Type
Organic cake
Conventional cake
By Application
B2B
B2C
Chapter 14. Low Calorie Cake Company Profiles
14.1 Business Overview
14.2 Product Profiles
14.3 SWOT Profiles
14.5 Recent Developments
14.6 Financial Profile
List of Companies
David's Cookies
DuPont de Nemours Inc
General Mills Inc
Ingredion Inc
Kingdom of Cakes
Love Kupcakes Inc
Noshu Foods Pty Ltd
Smart Baking Company™
Unilever Plc
Wells Enterprises Inc
15. Methodology and Data Sources
15.1 Customization Offerings
15.2 Subscription Services
15.3 Related Reports
15.4 Publisher Expertise
LIST OF TABLES
Table 1 Market Segmentation Analysis
Table 2 Global Low Calorie Cake Market Share of Leading Companies, 2023
Table 3 Product Offerings of Leading Companies
Table 4 Low Growth Scenario Forecasts
Table 5 Reference Case Growth Scenario
Table 6 High Growth Case Scenario
Table 7 Global Low Calorie Cake Revenue (USD Million) And CAGR (%) By Type (2021-2032)
Table 8 Global Low Calorie Cake Revenue (USD Million) And CAGR (%) By Application (2021-2032)
Table 9 Global Low Calorie Cake Revenue (USD Million) And CAGR (%) By Product (2021-2032)
Table 10 Global Low Calorie Cake Market Revenue (USD Million) By Regions (2021-2032)
Table 11 Global Low Calorie Cake Market Share (%) By Regions (2021-2032)
Table 12 North America Low Calorie Cake Revenue (USD Million) By Country (2021-2032)
Table 13 Europe Low Calorie Cake Revenue (USD Million) By Country (2021-2032)
Table 14 Asia Pacific Low Calorie Cake Revenue (USD Million) By Country (2021-2032)
Table 15 South America Low Calorie Cake Revenue (USD Million) By Country (2021-2032)
Table 16 Middle East and Africa Low Calorie Cake Revenue (USD Million) By Region (2021-2032)
Table 17 North America Low Calorie Cake Revenue (USD Million) By Type (2021-2032)
Table 18 North America Low Calorie Cake Revenue (USD Million) By Application (2021-2032)
Table 19 North America Low Calorie Cake Revenue (USD Million) By Product (2021-2032)
Table 20 Europe Low Calorie Cake Revenue (USD Million) By Type (2021-2032)
Table 21 Europe Low Calorie Cake Revenue (USD Million) By Application (2021-2032)
Table 22 Europe Low Calorie Cake Revenue (USD Million) By Product (2021-2032)
Table 23 Asia Pacific Low Calorie Cake Revenue (USD Million) By Type (2021-2032)
Table 24 Asia Pacific Low Calorie Cake Revenue (USD Million) By Application (2021-2032)
Table 25 Asia Pacific Low Calorie Cake Revenue (USD Million) By Product (2021-2032)
Table 26 South America Low Calorie Cake Revenue (USD Million) By Type (2021-2032)
Table 27 South America Low Calorie Cake Revenue (USD Million) By Application (2021-2032)
Table 28 South America Low Calorie Cake Revenue (USD Million) By Product (2021-2032)
Table 29 Middle East and Africa Low Calorie Cake Revenue (USD Million) By Type (2021-2032)
Table 30 Middle East and Africa Low Calorie Cake Revenue (USD Million) By Application (2021-2032)
Table 31 Middle East and Africa Low Calorie Cake Revenue (USD Million) By Product (2021-2032)
LIST OF FIGURES
Figure 1. Market Scope
Figure 2. Pricing Forecasts Per Unit, 2023- 2032
Figure 3. Porter’s Five Forces
Figure 4. Global Low Calorie Cake Market Revenue (USD Million) By Regions (2021-2032)
Figure 5. Global Low Calorie Cake Market Share (%) By Regions (2023)
Figure 6. North America Low Calorie Cake Revenue (USD Million) By Country (2021-2032)
Figure 7. United States Low Calorie Cake Revenue (USD Million) By Country (2021-2032)
Figure 8. Canada Low Calorie Cake Revenue (USD Million) By Country (2021-2032)
Figure 9. Mexico Low Calorie Cake Revenue (USD Million) By Country (2021-2032)
Figure 10. Europe Low Calorie Cake Revenue (USD Million) By Country (2021-2032)
Figure 11. Germany Low Calorie Cake Revenue (USD Million) By Country (2021-2032)
Figure 12. France Low Calorie Cake Revenue (USD Million) By Country (2021-2032)
Figure 13. United Kingdom Low Calorie Cake Revenue (USD Million) By Country (2021-2032)
Figure 14. Spain Low Calorie Cake Revenue (USD Million) By Country (2021-2032)
Figure 15. Italy Low Calorie Cake Revenue (USD Million) By Country (2021-2032)
Figure 16. Russia Low Calorie Cake Revenue (USD Million) By Country (2021-2032)
Figure 17. Rest of Europe Low Calorie Cake Revenue (USD Million) By Country (2021-2032)
Figure 11. Asia Pacific Low Calorie Cake Revenue (USD Million) By Country (2021-2032)
Figure 12. China Low Calorie Cake Revenue (USD Million) By Country (2021-2032)
Figure 13. Japan Low Calorie Cake Revenue (USD Million) By Country (2021-2032)
Figure 14. India Low Calorie Cake Revenue (USD Million) By Country (2021-2032)
Figure 15. South Korea Low Calorie Cake Revenue (USD Million) By Country (2021-2032)
Figure 16. Australia Low Calorie Cake Revenue (USD Million) By Country (2021-2032)
Figure 17. South East Asia Low Calorie Cake Revenue (USD Million) By Country (2021-2032)
Figure 18. South America Low Calorie Cake Revenue (USD Million) By Country (2021-2032)
Figure 19. Brazil Low Calorie Cake Revenue (USD Million) By Country (2021-2032)
Figure 20. Argentina Low Calorie Cake Revenue (USD Million) By Country (2021-2032)
Figure 21. Rest of Asia Pacific Low Calorie Cake Revenue (USD Million) By Country (2021-2032)
Figure 22. Middle East and Africa Low Calorie Cake Revenue (USD Million) By Region (2021-2032)
Figure 23. Saudi Arabia Low Calorie Cake Revenue (USD Million) By Region (2021-2032)
Figure 24. The UAE Low Calorie Cake Revenue (USD Million) By Region (2021-2032)
Figure 25. Rest of Middle East Low Calorie Cake Revenue (USD Million) By Region (2021-2032)
Figure 26. South Africa Low Calorie Cake Revenue (USD Million) By Region (2021-2032)
Figure 27. Africa Low Calorie Cake Revenue (USD Million) By Region (2021-2032)
Figure 28. North America Low Calorie Cake Revenue (USD Million) By Type (2021-2032)
Figure 29. North America Low Calorie Cake Revenue (USD Million) By Application (2021-2032)
Figure 30. North America Low Calorie Cake Revenue (USD Million) By Product (2021-2032)
Figure 31. Europe Low Calorie Cake Revenue (USD Million) By Type (2021-2032)
Figure 32. Europe Low Calorie Cake Revenue (USD Million) By Application (2021-2032)
Figure 33. Europe Low Calorie Cake Revenue (USD Million) By Product (2021-2032)
Figure 34. Asia Pacific Low Calorie Cake Revenue (USD Million) By Type (2021-2032)
Figure 35. Asia Pacific Low Calorie Cake Revenue (USD Million) By Application (2021-2032)
Figure 36. Asia Pacific Low Calorie Cake Revenue (USD Million) By Product (2021-2032)
Figure 37. South America Low Calorie Cake Revenue (USD Million) By Type (2021-2032)
Figure 38. South America Low Calorie Cake Revenue (USD Million) By Application (2021-2032)
Figure 39. South America Low Calorie Cake Revenue (USD Million) By Product (2021-2032)
Figure 40. Middle East and Africa Low Calorie Cake Revenue (USD Million) By Type (2021-2032)
Figure 41. Middle East and Africa Low Calorie Cake Revenue (USD Million) By Application (2021-2032)
Figure 42. Middle East and Africa Low Calorie Cake Revenue (USD Million) By Product (2021-2032)
By Type
Organic cake
Conventional cake
By Application
B2B
B2C
Countries Analyzed
North America (US, Canada, Mexico)
Europe (Germany, UK, France, Spain, Italy, Russia, Rest of Europe)
Asia Pacific (China, India, Japan, South Korea, Australia, South East Asia, Rest of Asia)
South America (Brazil, Argentina, Rest of South America)
Middle East and Africa (Saudi Arabia, UAE, Rest of Middle East, South Africa, Egypt, Rest of Africa)
