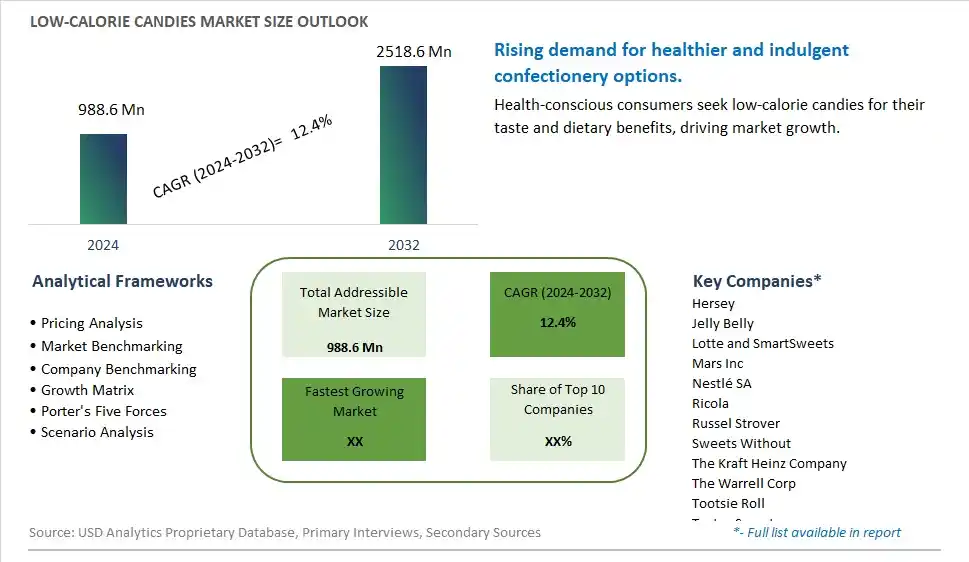
Global Low-Calorie Candies Market Size is valued at $988.6 Million in 2024 and is forecast to register a growth rate (CAGR) of 12.4% to reach $2518.6 Million by 2032.
The global Low-Calorie Candies Market Comprehensive Study analyzes and forecasts the market size across 6 regions and 24 countries for diverse segments -By Product (Soft Candy, Hard Candy, Jelly Candy), By Form (Solid Candy, Striped Candy, Layered Candy, Filled Candy), By Packaging (Paper Bags, Tin, Bottles and Jars, Stand-up Pouches, Cartons), By Flavor (Chocolate, Vanilla, Citrus Flavors, Berries, Coconut, Caramel, Others), By Distribution Channel (Supermarkets/ Hypermarkets, Convenience Stores, Specialty Stores, Online Retail, Others)
An Introduction to Low-Calorie Candies Market
The Low-Calorie Candies Market involves the production and sale of candies formulated with reduced calories, catering to health-conscious consumers seeking indulgent yet nutritious snack options. The market is driven by increasing health consciousness, rising prevalence of obesity and related health conditions, and growing demand for low-calorie and low-sugar foods. Additionally, advancements in candy formulations and the expansion of product offerings support market growth.
Low Calorie Candies Competitive Landscape
The market report analyses the leading companies in the industry including Hersey, Jelly Belly, Lotte and SmartSweets, Mars Inc, Nestlé SA, Ricola, Russel Strover, Sweets Without, The Kraft Heinz Company, The Warrell Corp, Tootsie Roll, TruJoy Sweets, and Others.
Low Calorie Candies Market Dynamics
Low-Calorie Candies Market Trend: Increasing Popularity of Guilt-Free Indulgence
The most prominent trend in the Low-Calorie Candies Market is the increasing popularity of guilt-free indulgence. Consumers are looking for candy options that allow them to enjoy sweet treats without the high calorie count. This trend is driven by the desire to balance indulgence with health and wellness goals, leading to a rise in low-calorie candy products.
Low-Calorie Candies Market Driver: Growing Health Awareness and Demand for Better-for-You Snacks
A key driver in the Low-Calorie Candies Market is growing health awareness and the demand for better-for-you snacks. As consumers become more conscious of their sugar intake and overall health, there is a rising preference for candies that offer fewer calories and healthier ingredients. This shift in consumer preferences is driving the development and popularity of low-calorie candy options.
Low-Calorie Candies Market Opportunity: Expansion into Functional and Natural Ingredients
One significant opportunity in the Low-Calorie Candies Market lies in the expansion into functional and natural ingredients. Companies can innovate by creating low-calorie candies that incorporate natural sweeteners, vitamins, and other functional ingredients that provide additional health benefits. By highlighting these attributes, manufacturers can attract health-conscious consumers and drive market growth.
Low-Calorie Candies Market Share Analysis- Largest Segment by Product
The Hard Candy segment is the largest in the Low-Calorie Candies Market by product. This dominance is driven by the high consumer demand for long-lasting, low-calorie confectionery options that offer the satisfaction of traditional candies with reduced calorie content. Hard candies are popular for their convenience, portability, and ability to provide a prolonged sweet experience, making them a preferred choice among health-conscious consumers and those seeking to manage their calorie intake. The continuous innovation in hard candy formulations, including the use of alternative sweeteners, natural flavors, and functional ingredients, enhances their appeal. Additionally, the extensive availability of low-calorie hard candies in supermarkets, convenience stores, and online platforms further boosts their accessibility to a broad consumer base. The strong consumer preference for tasty yet healthier candy options reinforces the dominant position of the hard candy segment in the market.
Low-Calorie Candies Market Share Analysis- Fastest Growing Segment by Form
The Filled Candy segment is poised to grow the fastest in the Low-Calorie Candies Market by form over the next five years. This rapid growth is driven by the increasing consumer demand for innovative and indulgent low-calorie candy options that offer a unique eating experience. Filled candies, which feature various fillings such as fruit puree, yogurt, and chocolate, provide a satisfying combination of textures and flavors, appealing to a broad range of consumers. The continuous innovation in filled candy formulations, including the use of alternative sweeteners, natural ingredients, and functional additives, supports the fast growth of this segment. Additionally, the growing trend of premiumization in the confectionery market and the increasing focus on providing indulgent yet healthier candy options drive the demand for low-calorie filled candies. The influence of consumer preferences for variety and novelty in their candy choices further contributes to the rapid growth of the filled candy segment.
Low Calorie Candies Market Segmentation
By Product
Soft Candy
Hard Candy
Jelly Candy
By Form
Solid Candy
Striped Candy
Layered Candy
Filled Candy
By Packaging
Paper Bags
Tin
Bottles and Jars
Stand-up Pouches
Cartons
By Flavor
Chocolate
Vanilla
Citrus Flavors
Berries
Coconut
Caramel
Others
By Distribution Channel
Supermarkets/ Hypermarkets
Convenience Stores
Specialty Stores
Online Retail
Others
Countries Analyzed
North America (US, Canada, Mexico)
Europe (Germany, UK, France, Spain, Italy, Russia, Rest of Europe)
Asia Pacific (China, India, Japan, South Korea, Australia, South East Asia, Rest of Asia)
South America (Brazil, Argentina, Rest of South America)
Middle East and Africa (Saudi Arabia, UAE, Rest of Middle East, South Africa, Egypt, Rest of Africa)
Low Calorie Candies Companies Profiled in the Study
Hersey
Jelly Belly
Lotte and SmartSweets
Mars Inc
Nestlé SA
Ricola
Russel Strover
Sweets Without
The Kraft Heinz Company
The Warrell Corp
Tootsie Roll
TruJoy Sweets
*- List Not Exhaustive
Chapter 1. TABLE OF CONTENTS
Chapter 2. Introduction to Low Calorie Candies Market
2.1. Market Overview
2.2. Key Statistics and Report Highlights
2.3. Scope of the Comprehensive Study
2.3.1. Market Definition
2.3.2 Countries and Regions Covered
2.3.3 Research Objective
2.3.4 Units, Currency, and Conversions
2.3.5 Industry Value Chain
2.4. Key Market Segments
2.5. Key Companies
2.6. Study Period
Chapter 3. Strategic Analysis Review
3.1. Low Calorie Candies Pricing Analysis and Forecast
3.2. Porter’s Five Forces
3.3. Market Ecosystem
3.4. SWOT Analysis
3.5. Regulatory Scenario
3.3. Effects of Inflation, Russia-Ukraine War, moderating economic growth, and other macroeconomic factors
Chapter 4. Competitive Landscape
4.1. Market Share Analysis
4.1.1. Global Low Calorie Candies Market Share by Company, 2023
4.1.2. Product Offerings of Leading Low Calorie Candies Companies
4.2. Market Entropy
4.2.1. New Product Launches in the Industry
4.2.2. Mergers, Acquisitions, Joint ventures, and Partnerships
4.3. Key Strategies and Best Practices
Chapter 5. Global Market Projections: Best, Reference, and Low Case Scenarios
5.1. Growth Analysis- Case Scenario Definitions
5.2. Low Growth Case Scenario Forecasts
5.3. Reference Growth Case Scenario Forecasts
5.4. High Growth Case Scenario Forecasts
Chapter 6. Market Dynamics
6.1. Low Calorie Candies Market Drivers
6.2. Low Calorie Candies Market Challenges
6.6. Low Calorie Candies Market Opportunities
6.4. Low Calorie Candies Market Trends
Chapter 7. Global Low Calorie Candies Market Outlook Trends
7.1. Global Low Calorie Candies Revenue (USD Million) and CAGR (%) by Type (2021-2032)
7.2. Global Low Calorie Candies Revenue (USD Million) and CAGR (%) by Application (2021-2032)
7.3. Global Low Calorie Candies Revenue (USD Million) and CAGR (%) by Product (2021-2032)
By Product
Soft Candy
Hard Candy
Jelly Candy
By Form
Solid Candy
Striped Candy
Layered Candy
Filled Candy
By Packaging
Paper Bags
Tin
Bottles and Jars
Stand-up Pouches
Cartons
By Flavor
Chocolate
Vanilla
Citrus Flavors
Berries
Coconut
Caramel
Others
By Distribution Channel
Supermarkets/ Hypermarkets
Convenience Stores
Specialty Stores
Online Retail
Others
Chapter 8. Global Low Calorie Candies Regional Analysis and Outlook
8.1. Global Low Calorie Candies Revenue (USD Million) By Regions (2021- 2032)
8.2. North America Low Calorie Candies Revenue (USD Million) by Country (2021-2032)
8.2.1. United States Low Calorie Candies Regional Analysis and Outlook
8.2.2. Canada Low Calorie Candies Regional Analysis and Outlook
8.2.3. Mexico Low Calorie Candies Regional Analysis and Outlook
8.3. Europe Low Calorie Candies Revenue (USD Million), by Country (2021-2032)
8.3.1. Germany Low Calorie Candies Regional Analysis and Outlook
8.3.2. France Low Calorie Candies Regional Analysis and Outlook
8.3.3. United Kingdom Low Calorie Candies Regional Analysis and Outlook
8.3.4. Spain Low Calorie Candies Regional Analysis and Outlook
8.3.5. Italy Low Calorie Candies Regional Analysis and Outlook
8.3.6. Russia Low Calorie Candies Regional Analysis and Outlook
8.3.7. Rest of Europe Low Calorie Candies Regional Analysis and Outlook
8.4. Asia Pacific Low Calorie Candies Revenue (USD Million) by Country (2021-2032)
8.4.1. China Low Calorie Candies Regional Analysis and Outlook
8.4.2. Japan Low Calorie Candies Regional Analysis and Outlook
8.4.3. India Low Calorie Candies Regional Analysis and Outlook
8.4.4. South Korea Low Calorie Candies Regional Analysis and Outlook
8.4.5. Australia Low Calorie Candies Regional Analysis and Outlook
8.4.6. South East Asia Low Calorie Candies Regional Analysis and Outlook
8.4.7. Rest of Asia Pacific Low Calorie Candies Regional Analysis and Outlook
8.5. South America Low Calorie Candies Revenue (USD Million), by Country (2021-2032)
8.5.1. Brazil Low Calorie Candies Regional Analysis and Outlook
8.5.2. Argentina Low Calorie Candies Regional Analysis and Outlook
8.5.3. Rest of South America Low Calorie Candies Regional Analysis and Outlook
8.6. Middle East and Africa Low Calorie Candies Revenue (USD Million) by Country (2021-2032)
8.6.1. Middle East Low Calorie Candies Regional Analysis and Outlook
8.6.2. Africa Low Calorie Candies Regional Analysis and Outlook
Chapter 9. North America Low Calorie Candies Analysis and Outlook
9.1. North America Low Calorie Candies Revenue (USD Million) by Segments (2021-2032)
9.1.1. North America Low Calorie Candies Revenue (USD Million) by Type (2021-2032)
9.1.2. North America Low Calorie Candies Revenue (USD Million) by Application (2021-2032)
9.1.3. North America Low Calorie Candies Revenue (USD Million) by Product (2021-2032)
By Product
Soft Candy
Hard Candy
Jelly Candy
By Form
Solid Candy
Striped Candy
Layered Candy
Filled Candy
By Packaging
Paper Bags
Tin
Bottles and Jars
Stand-up Pouches
Cartons
By Flavor
Chocolate
Vanilla
Citrus Flavors
Berries
Coconut
Caramel
Others
By Distribution Channel
Supermarkets/ Hypermarkets
Convenience Stores
Specialty Stores
Online Retail
Others
Chapter 10. Europe Low Calorie Candies Analysis and Outlook
10.1. Europe Low Calorie Candies Revenue (USD Million), by Segments (USD Million) (2021-2032)
10.1.1. Europe Low Calorie Candies Revenue (USD Million) by Type (2021-2032)
10.1.2. Europe Low Calorie Candies Revenue (USD Million) by Application (2021-2032)
10.1.3. Europe Low Calorie Candies Revenue (USD Million) by Product (2021-2032)
By Product
Soft Candy
Hard Candy
Jelly Candy
By Form
Solid Candy
Striped Candy
Layered Candy
Filled Candy
By Packaging
Paper Bags
Tin
Bottles and Jars
Stand-up Pouches
Cartons
By Flavor
Chocolate
Vanilla
Citrus Flavors
Berries
Coconut
Caramel
Others
By Distribution Channel
Supermarkets/ Hypermarkets
Convenience Stores
Specialty Stores
Online Retail
Others
Chapter 11. Asia Pacific Low Calorie Candies Analysis and Outlook
11.1. Asia Pacific Low Calorie Candies Revenue (USD Million), and Revenue (USD Million) by Segments (2021-2032)
11.1.1. Asia Pacific Low Calorie Candies Revenue (USD Million) by Type (2021-2032)
11.1.2. Asia Pacific Low Calorie Candies Revenue (USD Million) by Application (2021-2032)
11.1.3. Asia Pacific Low Calorie Candies Revenue (USD Million) by Product (2021-2032)
By Product
Soft Candy
Hard Candy
Jelly Candy
By Form
Solid Candy
Striped Candy
Layered Candy
Filled Candy
By Packaging
Paper Bags
Tin
Bottles and Jars
Stand-up Pouches
Cartons
By Flavor
Chocolate
Vanilla
Citrus Flavors
Berries
Coconut
Caramel
Others
By Distribution Channel
Supermarkets/ Hypermarkets
Convenience Stores
Specialty Stores
Online Retail
Others
Chapter 12. South America Low Calorie Candies Analysis and Outlook
12.1. South America Low Calorie Candies Revenue (USD Million), by Segments (2021-2032)
12.1.1. South America Low Calorie Candies Revenue (USD Million) by Type (2021-2032)
12.1.2. South America Low Calorie Candies Revenue (USD Million) by Application (2021-2032)
12.1.3. South America Low Calorie Candies Revenue (USD Million) by Product (2021-2032)
By Product
Soft Candy
Hard Candy
Jelly Candy
By Form
Solid Candy
Striped Candy
Layered Candy
Filled Candy
By Packaging
Paper Bags
Tin
Bottles and Jars
Stand-up Pouches
Cartons
By Flavor
Chocolate
Vanilla
Citrus Flavors
Berries
Coconut
Caramel
Others
By Distribution Channel
Supermarkets/ Hypermarkets
Convenience Stores
Specialty Stores
Online Retail
Others
Chapter 13. Middle East and Africa Low Calorie Candies Analysis and Outlook
13.1. Middle East and Africa Low Calorie Candies Revenue (USD Million), by Segments (2021-2032)
13.1.1. Middle East and Africa Low Calorie Candies Revenue (USD Million) by Type (2021-2032)
13.1.2. Middle East and Africa Low Calorie Candies Revenue (USD Million) by Application (2021-2032)
13.1.3. Middle East and Africa Low Calorie Candies Revenue (USD Million) by Product (2021-2032)
By Product
Soft Candy
Hard Candy
Jelly Candy
By Form
Solid Candy
Striped Candy
Layered Candy
Filled Candy
By Packaging
Paper Bags
Tin
Bottles and Jars
Stand-up Pouches
Cartons
By Flavor
Chocolate
Vanilla
Citrus Flavors
Berries
Coconut
Caramel
Others
By Distribution Channel
Supermarkets/ Hypermarkets
Convenience Stores
Specialty Stores
Online Retail
Others
Chapter 14. Low Calorie Candies Company Profiles
14.1 Business Overview
14.2 Product Profiles
14.3 SWOT Profiles
14.5 Recent Developments
14.6 Financial Profile
List of Companies
Hersey
Jelly Belly
Lotte and SmartSweets
Mars Inc
Nestlé SA
Ricola
Russel Strover
Sweets Without
The Kraft Heinz Company
The Warrell Corp
Tootsie Roll
TruJoy Sweets
15. Methodology and Data Sources
15.1 Customization Offerings
15.2 Subscription Services
15.3 Related Reports
15.4 Publisher Expertise
LIST OF TABLES
Table 1 Market Segmentation Analysis
Table 2 Global Low Calorie Candies Market Share of Leading Companies, 2023
Table 3 Product Offerings of Leading Companies
Table 4 Low Growth Scenario Forecasts
Table 5 Reference Case Growth Scenario
Table 6 High Growth Case Scenario
Table 7 Global Low Calorie Candies Revenue (USD Million) And CAGR (%) By Type (2021-2032)
Table 8 Global Low Calorie Candies Revenue (USD Million) And CAGR (%) By Application (2021-2032)
Table 9 Global Low Calorie Candies Revenue (USD Million) And CAGR (%) By Product (2021-2032)
Table 10 Global Low Calorie Candies Market Revenue (USD Million) By Regions (2021-2032)
Table 11 Global Low Calorie Candies Market Share (%) By Regions (2021-2032)
Table 12 North America Low Calorie Candies Revenue (USD Million) By Country (2021-2032)
Table 13 Europe Low Calorie Candies Revenue (USD Million) By Country (2021-2032)
Table 14 Asia Pacific Low Calorie Candies Revenue (USD Million) By Country (2021-2032)
Table 15 South America Low Calorie Candies Revenue (USD Million) By Country (2021-2032)
Table 16 Middle East and Africa Low Calorie Candies Revenue (USD Million) By Region (2021-2032)
Table 17 North America Low Calorie Candies Revenue (USD Million) By Type (2021-2032)
Table 18 North America Low Calorie Candies Revenue (USD Million) By Application (2021-2032)
Table 19 North America Low Calorie Candies Revenue (USD Million) By Product (2021-2032)
Table 20 Europe Low Calorie Candies Revenue (USD Million) By Type (2021-2032)
Table 21 Europe Low Calorie Candies Revenue (USD Million) By Application (2021-2032)
Table 22 Europe Low Calorie Candies Revenue (USD Million) By Product (2021-2032)
Table 23 Asia Pacific Low Calorie Candies Revenue (USD Million) By Type (2021-2032)
Table 24 Asia Pacific Low Calorie Candies Revenue (USD Million) By Application (2021-2032)
Table 25 Asia Pacific Low Calorie Candies Revenue (USD Million) By Product (2021-2032)
Table 26 South America Low Calorie Candies Revenue (USD Million) By Type (2021-2032)
Table 27 South America Low Calorie Candies Revenue (USD Million) By Application (2021-2032)
Table 28 South America Low Calorie Candies Revenue (USD Million) By Product (2021-2032)
Table 29 Middle East and Africa Low Calorie Candies Revenue (USD Million) By Type (2021-2032)
Table 30 Middle East and Africa Low Calorie Candies Revenue (USD Million) By Application (2021-2032)
Table 31 Middle East and Africa Low Calorie Candies Revenue (USD Million) By Product (2021-2032)
LIST OF FIGURES
Figure 1. Market Scope
Figure 2. Pricing Forecasts Per Unit, 2023- 2032
Figure 3. Porter’s Five Forces
Figure 4. Global Low Calorie Candies Market Revenue (USD Million) By Regions (2021-2032)
Figure 5. Global Low Calorie Candies Market Share (%) By Regions (2023)
Figure 6. North America Low Calorie Candies Revenue (USD Million) By Country (2021-2032)
Figure 7. United States Low Calorie Candies Revenue (USD Million) By Country (2021-2032)
Figure 8. Canada Low Calorie Candies Revenue (USD Million) By Country (2021-2032)
Figure 9. Mexico Low Calorie Candies Revenue (USD Million) By Country (2021-2032)
Figure 10. Europe Low Calorie Candies Revenue (USD Million) By Country (2021-2032)
Figure 11. Germany Low Calorie Candies Revenue (USD Million) By Country (2021-2032)
Figure 12. France Low Calorie Candies Revenue (USD Million) By Country (2021-2032)
Figure 13. United Kingdom Low Calorie Candies Revenue (USD Million) By Country (2021-2032)
Figure 14. Spain Low Calorie Candies Revenue (USD Million) By Country (2021-2032)
Figure 15. Italy Low Calorie Candies Revenue (USD Million) By Country (2021-2032)
Figure 16. Russia Low Calorie Candies Revenue (USD Million) By Country (2021-2032)
Figure 17. Rest of Europe Low Calorie Candies Revenue (USD Million) By Country (2021-2032)
Figure 11. Asia Pacific Low Calorie Candies Revenue (USD Million) By Country (2021-2032)
Figure 12. China Low Calorie Candies Revenue (USD Million) By Country (2021-2032)
Figure 13. Japan Low Calorie Candies Revenue (USD Million) By Country (2021-2032)
Figure 14. India Low Calorie Candies Revenue (USD Million) By Country (2021-2032)
Figure 15. South Korea Low Calorie Candies Revenue (USD Million) By Country (2021-2032)
Figure 16. Australia Low Calorie Candies Revenue (USD Million) By Country (2021-2032)
Figure 17. South East Asia Low Calorie Candies Revenue (USD Million) By Country (2021-2032)
Figure 18. South America Low Calorie Candies Revenue (USD Million) By Country (2021-2032)
Figure 19. Brazil Low Calorie Candies Revenue (USD Million) By Country (2021-2032)
Figure 20. Argentina Low Calorie Candies Revenue (USD Million) By Country (2021-2032)
Figure 21. Rest of Asia Pacific Low Calorie Candies Revenue (USD Million) By Country (2021-2032)
Figure 22. Middle East and Africa Low Calorie Candies Revenue (USD Million) By Region (2021-2032)
Figure 23. Saudi Arabia Low Calorie Candies Revenue (USD Million) By Region (2021-2032)
Figure 24. The UAE Low Calorie Candies Revenue (USD Million) By Region (2021-2032)
Figure 25. Rest of Middle East Low Calorie Candies Revenue (USD Million) By Region (2021-2032)
Figure 26. South Africa Low Calorie Candies Revenue (USD Million) By Region (2021-2032)
Figure 27. Africa Low Calorie Candies Revenue (USD Million) By Region (2021-2032)
Figure 28. North America Low Calorie Candies Revenue (USD Million) By Type (2021-2032)
Figure 29. North America Low Calorie Candies Revenue (USD Million) By Application (2021-2032)
Figure 30. North America Low Calorie Candies Revenue (USD Million) By Product (2021-2032)
Figure 31. Europe Low Calorie Candies Revenue (USD Million) By Type (2021-2032)
Figure 32. Europe Low Calorie Candies Revenue (USD Million) By Application (2021-2032)
Figure 33. Europe Low Calorie Candies Revenue (USD Million) By Product (2021-2032)
Figure 34. Asia Pacific Low Calorie Candies Revenue (USD Million) By Type (2021-2032)
Figure 35. Asia Pacific Low Calorie Candies Revenue (USD Million) By Application (2021-2032)
Figure 36. Asia Pacific Low Calorie Candies Revenue (USD Million) By Product (2021-2032)
Figure 37. South America Low Calorie Candies Revenue (USD Million) By Type (2021-2032)
Figure 38. South America Low Calorie Candies Revenue (USD Million) By Application (2021-2032)
Figure 39. South America Low Calorie Candies Revenue (USD Million) By Product (2021-2032)
Figure 40. Middle East and Africa Low Calorie Candies Revenue (USD Million) By Type (2021-2032)
Figure 41. Middle East and Africa Low Calorie Candies Revenue (USD Million) By Application (2021-2032)
Figure 42. Middle East and Africa Low Calorie Candies Revenue (USD Million) By Product (2021-2032)
By Product
Soft Candy
Hard Candy
Jelly Candy
By Form
Solid Candy
Striped Candy
Layered Candy
Filled Candy
By Packaging
Paper Bags
Tin
Bottles and Jars
Stand-up Pouches
Cartons
By Flavor
Chocolate
Vanilla
Citrus Flavors
Berries
Coconut
Caramel
Others
By Distribution Channel
Supermarkets/ Hypermarkets
Convenience Stores
Specialty Stores
Online Retail
Others
Countries Analyzed
North America (US, Canada, Mexico)
Europe (Germany, UK, France, Spain, Italy, Russia, Rest of Europe)
Asia Pacific (China, India, Japan, South Korea, Australia, South East Asia, Rest of Asia)
South America (Brazil, Argentina, Rest of South America)
Middle East and Africa (Saudi Arabia, UAE, Rest of Middle East, South Africa, Egypt, Rest of Africa)
