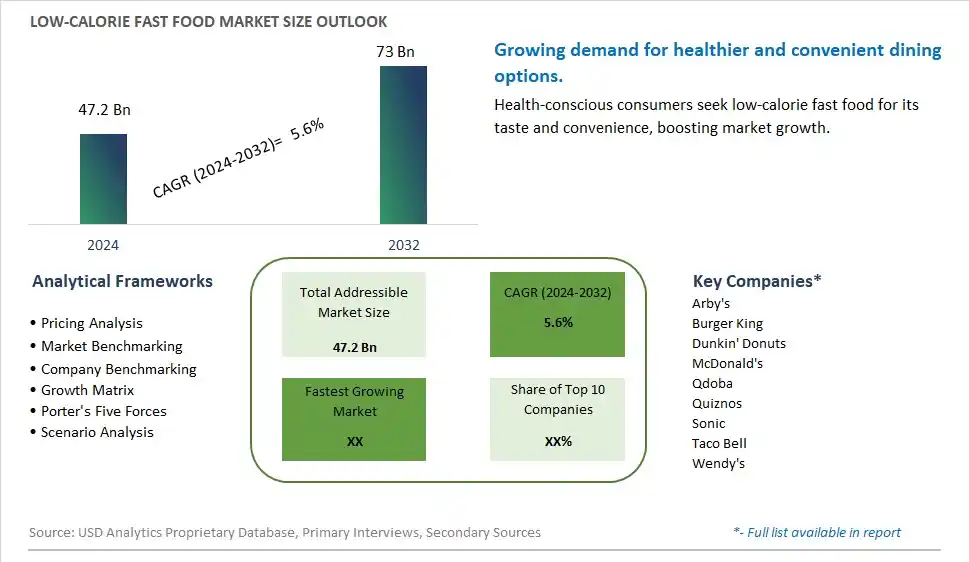
Global Low-Calorie Fast Food Market Size is valued at $47.2 Billion in 2024 and is forecast to register a growth rate (CAGR) of 5.6% to reach $73 Billion by 2032.
The global Low-Calorie Fast Food Market Comprehensive Study analyzes and forecasts the market size across 6 regions and 24 countries for diverse segments -By Type (Low Calorie Burger, Low Calorie Sandwich, Low Calorie Chicken Nuggets, Others), By Application (Dine In, Takeout)
An Introduction to Low-Calorie Fast Food Market
The Low-Calorie Fast Food Market involves the production and sale of fast food items formulated with reduced calories, catering to health-conscious consumers seeking convenient yet nutritious meal options. The market is driven by increasing health consciousness, rising prevalence of obesity and related health conditions, and growing demand for low-calorie and low-sugar foods. Additionally, innovations in fast food formulations and the expansion of product offerings support market growth.
Low Calorie Fast Food Competitive Landscape
The market report analyses the leading companies in the industry including Arby's, Burger King, Dunkin' Donuts, McDonald's, Qdoba, Quiznos, Sonic, Taco Bell, Wendy's, and Others.
Low Calorie Fast Food Market Dynamics
Low-Calorie Fast Food Market Trend: Growing Demand for Healthier Quick-Service Options
The most prominent trend in the Low-Calorie Fast Food Market is the growing demand for healthier quick-service options. Consumers are increasingly seeking fast food that provides convenience without compromising on nutritional value. This trend is driven by the desire for quick meals that support health and wellness goals, leading to a rise in low-calorie fast food offerings.
Low-Calorie Fast Food Market Driver: Health Consciousness and Changing Dietary Preferences
A key driver in the Low-Calorie Fast Food Market is health consciousness and changing dietary preferences. As more individuals adopt healthier eating habits, there is a rising demand for fast food that aligns with these preferences. Low-calorie fast food, which offers lighter and more nutritious options, caters to this demand and supports market growth.
Low-Calorie Fast Food Market Opportunity: Expansion into Menu Diversification and Customization
One significant opportunity in the Low-Calorie Fast Food Market lies in expansion into menu diversification and customization. Companies can innovate by offering a wider variety of low-calorie menu items, such as salads, wraps, and grilled options, and allowing customers to customize their meals according to their dietary needs. By providing diverse and personalized choices, manufacturers can attract health-conscious consumers and drive market growth.
Low-Calorie Fast Food Market Share Analysis- Largest Segment by Type
The Low Calorie Burger segment is the largest in the Low-Calorie Fast Food Market by type. This dominance is driven by the high consumer demand for healthier fast food options that offer the indulgence of traditional burgers with reduced calorie content. Low-calorie burgers, made with lean meats, plant-based proteins, and lower-calorie ingredients, provide a satisfying and healthier alternative to regular burgers, making them a popular choice among health-conscious consumers. The continuous innovation in low-calorie burger formulations, including the use of whole grains, vegetable toppings, and reduced-fat condiments, enhances their appeal. Additionally, the growing trend of health and wellness supports the significant market share of the low-calorie burger segment, as consumers seek nutritious and tasty fast food options. The extensive availability of low-calorie burgers in fast food chains, restaurants, and online delivery platforms further boosts their accessibility to a broad consumer base. The strong consumer preference for convenient and healthier fast food choices reinforces the dominant position of the low-calorie burger segment in the market.
Low-Calorie Fast Food Market Share Analysis- Fastest Growing Segment by Application
The Takeout segment is poised to grow the fastest in the Low-Calorie Fast Food Market by application over the next five years. This rapid growth is driven by the increasing consumer preference for the convenience and flexibility of takeout dining. Takeout options provide consumers with the ability to enjoy low-calorie fast food at their convenience, whether at home, work, or on-the-go. The continuous innovation in takeout packaging, including eco-friendly and heat-retaining solutions, enhances the appeal of takeout dining. Additionally, the growing trend of food delivery services and online ordering platforms supports the fast growth of the takeout segment, as consumers seek quick and convenient meal options. The influence of busy lifestyles and the increasing focus on providing accessible and healthy fast food choices contribute to the rapid growth of the takeout segment.
Low Calorie Fast Food Market Segmentation
By Type
Low Calorie Burger
Low Calorie Sandwich
Low Calorie Chicken Nuggets
Others
By Application
Dine In
Takeout
Countries Analyzed
North America (US, Canada, Mexico)
Europe (Germany, UK, France, Spain, Italy, Russia, Rest of Europe)
Asia Pacific (China, India, Japan, South Korea, Australia, South East Asia, Rest of Asia)
South America (Brazil, Argentina, Rest of South America)
Middle East and Africa (Saudi Arabia, UAE, Rest of Middle East, South Africa, Egypt, Rest of Africa)
Low Calorie Fast Food Companies Profiled in the Study
Arby's
Burger King
Dunkin' Donuts
McDonald's
Qdoba
Quiznos
Sonic
Taco Bell
Wendy's
*- List Not Exhaustive
Chapter 1. TABLE OF CONTENTS
Chapter 2. Introduction to Low Calorie Fast Food Market
2.1. Market Overview
2.2. Key Statistics and Report Highlights
2.3. Scope of the Comprehensive Study
2.3.1. Market Definition
2.3.2 Countries and Regions Covered
2.3.3 Research Objective
2.3.4 Units, Currency, and Conversions
2.3.5 Industry Value Chain
2.4. Key Market Segments
2.5. Key Companies
2.6. Study Period
Chapter 3. Strategic Analysis Review
3.1. Low Calorie Fast Food Pricing Analysis and Forecast
3.2. Porter’s Five Forces
3.3. Market Ecosystem
3.4. SWOT Analysis
3.5. Regulatory Scenario
3.3. Effects of Inflation, Russia-Ukraine War, moderating economic growth, and other macroeconomic factors
Chapter 4. Competitive Landscape
4.1. Market Share Analysis
4.1.1. Global Low Calorie Fast Food Market Share by Company, 2023
4.1.2. Product Offerings of Leading Low Calorie Fast Food Companies
4.2. Market Entropy
4.2.1. New Product Launches in the Industry
4.2.2. Mergers, Acquisitions, Joint ventures, and Partnerships
4.3. Key Strategies and Best Practices
Chapter 5. Global Market Projections: Best, Reference, and Low Case Scenarios
5.1. Growth Analysis- Case Scenario Definitions
5.2. Low Growth Case Scenario Forecasts
5.3. Reference Growth Case Scenario Forecasts
5.4. High Growth Case Scenario Forecasts
Chapter 6. Market Dynamics
6.1. Low Calorie Fast Food Market Drivers
6.2. Low Calorie Fast Food Market Challenges
6.6. Low Calorie Fast Food Market Opportunities
6.4. Low Calorie Fast Food Market Trends
Chapter 7. Global Low Calorie Fast Food Market Outlook Trends
7.1. Global Low Calorie Fast Food Revenue (USD Million) and CAGR (%) by Type (2021-2032)
7.2. Global Low Calorie Fast Food Revenue (USD Million) and CAGR (%) by Application (2021-2032)
7.3. Global Low Calorie Fast Food Revenue (USD Million) and CAGR (%) by Product (2021-2032)
By Type
Low Calorie Burger
Low Calorie Sandwich
Low Calorie Chicken Nuggets
Others
By Application
Dine In
Takeout
Chapter 8. Global Low Calorie Fast Food Regional Analysis and Outlook
8.1. Global Low Calorie Fast Food Revenue (USD Million) By Regions (2021- 2032)
8.2. North America Low Calorie Fast Food Revenue (USD Million) by Country (2021-2032)
8.2.1. United States Low Calorie Fast Food Regional Analysis and Outlook
8.2.2. Canada Low Calorie Fast Food Regional Analysis and Outlook
8.2.3. Mexico Low Calorie Fast Food Regional Analysis and Outlook
8.3. Europe Low Calorie Fast Food Revenue (USD Million), by Country (2021-2032)
8.3.1. Germany Low Calorie Fast Food Regional Analysis and Outlook
8.3.2. France Low Calorie Fast Food Regional Analysis and Outlook
8.3.3. United Kingdom Low Calorie Fast Food Regional Analysis and Outlook
8.3.4. Spain Low Calorie Fast Food Regional Analysis and Outlook
8.3.5. Italy Low Calorie Fast Food Regional Analysis and Outlook
8.3.6. Russia Low Calorie Fast Food Regional Analysis and Outlook
8.3.7. Rest of Europe Low Calorie Fast Food Regional Analysis and Outlook
8.4. Asia Pacific Low Calorie Fast Food Revenue (USD Million) by Country (2021-2032)
8.4.1. China Low Calorie Fast Food Regional Analysis and Outlook
8.4.2. Japan Low Calorie Fast Food Regional Analysis and Outlook
8.4.3. India Low Calorie Fast Food Regional Analysis and Outlook
8.4.4. South Korea Low Calorie Fast Food Regional Analysis and Outlook
8.4.5. Australia Low Calorie Fast Food Regional Analysis and Outlook
8.4.6. South East Asia Low Calorie Fast Food Regional Analysis and Outlook
8.4.7. Rest of Asia Pacific Low Calorie Fast Food Regional Analysis and Outlook
8.5. South America Low Calorie Fast Food Revenue (USD Million), by Country (2021-2032)
8.5.1. Brazil Low Calorie Fast Food Regional Analysis and Outlook
8.5.2. Argentina Low Calorie Fast Food Regional Analysis and Outlook
8.5.3. Rest of South America Low Calorie Fast Food Regional Analysis and Outlook
8.6. Middle East and Africa Low Calorie Fast Food Revenue (USD Million) by Country (2021-2032)
8.6.1. Middle East Low Calorie Fast Food Regional Analysis and Outlook
8.6.2. Africa Low Calorie Fast Food Regional Analysis and Outlook
Chapter 9. North America Low Calorie Fast Food Analysis and Outlook
9.1. North America Low Calorie Fast Food Revenue (USD Million) by Segments (2021-2032)
9.1.1. North America Low Calorie Fast Food Revenue (USD Million) by Type (2021-2032)
9.1.2. North America Low Calorie Fast Food Revenue (USD Million) by Application (2021-2032)
9.1.3. North America Low Calorie Fast Food Revenue (USD Million) by Product (2021-2032)
By Type
Low Calorie Burger
Low Calorie Sandwich
Low Calorie Chicken Nuggets
Others
By Application
Dine In
Takeout
Chapter 10. Europe Low Calorie Fast Food Analysis and Outlook
10.1. Europe Low Calorie Fast Food Revenue (USD Million), by Segments (USD Million) (2021-2032)
10.1.1. Europe Low Calorie Fast Food Revenue (USD Million) by Type (2021-2032)
10.1.2. Europe Low Calorie Fast Food Revenue (USD Million) by Application (2021-2032)
10.1.3. Europe Low Calorie Fast Food Revenue (USD Million) by Product (2021-2032)
By Type
Low Calorie Burger
Low Calorie Sandwich
Low Calorie Chicken Nuggets
Others
By Application
Dine In
Takeout
Chapter 11. Asia Pacific Low Calorie Fast Food Analysis and Outlook
11.1. Asia Pacific Low Calorie Fast Food Revenue (USD Million), and Revenue (USD Million) by Segments (2021-2032)
11.1.1. Asia Pacific Low Calorie Fast Food Revenue (USD Million) by Type (2021-2032)
11.1.2. Asia Pacific Low Calorie Fast Food Revenue (USD Million) by Application (2021-2032)
11.1.3. Asia Pacific Low Calorie Fast Food Revenue (USD Million) by Product (2021-2032)
By Type
Low Calorie Burger
Low Calorie Sandwich
Low Calorie Chicken Nuggets
Others
By Application
Dine In
Takeout
Chapter 12. South America Low Calorie Fast Food Analysis and Outlook
12.1. South America Low Calorie Fast Food Revenue (USD Million), by Segments (2021-2032)
12.1.1. South America Low Calorie Fast Food Revenue (USD Million) by Type (2021-2032)
12.1.2. South America Low Calorie Fast Food Revenue (USD Million) by Application (2021-2032)
12.1.3. South America Low Calorie Fast Food Revenue (USD Million) by Product (2021-2032)
By Type
Low Calorie Burger
Low Calorie Sandwich
Low Calorie Chicken Nuggets
Others
By Application
Dine In
Takeout
Chapter 13. Middle East and Africa Low Calorie Fast Food Analysis and Outlook
13.1. Middle East and Africa Low Calorie Fast Food Revenue (USD Million), by Segments (2021-2032)
13.1.1. Middle East and Africa Low Calorie Fast Food Revenue (USD Million) by Type (2021-2032)
13.1.2. Middle East and Africa Low Calorie Fast Food Revenue (USD Million) by Application (2021-2032)
13.1.3. Middle East and Africa Low Calorie Fast Food Revenue (USD Million) by Product (2021-2032)
By Type
Low Calorie Burger
Low Calorie Sandwich
Low Calorie Chicken Nuggets
Others
By Application
Dine In
Takeout
Chapter 14. Low Calorie Fast Food Company Profiles
14.1 Business Overview
14.2 Product Profiles
14.3 SWOT Profiles
14.5 Recent Developments
14.6 Financial Profile
List of Companies
Arby's
Burger King
Dunkin' Donuts
McDonald's
Qdoba
Quiznos
Sonic
Taco Bell
Wendy's
15. Methodology and Data Sources
15.1 Customization Offerings
15.2 Subscription Services
15.3 Related Reports
15.4 Publisher Expertise
LIST OF TABLES
Table 1 Market Segmentation Analysis
Table 2 Global Low Calorie Fast Food Market Share of Leading Companies, 2023
Table 3 Product Offerings of Leading Companies
Table 4 Low Growth Scenario Forecasts
Table 5 Reference Case Growth Scenario
Table 6 High Growth Case Scenario
Table 7 Global Low Calorie Fast Food Revenue (USD Million) And CAGR (%) By Type (2021-2032)
Table 8 Global Low Calorie Fast Food Revenue (USD Million) And CAGR (%) By Application (2021-2032)
Table 9 Global Low Calorie Fast Food Revenue (USD Million) And CAGR (%) By Product (2021-2032)
Table 10 Global Low Calorie Fast Food Market Revenue (USD Million) By Regions (2021-2032)
Table 11 Global Low Calorie Fast Food Market Share (%) By Regions (2021-2032)
Table 12 North America Low Calorie Fast Food Revenue (USD Million) By Country (2021-2032)
Table 13 Europe Low Calorie Fast Food Revenue (USD Million) By Country (2021-2032)
Table 14 Asia Pacific Low Calorie Fast Food Revenue (USD Million) By Country (2021-2032)
Table 15 South America Low Calorie Fast Food Revenue (USD Million) By Country (2021-2032)
Table 16 Middle East and Africa Low Calorie Fast Food Revenue (USD Million) By Region (2021-2032)
Table 17 North America Low Calorie Fast Food Revenue (USD Million) By Type (2021-2032)
Table 18 North America Low Calorie Fast Food Revenue (USD Million) By Application (2021-2032)
Table 19 North America Low Calorie Fast Food Revenue (USD Million) By Product (2021-2032)
Table 20 Europe Low Calorie Fast Food Revenue (USD Million) By Type (2021-2032)
Table 21 Europe Low Calorie Fast Food Revenue (USD Million) By Application (2021-2032)
Table 22 Europe Low Calorie Fast Food Revenue (USD Million) By Product (2021-2032)
Table 23 Asia Pacific Low Calorie Fast Food Revenue (USD Million) By Type (2021-2032)
Table 24 Asia Pacific Low Calorie Fast Food Revenue (USD Million) By Application (2021-2032)
Table 25 Asia Pacific Low Calorie Fast Food Revenue (USD Million) By Product (2021-2032)
Table 26 South America Low Calorie Fast Food Revenue (USD Million) By Type (2021-2032)
Table 27 South America Low Calorie Fast Food Revenue (USD Million) By Application (2021-2032)
Table 28 South America Low Calorie Fast Food Revenue (USD Million) By Product (2021-2032)
Table 29 Middle East and Africa Low Calorie Fast Food Revenue (USD Million) By Type (2021-2032)
Table 30 Middle East and Africa Low Calorie Fast Food Revenue (USD Million) By Application (2021-2032)
Table 31 Middle East and Africa Low Calorie Fast Food Revenue (USD Million) By Product (2021-2032)
LIST OF FIGURES
Figure 1. Market Scope
Figure 2. Pricing Forecasts Per Unit, 2023- 2032
Figure 3. Porter’s Five Forces
Figure 4. Global Low Calorie Fast Food Market Revenue (USD Million) By Regions (2021-2032)
Figure 5. Global Low Calorie Fast Food Market Share (%) By Regions (2023)
Figure 6. North America Low Calorie Fast Food Revenue (USD Million) By Country (2021-2032)
Figure 7. United States Low Calorie Fast Food Revenue (USD Million) By Country (2021-2032)
Figure 8. Canada Low Calorie Fast Food Revenue (USD Million) By Country (2021-2032)
Figure 9. Mexico Low Calorie Fast Food Revenue (USD Million) By Country (2021-2032)
Figure 10. Europe Low Calorie Fast Food Revenue (USD Million) By Country (2021-2032)
Figure 11. Germany Low Calorie Fast Food Revenue (USD Million) By Country (2021-2032)
Figure 12. France Low Calorie Fast Food Revenue (USD Million) By Country (2021-2032)
Figure 13. United Kingdom Low Calorie Fast Food Revenue (USD Million) By Country (2021-2032)
Figure 14. Spain Low Calorie Fast Food Revenue (USD Million) By Country (2021-2032)
Figure 15. Italy Low Calorie Fast Food Revenue (USD Million) By Country (2021-2032)
Figure 16. Russia Low Calorie Fast Food Revenue (USD Million) By Country (2021-2032)
Figure 17. Rest of Europe Low Calorie Fast Food Revenue (USD Million) By Country (2021-2032)
Figure 11. Asia Pacific Low Calorie Fast Food Revenue (USD Million) By Country (2021-2032)
Figure 12. China Low Calorie Fast Food Revenue (USD Million) By Country (2021-2032)
Figure 13. Japan Low Calorie Fast Food Revenue (USD Million) By Country (2021-2032)
Figure 14. India Low Calorie Fast Food Revenue (USD Million) By Country (2021-2032)
Figure 15. South Korea Low Calorie Fast Food Revenue (USD Million) By Country (2021-2032)
Figure 16. Australia Low Calorie Fast Food Revenue (USD Million) By Country (2021-2032)
Figure 17. South East Asia Low Calorie Fast Food Revenue (USD Million) By Country (2021-2032)
Figure 18. South America Low Calorie Fast Food Revenue (USD Million) By Country (2021-2032)
Figure 19. Brazil Low Calorie Fast Food Revenue (USD Million) By Country (2021-2032)
Figure 20. Argentina Low Calorie Fast Food Revenue (USD Million) By Country (2021-2032)
Figure 21. Rest of Asia Pacific Low Calorie Fast Food Revenue (USD Million) By Country (2021-2032)
Figure 22. Middle East and Africa Low Calorie Fast Food Revenue (USD Million) By Region (2021-2032)
Figure 23. Saudi Arabia Low Calorie Fast Food Revenue (USD Million) By Region (2021-2032)
Figure 24. The UAE Low Calorie Fast Food Revenue (USD Million) By Region (2021-2032)
Figure 25. Rest of Middle East Low Calorie Fast Food Revenue (USD Million) By Region (2021-2032)
Figure 26. South Africa Low Calorie Fast Food Revenue (USD Million) By Region (2021-2032)
Figure 27. Africa Low Calorie Fast Food Revenue (USD Million) By Region (2021-2032)
Figure 28. North America Low Calorie Fast Food Revenue (USD Million) By Type (2021-2032)
Figure 29. North America Low Calorie Fast Food Revenue (USD Million) By Application (2021-2032)
Figure 30. North America Low Calorie Fast Food Revenue (USD Million) By Product (2021-2032)
Figure 31. Europe Low Calorie Fast Food Revenue (USD Million) By Type (2021-2032)
Figure 32. Europe Low Calorie Fast Food Revenue (USD Million) By Application (2021-2032)
Figure 33. Europe Low Calorie Fast Food Revenue (USD Million) By Product (2021-2032)
Figure 34. Asia Pacific Low Calorie Fast Food Revenue (USD Million) By Type (2021-2032)
Figure 35. Asia Pacific Low Calorie Fast Food Revenue (USD Million) By Application (2021-2032)
Figure 36. Asia Pacific Low Calorie Fast Food Revenue (USD Million) By Product (2021-2032)
Figure 37. South America Low Calorie Fast Food Revenue (USD Million) By Type (2021-2032)
Figure 38. South America Low Calorie Fast Food Revenue (USD Million) By Application (2021-2032)
Figure 39. South America Low Calorie Fast Food Revenue (USD Million) By Product (2021-2032)
Figure 40. Middle East and Africa Low Calorie Fast Food Revenue (USD Million) By Type (2021-2032)
Figure 41. Middle East and Africa Low Calorie Fast Food Revenue (USD Million) By Application (2021-2032)
Figure 42. Middle East and Africa Low Calorie Fast Food Revenue (USD Million) By Product (2021-2032)
By Type
Low Calorie Burger
Low Calorie Sandwich
Low Calorie Chicken Nuggets
Others
By Application
Dine In
Takeout
Countries Analyzed
North America (US, Canada, Mexico)
Europe (Germany, UK, France, Spain, Italy, Russia, Rest of Europe)
Asia Pacific (China, India, Japan, South Korea, Australia, South East Asia, Rest of Asia)
South America (Brazil, Argentina, Rest of South America)
Middle East and Africa (Saudi Arabia, UAE, Rest of Middle East, South Africa, Egypt, Rest of Africa)
