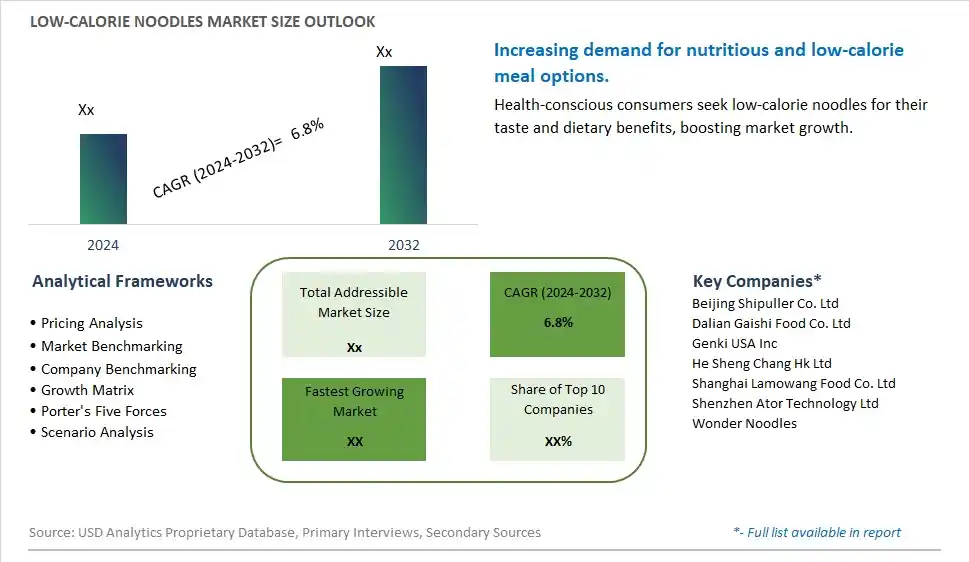
Global Low-Calorie Noodles Market Size is valued at $XX Million in 2024 and is forecast to register a growth rate (CAGR) of 6.8% to reach $XX Million by 2032.
The global Low-Calorie Noodles Market Comprehensive Study analyzes and forecasts the market size across 6 regions and 24 countries for diverse segments -By Type (Vegetable, Chicken, Sea Food, Others), By Application (Wheat, Rice, Legumes, Buck Wheat, Oats, Quinoa, Others)
An Introduction to Low-Calorie Noodles Market
The Low-Calorie Noodles Market involves the production and sale of noodles formulated with reduced calories, catering to health-conscious consumers seeking convenient yet nutritious meal options. The market is driven by increasing health consciousness, rising prevalence of obesity and related health conditions, and growing demand for low-calorie and low-sugar foods. Additionally, advancements in noodle formulations and the expansion of product offerings support market growth.
Low Calorie Noodles Competitive Landscape
The market report analyses the leading companies in the industry including Beijing Shipuller Co. Ltd, Dalian Gaishi Food Co. Ltd, Genki USA Inc, He Sheng Chang Hk Ltd, Shanghai Lamowang Food Co. Ltd, Shenzhen Ator Technology Ltd, Wonder Noodles, and Others.
Low Calorie Noodles Market Dynamics
Low-Calorie Noodles Market Trend: Rising Popularity of Low-Carb and Low-Calorie Diets
The most prominent trend in the Low-Calorie Noodles Market is the rising popularity of low-carb and low-calorie diets. Consumers are increasingly seeking noodle options that allow them to enjoy their favorite dishes without the high calorie and carbohydrate content. This trend is driven by the growing interest in weight management and healthier eating habits.
Low-Calorie Noodles Market Driver: Health Consciousness and Demand for Alternative Noodles
A key driver in the Low-Calorie Noodles Market is health consciousness and the demand for alternative noodles. As more individuals adopt healthier eating habits, there is a rising demand for noodles made from alternative ingredients such as konjac, zucchini, or cauliflower. These low-calorie options cater to health-conscious consumers and support market growth.
Low-Calorie Noodles Market Opportunity: Expansion into Ready-to-Eat and Convenience Products
One significant opportunity in the Low-Calorie Noodles Market lies in expansion into ready-to-eat and convenience products. Companies can innovate by creating pre-packaged low-calorie noodle meals that are quick and easy to prepare, catering to busy consumers who seek healthy and convenient meal options. By offering diverse and convenient products, manufacturers can attract a broader consumer base and drive market growth.
Low-Calorie Noodles Market Share Analysis- Largest Segment by Type
The Vegetable segment is the largest in the Low-Calorie Noodles Market by type. This dominance is driven by the high consumer demand for plant-based and nutrient-rich noodle options that offer the satisfaction of traditional noodles with reduced calorie content. Vegetable noodles, made from ingredients such as zucchini, carrots, and spinach, provide a healthier alternative to regular noodles, making them a popular choice among health-conscious consumers and those seeking to incorporate more vegetables into their diets. The continuous innovation in vegetable noodle formulations, including the use of whole vegetables and blends with other low-calorie ingredients, enhances their appeal. Additionally, the growing trend of plant-based diets supports the significant market share of the vegetable segment, as consumers seek nutritious and low-calorie alternatives to traditional pasta and noodles. The extensive availability of vegetable noodles in supermarkets, health food stores, and online platforms further boosts their accessibility to a broad consumer base. The strong consumer preference for healthy and versatile noodle options reinforces the dominant position of the vegetable segment in the market.
Low-Calorie Noodles Market Share Analysis- Fastest Growing Segment by Application
The Quinoa segment is poised to grow the fastest in the Low-Calorie Noodles Market by application over the next five years. This rapid growth is driven by the increasing consumer preference for nutrient-dense and gluten-free noodle options that offer a unique taste and texture. Quinoa noodles provide a high-protein, low-calorie alternative to traditional noodles, making them a popular choice among health-conscious consumers, athletes, and those with gluten sensitivities. The continuous innovation in quinoa noodle formulations, including blends with other superfoods and low-calorie ingredients, enhances their appeal. Additionally, the growing trend of health and wellness supports the fast growth of the quinoa segment, as consumers seek nutritious and functional food options. The expanding market for gluten-free products and the increasing focus on providing high-protein, low-calorie noodle alternatives further drive the demand for quinoa noodles. The influence of consumer preferences for innovative and healthful ingredients contributes to the rapid growth of the quinoa segment.
Low Calorie Noodles Market Segmentation
By Type
Vegetable
Chicken
Sea Food
Others
By Application
Wheat
Rice
Legumes
Buck Wheat
Oats
Quinoa
Others
Countries Analyzed
North America (US, Canada, Mexico)
Europe (Germany, UK, France, Spain, Italy, Russia, Rest of Europe)
Asia Pacific (China, India, Japan, South Korea, Australia, South East Asia, Rest of Asia)
South America (Brazil, Argentina, Rest of South America)
Middle East and Africa (Saudi Arabia, UAE, Rest of Middle East, South Africa, Egypt, Rest of Africa)
Low Calorie Noodles Companies Profiled in the Study
Beijing Shipuller Co. Ltd
Dalian Gaishi Food Co. Ltd
Genki USA Inc
He Sheng Chang Hk Ltd
Shanghai Lamowang Food Co. Ltd
Shenzhen Ator Technology Ltd
Wonder Noodles
*- List Not Exhaustive
Chapter 1. TABLE OF CONTENTS
Chapter 2. Introduction to Low Calorie Noodles Market
2.1. Market Overview
2.2. Key Statistics and Report Highlights
2.3. Scope of the Comprehensive Study
2.3.1. Market Definition
2.3.2 Countries and Regions Covered
2.3.3 Research Objective
2.3.4 Units, Currency, and Conversions
2.3.5 Industry Value Chain
2.4. Key Market Segments
2.5. Key Companies
2.6. Study Period
Chapter 3. Strategic Analysis Review
3.1. Low Calorie Noodles Pricing Analysis and Forecast
3.2. Porter’s Five Forces
3.3. Market Ecosystem
3.4. SWOT Analysis
3.5. Regulatory Scenario
3.3. Effects of Inflation, Russia-Ukraine War, moderating economic growth, and other macroeconomic factors
Chapter 4. Competitive Landscape
4.1. Market Share Analysis
4.1.1. Global Low Calorie Noodles Market Share by Company, 2023
4.1.2. Product Offerings of Leading Low Calorie Noodles Companies
4.2. Market Entropy
4.2.1. New Product Launches in the Industry
4.2.2. Mergers, Acquisitions, Joint ventures, and Partnerships
4.3. Key Strategies and Best Practices
Chapter 5. Global Market Projections: Best, Reference, and Low Case Scenarios
5.1. Growth Analysis- Case Scenario Definitions
5.2. Low Growth Case Scenario Forecasts
5.3. Reference Growth Case Scenario Forecasts
5.4. High Growth Case Scenario Forecasts
Chapter 6. Market Dynamics
6.1. Low Calorie Noodles Market Drivers
6.2. Low Calorie Noodles Market Challenges
6.6. Low Calorie Noodles Market Opportunities
6.4. Low Calorie Noodles Market Trends
Chapter 7. Global Low Calorie Noodles Market Outlook Trends
7.1. Global Low Calorie Noodles Revenue (USD Million) and CAGR (%) by Type (2021-2032)
7.2. Global Low Calorie Noodles Revenue (USD Million) and CAGR (%) by Application (2021-2032)
7.3. Global Low Calorie Noodles Revenue (USD Million) and CAGR (%) by Product (2021-2032)
By Type
Vegetable
Chicken
Sea Food
Others
By Application
Wheat
Rice
Legumes
Buck Wheat
Oats
Quinoa
Others
Chapter 8. Global Low Calorie Noodles Regional Analysis and Outlook
8.1. Global Low Calorie Noodles Revenue (USD Million) By Regions (2021- 2032)
8.2. North America Low Calorie Noodles Revenue (USD Million) by Country (2021-2032)
8.2.1. United States Low Calorie Noodles Regional Analysis and Outlook
8.2.2. Canada Low Calorie Noodles Regional Analysis and Outlook
8.2.3. Mexico Low Calorie Noodles Regional Analysis and Outlook
8.3. Europe Low Calorie Noodles Revenue (USD Million), by Country (2021-2032)
8.3.1. Germany Low Calorie Noodles Regional Analysis and Outlook
8.3.2. France Low Calorie Noodles Regional Analysis and Outlook
8.3.3. United Kingdom Low Calorie Noodles Regional Analysis and Outlook
8.3.4. Spain Low Calorie Noodles Regional Analysis and Outlook
8.3.5. Italy Low Calorie Noodles Regional Analysis and Outlook
8.3.6. Russia Low Calorie Noodles Regional Analysis and Outlook
8.3.7. Rest of Europe Low Calorie Noodles Regional Analysis and Outlook
8.4. Asia Pacific Low Calorie Noodles Revenue (USD Million) by Country (2021-2032)
8.4.1. China Low Calorie Noodles Regional Analysis and Outlook
8.4.2. Japan Low Calorie Noodles Regional Analysis and Outlook
8.4.3. India Low Calorie Noodles Regional Analysis and Outlook
8.4.4. South Korea Low Calorie Noodles Regional Analysis and Outlook
8.4.5. Australia Low Calorie Noodles Regional Analysis and Outlook
8.4.6. South East Asia Low Calorie Noodles Regional Analysis and Outlook
8.4.7. Rest of Asia Pacific Low Calorie Noodles Regional Analysis and Outlook
8.5. South America Low Calorie Noodles Revenue (USD Million), by Country (2021-2032)
8.5.1. Brazil Low Calorie Noodles Regional Analysis and Outlook
8.5.2. Argentina Low Calorie Noodles Regional Analysis and Outlook
8.5.3. Rest of South America Low Calorie Noodles Regional Analysis and Outlook
8.6. Middle East and Africa Low Calorie Noodles Revenue (USD Million) by Country (2021-2032)
8.6.1. Middle East Low Calorie Noodles Regional Analysis and Outlook
8.6.2. Africa Low Calorie Noodles Regional Analysis and Outlook
Chapter 9. North America Low Calorie Noodles Analysis and Outlook
9.1. North America Low Calorie Noodles Revenue (USD Million) by Segments (2021-2032)
9.1.1. North America Low Calorie Noodles Revenue (USD Million) by Type (2021-2032)
9.1.2. North America Low Calorie Noodles Revenue (USD Million) by Application (2021-2032)
9.1.3. North America Low Calorie Noodles Revenue (USD Million) by Product (2021-2032)
By Type
Vegetable
Chicken
Sea Food
Others
By Application
Wheat
Rice
Legumes
Buck Wheat
Oats
Quinoa
Others
Chapter 10. Europe Low Calorie Noodles Analysis and Outlook
10.1. Europe Low Calorie Noodles Revenue (USD Million), by Segments (USD Million) (2021-2032)
10.1.1. Europe Low Calorie Noodles Revenue (USD Million) by Type (2021-2032)
10.1.2. Europe Low Calorie Noodles Revenue (USD Million) by Application (2021-2032)
10.1.3. Europe Low Calorie Noodles Revenue (USD Million) by Product (2021-2032)
By Type
Vegetable
Chicken
Sea Food
Others
By Application
Wheat
Rice
Legumes
Buck Wheat
Oats
Quinoa
Others
Chapter 11. Asia Pacific Low Calorie Noodles Analysis and Outlook
11.1. Asia Pacific Low Calorie Noodles Revenue (USD Million), and Revenue (USD Million) by Segments (2021-2032)
11.1.1. Asia Pacific Low Calorie Noodles Revenue (USD Million) by Type (2021-2032)
11.1.2. Asia Pacific Low Calorie Noodles Revenue (USD Million) by Application (2021-2032)
11.1.3. Asia Pacific Low Calorie Noodles Revenue (USD Million) by Product (2021-2032)
By Type
Vegetable
Chicken
Sea Food
Others
By Application
Wheat
Rice
Legumes
Buck Wheat
Oats
Quinoa
Others
Chapter 12. South America Low Calorie Noodles Analysis and Outlook
12.1. South America Low Calorie Noodles Revenue (USD Million), by Segments (2021-2032)
12.1.1. South America Low Calorie Noodles Revenue (USD Million) by Type (2021-2032)
12.1.2. South America Low Calorie Noodles Revenue (USD Million) by Application (2021-2032)
12.1.3. South America Low Calorie Noodles Revenue (USD Million) by Product (2021-2032)
By Type
Vegetable
Chicken
Sea Food
Others
By Application
Wheat
Rice
Legumes
Buck Wheat
Oats
Quinoa
Others
Chapter 13. Middle East and Africa Low Calorie Noodles Analysis and Outlook
13.1. Middle East and Africa Low Calorie Noodles Revenue (USD Million), by Segments (2021-2032)
13.1.1. Middle East and Africa Low Calorie Noodles Revenue (USD Million) by Type (2021-2032)
13.1.2. Middle East and Africa Low Calorie Noodles Revenue (USD Million) by Application (2021-2032)
13.1.3. Middle East and Africa Low Calorie Noodles Revenue (USD Million) by Product (2021-2032)
By Type
Vegetable
Chicken
Sea Food
Others
By Application
Wheat
Rice
Legumes
Buck Wheat
Oats
Quinoa
Others
Chapter 14. Low Calorie Noodles Company Profiles
14.1 Business Overview
14.2 Product Profiles
14.3 SWOT Profiles
14.5 Recent Developments
14.6 Financial Profile
List of Companies
Beijing Shipuller Co. Ltd
Dalian Gaishi Food Co. Ltd
Genki USA Inc
He Sheng Chang Hk Ltd
Shanghai Lamowang Food Co. Ltd
Shenzhen Ator Technology Ltd
Wonder Noodles
15. Methodology and Data Sources
15.1 Customization Offerings
15.2 Subscription Services
15.3 Related Reports
15.4 Publisher Expertise
LIST OF TABLES
Table 1 Market Segmentation Analysis
Table 2 Global Low Calorie Noodles Market Share of Leading Companies, 2023
Table 3 Product Offerings of Leading Companies
Table 4 Low Growth Scenario Forecasts
Table 5 Reference Case Growth Scenario
Table 6 High Growth Case Scenario
Table 7 Global Low Calorie Noodles Revenue (USD Million) And CAGR (%) By Type (2021-2032)
Table 8 Global Low Calorie Noodles Revenue (USD Million) And CAGR (%) By Application (2021-2032)
Table 9 Global Low Calorie Noodles Revenue (USD Million) And CAGR (%) By Product (2021-2032)
Table 10 Global Low Calorie Noodles Market Revenue (USD Million) By Regions (2021-2032)
Table 11 Global Low Calorie Noodles Market Share (%) By Regions (2021-2032)
Table 12 North America Low Calorie Noodles Revenue (USD Million) By Country (2021-2032)
Table 13 Europe Low Calorie Noodles Revenue (USD Million) By Country (2021-2032)
Table 14 Asia Pacific Low Calorie Noodles Revenue (USD Million) By Country (2021-2032)
Table 15 South America Low Calorie Noodles Revenue (USD Million) By Country (2021-2032)
Table 16 Middle East and Africa Low Calorie Noodles Revenue (USD Million) By Region (2021-2032)
Table 17 North America Low Calorie Noodles Revenue (USD Million) By Type (2021-2032)
Table 18 North America Low Calorie Noodles Revenue (USD Million) By Application (2021-2032)
Table 19 North America Low Calorie Noodles Revenue (USD Million) By Product (2021-2032)
Table 20 Europe Low Calorie Noodles Revenue (USD Million) By Type (2021-2032)
Table 21 Europe Low Calorie Noodles Revenue (USD Million) By Application (2021-2032)
Table 22 Europe Low Calorie Noodles Revenue (USD Million) By Product (2021-2032)
Table 23 Asia Pacific Low Calorie Noodles Revenue (USD Million) By Type (2021-2032)
Table 24 Asia Pacific Low Calorie Noodles Revenue (USD Million) By Application (2021-2032)
Table 25 Asia Pacific Low Calorie Noodles Revenue (USD Million) By Product (2021-2032)
Table 26 South America Low Calorie Noodles Revenue (USD Million) By Type (2021-2032)
Table 27 South America Low Calorie Noodles Revenue (USD Million) By Application (2021-2032)
Table 28 South America Low Calorie Noodles Revenue (USD Million) By Product (2021-2032)
Table 29 Middle East and Africa Low Calorie Noodles Revenue (USD Million) By Type (2021-2032)
Table 30 Middle East and Africa Low Calorie Noodles Revenue (USD Million) By Application (2021-2032)
Table 31 Middle East and Africa Low Calorie Noodles Revenue (USD Million) By Product (2021-2032)
LIST OF FIGURES
Figure 1. Market Scope
Figure 2. Pricing Forecasts Per Unit, 2023- 2032
Figure 3. Porter’s Five Forces
Figure 4. Global Low Calorie Noodles Market Revenue (USD Million) By Regions (2021-2032)
Figure 5. Global Low Calorie Noodles Market Share (%) By Regions (2023)
Figure 6. North America Low Calorie Noodles Revenue (USD Million) By Country (2021-2032)
Figure 7. United States Low Calorie Noodles Revenue (USD Million) By Country (2021-2032)
Figure 8. Canada Low Calorie Noodles Revenue (USD Million) By Country (2021-2032)
Figure 9. Mexico Low Calorie Noodles Revenue (USD Million) By Country (2021-2032)
Figure 10. Europe Low Calorie Noodles Revenue (USD Million) By Country (2021-2032)
Figure 11. Germany Low Calorie Noodles Revenue (USD Million) By Country (2021-2032)
Figure 12. France Low Calorie Noodles Revenue (USD Million) By Country (2021-2032)
Figure 13. United Kingdom Low Calorie Noodles Revenue (USD Million) By Country (2021-2032)
Figure 14. Spain Low Calorie Noodles Revenue (USD Million) By Country (2021-2032)
Figure 15. Italy Low Calorie Noodles Revenue (USD Million) By Country (2021-2032)
Figure 16. Russia Low Calorie Noodles Revenue (USD Million) By Country (2021-2032)
Figure 17. Rest of Europe Low Calorie Noodles Revenue (USD Million) By Country (2021-2032)
Figure 11. Asia Pacific Low Calorie Noodles Revenue (USD Million) By Country (2021-2032)
Figure 12. China Low Calorie Noodles Revenue (USD Million) By Country (2021-2032)
Figure 13. Japan Low Calorie Noodles Revenue (USD Million) By Country (2021-2032)
Figure 14. India Low Calorie Noodles Revenue (USD Million) By Country (2021-2032)
Figure 15. South Korea Low Calorie Noodles Revenue (USD Million) By Country (2021-2032)
Figure 16. Australia Low Calorie Noodles Revenue (USD Million) By Country (2021-2032)
Figure 17. South East Asia Low Calorie Noodles Revenue (USD Million) By Country (2021-2032)
Figure 18. South America Low Calorie Noodles Revenue (USD Million) By Country (2021-2032)
Figure 19. Brazil Low Calorie Noodles Revenue (USD Million) By Country (2021-2032)
Figure 20. Argentina Low Calorie Noodles Revenue (USD Million) By Country (2021-2032)
Figure 21. Rest of Asia Pacific Low Calorie Noodles Revenue (USD Million) By Country (2021-2032)
Figure 22. Middle East and Africa Low Calorie Noodles Revenue (USD Million) By Region (2021-2032)
Figure 23. Saudi Arabia Low Calorie Noodles Revenue (USD Million) By Region (2021-2032)
Figure 24. The UAE Low Calorie Noodles Revenue (USD Million) By Region (2021-2032)
Figure 25. Rest of Middle East Low Calorie Noodles Revenue (USD Million) By Region (2021-2032)
Figure 26. South Africa Low Calorie Noodles Revenue (USD Million) By Region (2021-2032)
Figure 27. Africa Low Calorie Noodles Revenue (USD Million) By Region (2021-2032)
Figure 28. North America Low Calorie Noodles Revenue (USD Million) By Type (2021-2032)
Figure 29. North America Low Calorie Noodles Revenue (USD Million) By Application (2021-2032)
Figure 30. North America Low Calorie Noodles Revenue (USD Million) By Product (2021-2032)
Figure 31. Europe Low Calorie Noodles Revenue (USD Million) By Type (2021-2032)
Figure 32. Europe Low Calorie Noodles Revenue (USD Million) By Application (2021-2032)
Figure 33. Europe Low Calorie Noodles Revenue (USD Million) By Product (2021-2032)
Figure 34. Asia Pacific Low Calorie Noodles Revenue (USD Million) By Type (2021-2032)
Figure 35. Asia Pacific Low Calorie Noodles Revenue (USD Million) By Application (2021-2032)
Figure 36. Asia Pacific Low Calorie Noodles Revenue (USD Million) By Product (2021-2032)
Figure 37. South America Low Calorie Noodles Revenue (USD Million) By Type (2021-2032)
Figure 38. South America Low Calorie Noodles Revenue (USD Million) By Application (2021-2032)
Figure 39. South America Low Calorie Noodles Revenue (USD Million) By Product (2021-2032)
Figure 40. Middle East and Africa Low Calorie Noodles Revenue (USD Million) By Type (2021-2032)
Figure 41. Middle East and Africa Low Calorie Noodles Revenue (USD Million) By Application (2021-2032)
Figure 42. Middle East and Africa Low Calorie Noodles Revenue (USD Million) By Product (2021-2032)
By Type
Vegetable
Chicken
Sea Food
Others
By Application
Wheat
Rice
Legumes
Buck Wheat
Oats
Quinoa
Others
Countries Analyzed
North America (US, Canada, Mexico)
Europe (Germany, UK, France, Spain, Italy, Russia, Rest of Europe)
Asia Pacific (China, India, Japan, South Korea, Australia, South East Asia, Rest of Asia)
South America (Brazil, Argentina, Rest of South America)
Middle East and Africa (Saudi Arabia, UAE, Rest of Middle East, South Africa, Egypt, Rest of Africa)
