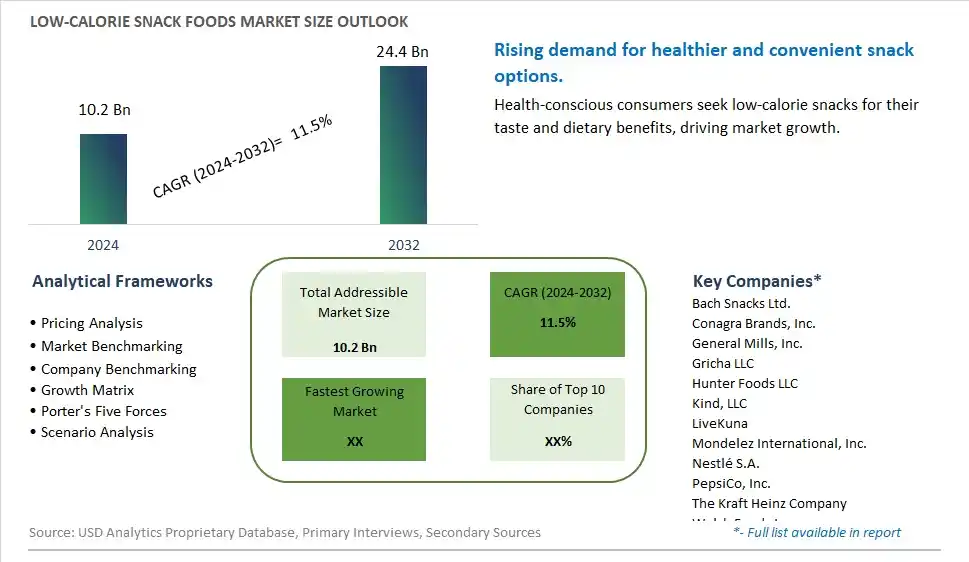
Global Low-Calorie Snack Foods Market Size is valued at $10.2 Billion in 2024 and is forecast to register a growth rate (CAGR) of 11.5% to reach $24.4 Billion by 2032.
The global Low-Calorie Snack Foods Market Comprehensive Study analyzes and forecasts the market size across 6 regions and 24 countries for diverse segments -By Product (Bars, Chips, Cookies, Crackers, Candies, Chocolates, Fruit Snacks), By Claims (Fat-free, Dairy-free, Vegan, Baked, GMO-Free, Sugar-free, Gluten-Free, High Fiber, High Protein, Halal, Others), By Packaging (Box, Can, Packet, Pouch, Tray, Cup, Others), By Distribution Channel (Hypermarkets/Supermarkets, Specialty Stores, Convenience Stores, Online Retail, Others)
An Introduction to Low-Calorie Snack Foods Market
The Low-Calorie Snack Foods Market involves the production and sale of snack foods formulated with reduced calories, catering to health-conscious consumers seeking convenient yet nutritious snack options. The market is driven by increasing health consciousness, rising prevalence of obesity and related health conditions, and growing demand for low-calorie and low-sugar foods. Additionally, advancements in snack food formulations and the expansion of product offerings support market growth.
Low Calorie Snack Foods Competitive Landscape
The market report analyses the leading companies in the industry including Bach Snacks Ltd., Conagra Brands, Inc., General Mills, Inc., Gricha LLC, Hunter Foods LLC, Kind, LLC, LiveKuna, Mondelez International, Inc., Nestlé S.A., PepsiCo, Inc., The Kraft Heinz Company, Welch Foods Inc. , and Others.
Low Calorie Snack Foods Market Dynamics
Low-Calorie Snack Foods Market Trend: Growing Demand for Better-for-You Snacks
The most prominent trend in the Low-Calorie Snack Foods Market is the growing demand for better-for-you snacks. Consumers are increasingly seeking snack options that provide satisfaction without the high calorie and sugar content. This trend is driven by the desire to balance indulgence with health and wellness goals, leading to a rise in low-calorie snack products.
Low-Calorie Snack Foods Market Driver: Health Consciousness and Changing Dietary Preferences
A key driver in the Low-Calorie Snack Foods Market is health consciousness and changing dietary preferences. As more individuals adopt healthier eating habits, there is a rising demand for snacks that align with these preferences. Low-calorie snack foods, which offer lighter and more nutritious options, cater to this demand and support market growth.
Low-Calorie Snack Foods Market Opportunity: Expansion into Diverse Snack Categories
One significant opportunity in the Low-Calorie Snack Foods Market lies in expansion into diverse snack categories. Companies can innovate by offering a wide variety of low-calorie snacks, such as chips, bars, and trail mixes, and incorporating healthy ingredients like whole grains, nuts, and fruits. By providing diverse and nutritious snack options, manufacturers can attract health-conscious consumers and drive market growth.
Low-Calorie Snack Foods Market Share Analysis- Largest Segment by Product
The Bars segment is the largest in the Low-Calorie Snack Foods Market by product. This dominance is driven by the high consumer demand for convenient and nutrient-dense snack options that offer a balance of taste and health benefits. Low-calorie snack bars, including protein bars, granola bars, and meal replacement bars, provide a satisfying and portable snack option for health-conscious consumers, athletes, and busy individuals. The continuous innovation in snack bar formulations, including the use of high-fiber, low-sugar, and plant-based ingredients, enhances their appeal. Additionally, the growing trend of on-the-go snacking supports the significant market share of the bars segment, as consumers seek convenient and nutritious snack options that fit into their busy lifestyles. The extensive availability of low-calorie snack bars in supermarkets, convenience stores, health food stores, and online platforms further boosts their accessibility to a broad consumer base. The strong consumer preference for convenient and healthy snack options reinforces the dominant position of the bars segment in the market.
Low-Calorie Snack Foods Market Share Analysis- Fastest Growing Segment by Claims
The Vegan segment is poised to grow the fastest in the Low-Calorie Snack Foods Market by claims over the next five years. This rapid growth is driven by the increasing consumer preference for plant-based and cruelty-free snack options that align with ethical and health-conscious lifestyles. Vegan low-calorie snacks, made without any animal-derived ingredients, provide a wide range of options for consumers seeking to reduce their environmental footprint and improve their health. The continuous innovation in vegan snack formulations, including the use of whole foods, superfoods, and functional ingredients, enhances their appeal. Additionally, the growing trend of plant-based diets supports the fast growth of the vegan segment, as consumers seek nutritious and ethical snack options. The expanding market for vegan products and the increasing focus on providing high-quality, plant-based snacks further drive the demand for vegan low-calorie snacks. The influence of consumer preferences for ethical, sustainable, and healthful food choices contributes to the rapid growth of the vegan segment.
Low-Calorie Snack Foods Market Share Analysis- Largest Segment by Packaging
The Packet segment is the largest in the Low-Calorie Snack Foods Market by packaging. This dominance is driven by the high consumer demand for convenient, portion-controlled, and portable snack options. Packets offer a practical solution for on-the-go snacking, making them a popular choice among busy consumers, including office workers, students, and travelers. The continuous innovation in packet designs, including resealable features and eco-friendly materials, enhances their appeal. Additionally, packets provide an ideal portion size for low-calorie snacks, helping consumers manage their calorie intake while enjoying their favorite treats. The extensive availability of low-calorie snack foods in packet form in supermarkets, convenience stores, and online platforms further boosts their accessibility to a broad consumer base. The strong consumer preference for practical and convenient packaging reinforces the dominant position of the packet segment in the market.
Low-Calorie Snack Foods Market Share Analysis- Fastest Growing Segment by Distribution Channel
The Online Retail segment is poised to grow the fastest in the Low-Calorie Snack Foods Market by distribution channel over the next five years. This rapid growth is driven by the increasing consumer preference for the convenience and accessibility of online shopping. E-commerce platforms provide a wide variety of low-calorie snack food products, including niche and specialty items that may not be readily available in physical stores. The convenience of browsing and purchasing from home, coupled with the option of home delivery, appeals to a broad range of consumers. The COVID-19 pandemic has further accelerated the adoption of online shopping, and this trend continues as consumers appreciate the safety and convenience of having products delivered to their doorstep. Additionally, online retailers often offer competitive pricing, detailed product information, and customer reviews, which further drive consumer confidence and sales. The growth of digital marketing and targeted online advertisements also boosts the visibility and sales of low-calorie snack food products through e-commerce channels.
Low Calorie Snack Foods Market Segmentation
By Product
Bars
Chips
Cookies
Crackers
Candies
Chocolates
Fruit Snacks
By Claims
Fat-free
Dairy-free
Vegan
Baked
GMO-Free
Sugar-free
Gluten-Free
High Fiber
High Protein
Halal
Others
By Packaging
Box
Can
Packet
Pouch
Tray
Cup
Others
By Distribution Channel
Hypermarkets/Supermarkets
Specialty Stores
Convenience Stores
Online Retail
Others
Countries Analyzed
North America (US, Canada, Mexico)
Europe (Germany, UK, France, Spain, Italy, Russia, Rest of Europe)
Asia Pacific (China, India, Japan, South Korea, Australia, South East Asia, Rest of Asia)
South America (Brazil, Argentina, Rest of South America)
Middle East and Africa (Saudi Arabia, UAE, Rest of Middle East, South Africa, Egypt, Rest of Africa)
Low Calorie Snack Foods Companies Profiled in the Study
Bach Snacks Ltd.
Conagra Brands, Inc.
General Mills, Inc.
Gricha LLC
Hunter Foods LLC
Kind, LLC
LiveKuna
Mondelez International, Inc.
Nestlé S.A.
PepsiCo, Inc.
The Kraft Heinz Company
Welch Foods Inc.
*- List Not Exhaustive
Chapter 1. TABLE OF CONTENTS
Chapter 2. Introduction to Low Calorie Snack Foods Market
2.1. Market Overview
2.2. Key Statistics and Report Highlights
2.3. Scope of the Comprehensive Study
2.3.1. Market Definition
2.3.2 Countries and Regions Covered
2.3.3 Research Objective
2.3.4 Units, Currency, and Conversions
2.3.5 Industry Value Chain
2.4. Key Market Segments
2.5. Key Companies
2.6. Study Period
Chapter 3. Strategic Analysis Review
3.1. Low Calorie Snack Foods Pricing Analysis and Forecast
3.2. Porter’s Five Forces
3.3. Market Ecosystem
3.4. SWOT Analysis
3.5. Regulatory Scenario
3.3. Effects of Inflation, Russia-Ukraine War, moderating economic growth, and other macroeconomic factors
Chapter 4. Competitive Landscape
4.1. Market Share Analysis
4.1.1. Global Low Calorie Snack Foods Market Share by Company, 2023
4.1.2. Product Offerings of Leading Low Calorie Snack Foods Companies
4.2. Market Entropy
4.2.1. New Product Launches in the Industry
4.2.2. Mergers, Acquisitions, Joint ventures, and Partnerships
4.3. Key Strategies and Best Practices
Chapter 5. Global Market Projections: Best, Reference, and Low Case Scenarios
5.1. Growth Analysis- Case Scenario Definitions
5.2. Low Growth Case Scenario Forecasts
5.3. Reference Growth Case Scenario Forecasts
5.4. High Growth Case Scenario Forecasts
Chapter 6. Market Dynamics
6.1. Low Calorie Snack Foods Market Drivers
6.2. Low Calorie Snack Foods Market Challenges
6.6. Low Calorie Snack Foods Market Opportunities
6.4. Low Calorie Snack Foods Market Trends
Chapter 7. Global Low Calorie Snack Foods Market Outlook Trends
7.1. Global Low Calorie Snack Foods Revenue (USD Million) and CAGR (%) by Type (2021-2032)
7.2. Global Low Calorie Snack Foods Revenue (USD Million) and CAGR (%) by Application (2021-2032)
7.3. Global Low Calorie Snack Foods Revenue (USD Million) and CAGR (%) by Product (2021-2032)
By Product
Bars
Chips
Cookies
Crackers
Candies
Chocolates
Fruit Snacks
By Claims
Fat-free
Dairy-free
Vegan
Baked
GMO-Free
Sugar-free
Gluten-Free
High Fiber
High Protein
Halal
Others
By Packaging
Box
Can
Packet
Pouch
Tray
Cup
Others
By Distribution Channel
Hypermarkets/Supermarkets
Specialty Stores
Convenience Stores
Online Retail
Others
Chapter 8. Global Low Calorie Snack Foods Regional Analysis and Outlook
8.1. Global Low Calorie Snack Foods Revenue (USD Million) By Regions (2021- 2032)
8.2. North America Low Calorie Snack Foods Revenue (USD Million) by Country (2021-2032)
8.2.1. United States Low Calorie Snack Foods Regional Analysis and Outlook
8.2.2. Canada Low Calorie Snack Foods Regional Analysis and Outlook
8.2.3. Mexico Low Calorie Snack Foods Regional Analysis and Outlook
8.3. Europe Low Calorie Snack Foods Revenue (USD Million), by Country (2021-2032)
8.3.1. Germany Low Calorie Snack Foods Regional Analysis and Outlook
8.3.2. France Low Calorie Snack Foods Regional Analysis and Outlook
8.3.3. United Kingdom Low Calorie Snack Foods Regional Analysis and Outlook
8.3.4. Spain Low Calorie Snack Foods Regional Analysis and Outlook
8.3.5. Italy Low Calorie Snack Foods Regional Analysis and Outlook
8.3.6. Russia Low Calorie Snack Foods Regional Analysis and Outlook
8.3.7. Rest of Europe Low Calorie Snack Foods Regional Analysis and Outlook
8.4. Asia Pacific Low Calorie Snack Foods Revenue (USD Million) by Country (2021-2032)
8.4.1. China Low Calorie Snack Foods Regional Analysis and Outlook
8.4.2. Japan Low Calorie Snack Foods Regional Analysis and Outlook
8.4.3. India Low Calorie Snack Foods Regional Analysis and Outlook
8.4.4. South Korea Low Calorie Snack Foods Regional Analysis and Outlook
8.4.5. Australia Low Calorie Snack Foods Regional Analysis and Outlook
8.4.6. South East Asia Low Calorie Snack Foods Regional Analysis and Outlook
8.4.7. Rest of Asia Pacific Low Calorie Snack Foods Regional Analysis and Outlook
8.5. South America Low Calorie Snack Foods Revenue (USD Million), by Country (2021-2032)
8.5.1. Brazil Low Calorie Snack Foods Regional Analysis and Outlook
8.5.2. Argentina Low Calorie Snack Foods Regional Analysis and Outlook
8.5.3. Rest of South America Low Calorie Snack Foods Regional Analysis and Outlook
8.6. Middle East and Africa Low Calorie Snack Foods Revenue (USD Million) by Country (2021-2032)
8.6.1. Middle East Low Calorie Snack Foods Regional Analysis and Outlook
8.6.2. Africa Low Calorie Snack Foods Regional Analysis and Outlook
Chapter 9. North America Low Calorie Snack Foods Analysis and Outlook
9.1. North America Low Calorie Snack Foods Revenue (USD Million) by Segments (2021-2032)
9.1.1. North America Low Calorie Snack Foods Revenue (USD Million) by Type (2021-2032)
9.1.2. North America Low Calorie Snack Foods Revenue (USD Million) by Application (2021-2032)
9.1.3. North America Low Calorie Snack Foods Revenue (USD Million) by Product (2021-2032)
By Product
Bars
Chips
Cookies
Crackers
Candies
Chocolates
Fruit Snacks
By Claims
Fat-free
Dairy-free
Vegan
Baked
GMO-Free
Sugar-free
Gluten-Free
High Fiber
High Protein
Halal
Others
By Packaging
Box
Can
Packet
Pouch
Tray
Cup
Others
By Distribution Channel
Hypermarkets/Supermarkets
Specialty Stores
Convenience Stores
Online Retail
Others
Chapter 10. Europe Low Calorie Snack Foods Analysis and Outlook
10.1. Europe Low Calorie Snack Foods Revenue (USD Million), by Segments (USD Million) (2021-2032)
10.1.1. Europe Low Calorie Snack Foods Revenue (USD Million) by Type (2021-2032)
10.1.2. Europe Low Calorie Snack Foods Revenue (USD Million) by Application (2021-2032)
10.1.3. Europe Low Calorie Snack Foods Revenue (USD Million) by Product (2021-2032)
By Product
Bars
Chips
Cookies
Crackers
Candies
Chocolates
Fruit Snacks
By Claims
Fat-free
Dairy-free
Vegan
Baked
GMO-Free
Sugar-free
Gluten-Free
High Fiber
High Protein
Halal
Others
By Packaging
Box
Can
Packet
Pouch
Tray
Cup
Others
By Distribution Channel
Hypermarkets/Supermarkets
Specialty Stores
Convenience Stores
Online Retail
Others
Chapter 11. Asia Pacific Low Calorie Snack Foods Analysis and Outlook
11.1. Asia Pacific Low Calorie Snack Foods Revenue (USD Million), and Revenue (USD Million) by Segments (2021-2032)
11.1.1. Asia Pacific Low Calorie Snack Foods Revenue (USD Million) by Type (2021-2032)
11.1.2. Asia Pacific Low Calorie Snack Foods Revenue (USD Million) by Application (2021-2032)
11.1.3. Asia Pacific Low Calorie Snack Foods Revenue (USD Million) by Product (2021-2032)
By Product
Bars
Chips
Cookies
Crackers
Candies
Chocolates
Fruit Snacks
By Claims
Fat-free
Dairy-free
Vegan
Baked
GMO-Free
Sugar-free
Gluten-Free
High Fiber
High Protein
Halal
Others
By Packaging
Box
Can
Packet
Pouch
Tray
Cup
Others
By Distribution Channel
Hypermarkets/Supermarkets
Specialty Stores
Convenience Stores
Online Retail
Others
Chapter 12. South America Low Calorie Snack Foods Analysis and Outlook
12.1. South America Low Calorie Snack Foods Revenue (USD Million), by Segments (2021-2032)
12.1.1. South America Low Calorie Snack Foods Revenue (USD Million) by Type (2021-2032)
12.1.2. South America Low Calorie Snack Foods Revenue (USD Million) by Application (2021-2032)
12.1.3. South America Low Calorie Snack Foods Revenue (USD Million) by Product (2021-2032)
By Product
Bars
Chips
Cookies
Crackers
Candies
Chocolates
Fruit Snacks
By Claims
Fat-free
Dairy-free
Vegan
Baked
GMO-Free
Sugar-free
Gluten-Free
High Fiber
High Protein
Halal
Others
By Packaging
Box
Can
Packet
Pouch
Tray
Cup
Others
By Distribution Channel
Hypermarkets/Supermarkets
Specialty Stores
Convenience Stores
Online Retail
Others
Chapter 13. Middle East and Africa Low Calorie Snack Foods Analysis and Outlook
13.1. Middle East and Africa Low Calorie Snack Foods Revenue (USD Million), by Segments (2021-2032)
13.1.1. Middle East and Africa Low Calorie Snack Foods Revenue (USD Million) by Type (2021-2032)
13.1.2. Middle East and Africa Low Calorie Snack Foods Revenue (USD Million) by Application (2021-2032)
13.1.3. Middle East and Africa Low Calorie Snack Foods Revenue (USD Million) by Product (2021-2032)
By Product
Bars
Chips
Cookies
Crackers
Candies
Chocolates
Fruit Snacks
By Claims
Fat-free
Dairy-free
Vegan
Baked
GMO-Free
Sugar-free
Gluten-Free
High Fiber
High Protein
Halal
Others
By Packaging
Box
Can
Packet
Pouch
Tray
Cup
Others
By Distribution Channel
Hypermarkets/Supermarkets
Specialty Stores
Convenience Stores
Online Retail
Others
Chapter 14. Low Calorie Snack Foods Company Profiles
14.1 Business Overview
14.2 Product Profiles
14.3 SWOT Profiles
14.5 Recent Developments
14.6 Financial Profile
List of Companies
Bach Snacks Ltd.
Conagra Brands, Inc.
General Mills, Inc.
Gricha LLC
Hunter Foods LLC
Kind, LLC
LiveKuna
Mondelez International, Inc.
Nestlé S.A.
PepsiCo, Inc.
The Kraft Heinz Company
Welch Foods Inc.
15. Methodology and Data Sources
15.1 Customization Offerings
15.2 Subscription Services
15.3 Related Reports
15.4 Publisher Expertise
LIST OF TABLES
Table 1 Market Segmentation Analysis
Table 2 Global Low Calorie Snack Foods Market Share of Leading Companies, 2023
Table 3 Product Offerings of Leading Companies
Table 4 Low Growth Scenario Forecasts
Table 5 Reference Case Growth Scenario
Table 6 High Growth Case Scenario
Table 7 Global Low Calorie Snack Foods Revenue (USD Million) And CAGR (%) By Type (2021-2032)
Table 8 Global Low Calorie Snack Foods Revenue (USD Million) And CAGR (%) By Application (2021-2032)
Table 9 Global Low Calorie Snack Foods Revenue (USD Million) And CAGR (%) By Product (2021-2032)
Table 10 Global Low Calorie Snack Foods Market Revenue (USD Million) By Regions (2021-2032)
Table 11 Global Low Calorie Snack Foods Market Share (%) By Regions (2021-2032)
Table 12 North America Low Calorie Snack Foods Revenue (USD Million) By Country (2021-2032)
Table 13 Europe Low Calorie Snack Foods Revenue (USD Million) By Country (2021-2032)
Table 14 Asia Pacific Low Calorie Snack Foods Revenue (USD Million) By Country (2021-2032)
Table 15 South America Low Calorie Snack Foods Revenue (USD Million) By Country (2021-2032)
Table 16 Middle East and Africa Low Calorie Snack Foods Revenue (USD Million) By Region (2021-2032)
Table 17 North America Low Calorie Snack Foods Revenue (USD Million) By Type (2021-2032)
Table 18 North America Low Calorie Snack Foods Revenue (USD Million) By Application (2021-2032)
Table 19 North America Low Calorie Snack Foods Revenue (USD Million) By Product (2021-2032)
Table 20 Europe Low Calorie Snack Foods Revenue (USD Million) By Type (2021-2032)
Table 21 Europe Low Calorie Snack Foods Revenue (USD Million) By Application (2021-2032)
Table 22 Europe Low Calorie Snack Foods Revenue (USD Million) By Product (2021-2032)
Table 23 Asia Pacific Low Calorie Snack Foods Revenue (USD Million) By Type (2021-2032)
Table 24 Asia Pacific Low Calorie Snack Foods Revenue (USD Million) By Application (2021-2032)
Table 25 Asia Pacific Low Calorie Snack Foods Revenue (USD Million) By Product (2021-2032)
Table 26 South America Low Calorie Snack Foods Revenue (USD Million) By Type (2021-2032)
Table 27 South America Low Calorie Snack Foods Revenue (USD Million) By Application (2021-2032)
Table 28 South America Low Calorie Snack Foods Revenue (USD Million) By Product (2021-2032)
Table 29 Middle East and Africa Low Calorie Snack Foods Revenue (USD Million) By Type (2021-2032)
Table 30 Middle East and Africa Low Calorie Snack Foods Revenue (USD Million) By Application (2021-2032)
Table 31 Middle East and Africa Low Calorie Snack Foods Revenue (USD Million) By Product (2021-2032)
LIST OF FIGURES
Figure 1. Market Scope
Figure 2. Pricing Forecasts Per Unit, 2023- 2032
Figure 3. Porter’s Five Forces
Figure 4. Global Low Calorie Snack Foods Market Revenue (USD Million) By Regions (2021-2032)
Figure 5. Global Low Calorie Snack Foods Market Share (%) By Regions (2023)
Figure 6. North America Low Calorie Snack Foods Revenue (USD Million) By Country (2021-2032)
Figure 7. United States Low Calorie Snack Foods Revenue (USD Million) By Country (2021-2032)
Figure 8. Canada Low Calorie Snack Foods Revenue (USD Million) By Country (2021-2032)
Figure 9. Mexico Low Calorie Snack Foods Revenue (USD Million) By Country (2021-2032)
Figure 10. Europe Low Calorie Snack Foods Revenue (USD Million) By Country (2021-2032)
Figure 11. Germany Low Calorie Snack Foods Revenue (USD Million) By Country (2021-2032)
Figure 12. France Low Calorie Snack Foods Revenue (USD Million) By Country (2021-2032)
Figure 13. United Kingdom Low Calorie Snack Foods Revenue (USD Million) By Country (2021-2032)
Figure 14. Spain Low Calorie Snack Foods Revenue (USD Million) By Country (2021-2032)
Figure 15. Italy Low Calorie Snack Foods Revenue (USD Million) By Country (2021-2032)
Figure 16. Russia Low Calorie Snack Foods Revenue (USD Million) By Country (2021-2032)
Figure 17. Rest of Europe Low Calorie Snack Foods Revenue (USD Million) By Country (2021-2032)
Figure 11. Asia Pacific Low Calorie Snack Foods Revenue (USD Million) By Country (2021-2032)
Figure 12. China Low Calorie Snack Foods Revenue (USD Million) By Country (2021-2032)
Figure 13. Japan Low Calorie Snack Foods Revenue (USD Million) By Country (2021-2032)
Figure 14. India Low Calorie Snack Foods Revenue (USD Million) By Country (2021-2032)
Figure 15. South Korea Low Calorie Snack Foods Revenue (USD Million) By Country (2021-2032)
Figure 16. Australia Low Calorie Snack Foods Revenue (USD Million) By Country (2021-2032)
Figure 17. South East Asia Low Calorie Snack Foods Revenue (USD Million) By Country (2021-2032)
Figure 18. South America Low Calorie Snack Foods Revenue (USD Million) By Country (2021-2032)
Figure 19. Brazil Low Calorie Snack Foods Revenue (USD Million) By Country (2021-2032)
Figure 20. Argentina Low Calorie Snack Foods Revenue (USD Million) By Country (2021-2032)
Figure 21. Rest of Asia Pacific Low Calorie Snack Foods Revenue (USD Million) By Country (2021-2032)
Figure 22. Middle East and Africa Low Calorie Snack Foods Revenue (USD Million) By Region (2021-2032)
Figure 23. Saudi Arabia Low Calorie Snack Foods Revenue (USD Million) By Region (2021-2032)
Figure 24. The UAE Low Calorie Snack Foods Revenue (USD Million) By Region (2021-2032)
Figure 25. Rest of Middle East Low Calorie Snack Foods Revenue (USD Million) By Region (2021-2032)
Figure 26. South Africa Low Calorie Snack Foods Revenue (USD Million) By Region (2021-2032)
Figure 27. Africa Low Calorie Snack Foods Revenue (USD Million) By Region (2021-2032)
Figure 28. North America Low Calorie Snack Foods Revenue (USD Million) By Type (2021-2032)
Figure 29. North America Low Calorie Snack Foods Revenue (USD Million) By Application (2021-2032)
Figure 30. North America Low Calorie Snack Foods Revenue (USD Million) By Product (2021-2032)
Figure 31. Europe Low Calorie Snack Foods Revenue (USD Million) By Type (2021-2032)
Figure 32. Europe Low Calorie Snack Foods Revenue (USD Million) By Application (2021-2032)
Figure 33. Europe Low Calorie Snack Foods Revenue (USD Million) By Product (2021-2032)
Figure 34. Asia Pacific Low Calorie Snack Foods Revenue (USD Million) By Type (2021-2032)
Figure 35. Asia Pacific Low Calorie Snack Foods Revenue (USD Million) By Application (2021-2032)
Figure 36. Asia Pacific Low Calorie Snack Foods Revenue (USD Million) By Product (2021-2032)
Figure 37. South America Low Calorie Snack Foods Revenue (USD Million) By Type (2021-2032)
Figure 38. South America Low Calorie Snack Foods Revenue (USD Million) By Application (2021-2032)
Figure 39. South America Low Calorie Snack Foods Revenue (USD Million) By Product (2021-2032)
Figure 40. Middle East and Africa Low Calorie Snack Foods Revenue (USD Million) By Type (2021-2032)
Figure 41. Middle East and Africa Low Calorie Snack Foods Revenue (USD Million) By Application (2021-2032)
Figure 42. Middle East and Africa Low Calorie Snack Foods Revenue (USD Million) By Product (2021-2032)
By Product
Bars
Chips
Cookies
Crackers
Candies
Chocolates
Fruit Snacks
By Claims
Fat-free
Dairy-free
Vegan
Baked
GMO-Free
Sugar-free
Gluten-Free
High Fiber
High Protein
Halal
Others
By Packaging
Box
Can
Packet
Pouch
Tray
Cup
Others
By Distribution Channel
Hypermarkets/Supermarkets
Specialty Stores
Convenience Stores
Online Retail
Others
Countries Analyzed
North America (US, Canada, Mexico)
Europe (Germany, UK, France, Spain, Italy, Russia, Rest of Europe)
Asia Pacific (China, India, Japan, South Korea, Australia, South East Asia, Rest of Asia)
South America (Brazil, Argentina, Rest of South America)
Middle East and Africa (Saudi Arabia, UAE, Rest of Middle East, South Africa, Egypt, Rest of Africa)
