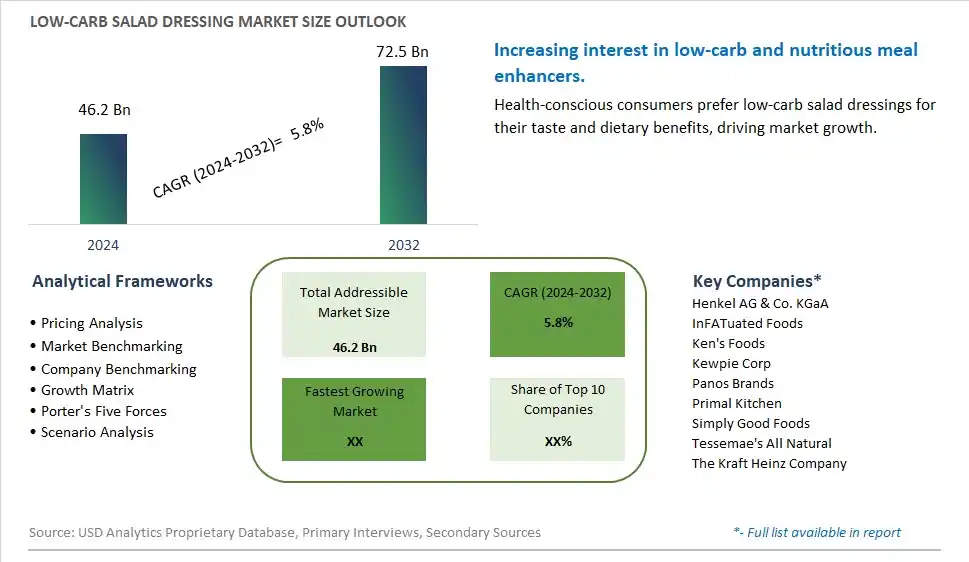
Global Low-carb Salad Dressing Market Size is valued at $46.2 Billion in 2024 and is forecast to register a growth rate (CAGR) of 5.8% to reach $72.5 Billion by 2032.
The global Low-carb Salad Dressing Market Comprehensive Study analyzes and forecasts the market size across 6 regions and 24 countries for diverse segments -By Type (Less Than 1gm per Serving, Equal to 1gm per Serving), By Application (Online Shopping, Retailer, Supermarket, Others)
An Introduction to Low-carb Salad Dressing Market
The Low-Carb Salad Dressing Market focuses on the production and sale of salad dressings formulated with reduced carbohydrates, catering to consumers seeking low-carb and keto-friendly options. The market is driven by increasing health consciousness, rising popularity of low-carb and ketogenic diets, and growing demand for healthy and nutritious salad dressings. Additionally, advancements in dressing formulations and the expansion of product offerings support market growth.
Low carb Salad Dressing Competitive Landscape
The market report analyses the leading companies in the industry including Henkel AG & Co. KGaA, InFATuated Foods, Ken's Foods, Kewpie Corp, Panos Brands, Primal Kitchen, Simply Good Foods, Tessemae's All Natural, The Kraft Heinz Company, and Others.
Low carb Salad Dressing Market Dynamics
Low-carb Salad Dressing Market Trend: Increasing Demand for Low-Carb and Keto-Friendly Products
The most prominent trend in the Low-carb Salad Dressing Market is the increasing demand for low-carb and keto-friendly products. Consumers following low-carb diets are seeking salad dressings that align with their dietary goals, offering rich flavors without added sugars and carbohydrates. This trend is driven by the growing popularity of low-carb and ketogenic diets.
Low-carb Salad Dressing Market Driver: Health Consciousness and Focus on Weight Management
A key driver in the Low-carb Salad Dressing Market is health consciousness and a focus on weight management. As more individuals aim to reduce their carbohydrate intake and manage their weight, there is a rising demand for salad dressings that support these dietary needs. Low-carb dressings, which provide flavorful and healthy options, cater to this demand and support market growth.
Low-carb Salad Dressing Market Opportunity: Innovation in Flavors and Clean Label Ingredients
One significant opportunity in the Low-carb Salad Dressing Market lies in innovation in flavors and clean label ingredients. Companies can develop new low-carb salad dressing recipes using natural sweeteners, high-quality oils, and herbs and spices to create diverse and appealing flavor profiles. By offering clean label and health-conscious products, manufacturers can attract a broader consumer base and drive market growth.
Low-carb Salad Dressing Market Share Analysis- Largest Segment by Type
The Equal to 1gm per Serving segment is the largest in the Low-carb Salad Dressing Market by type. This dominance is driven by the consumer preference for products that provide a balance between low carbohydrate content and flavor. Salad dressings with exactly 1gm of carbs per serving often offer a richer taste and better texture compared to those with less than 1gm, making them more appealing to a broader audience. The continuous innovation in flavor profiles and ingredients to maintain taste while adhering to low-carb requirements enhances the appeal of this segment. Additionally, the significant market presence and extensive availability of these products in supermarkets, specialty stores, and online platforms contribute to their dominant position. The strong consumer preference for maintaining a low-carb diet without compromising on taste reinforces the leading position of the Equal to 1gm per Serving segment in the market.
Low-carb Salad Dressing Market Share Analysis- Fastest Growing Segment by Application
The Online Shopping segment is poised to grow the fastest in the Low-carb Salad Dressing Market by application over the next five years. This rapid growth is driven by the increasing consumer preference for the convenience and accessibility of online shopping. E-commerce platforms provide a wide variety of low-carb salad dressing products, including niche and specialty items that may not be readily available in physical stores. The convenience of browsing and purchasing from home, coupled with the option of home delivery, appeals to a broad range of consumers. The COVID-19 pandemic has further accelerated the adoption of online shopping, and this trend continues as consumers appreciate the safety and convenience of having products delivered to their doorstep. Additionally, online retailers often offer competitive pricing, detailed product information, and customer reviews, which further drive consumer confidence and sales. The growth of digital marketing and targeted online advertisements also boosts the visibility and sales of low-carb salad dressing products through e-commerce channels.
Low carb Salad Dressing Market Segmentation
By Type
Less Than 1gm per Serving
Equal to 1gm per Serving
By Application
Online Shopping
Retailer
Supermarket
Others
Countries Analyzed
North America (US, Canada, Mexico)
Europe (Germany, UK, France, Spain, Italy, Russia, Rest of Europe)
Asia Pacific (China, India, Japan, South Korea, Australia, South East Asia, Rest of Asia)
South America (Brazil, Argentina, Rest of South America)
Middle East and Africa (Saudi Arabia, UAE, Rest of Middle East, South Africa, Egypt, Rest of Africa)
Low carb Salad Dressing Companies Profiled in the Study
Henkel AG & Co. KGaA
InFATuated Foods
Ken's Foods
Kewpie Corp
Panos Brands
Primal Kitchen
Simply Good Foods
Tessemae's All Natural
The Kraft Heinz Company
*- List Not Exhaustive
Chapter 1. TABLE OF CONTENTS
Chapter 2. Introduction to Low carb Salad Dressing Market
2.1. Market Overview
2.2. Key Statistics and Report Highlights
2.3. Scope of the Comprehensive Study
2.3.1. Market Definition
2.3.2 Countries and Regions Covered
2.3.3 Research Objective
2.3.4 Units, Currency, and Conversions
2.3.5 Industry Value Chain
2.4. Key Market Segments
2.5. Key Companies
2.6. Study Period
Chapter 3. Strategic Analysis Review
3.1. Low carb Salad Dressing Pricing Analysis and Forecast
3.2. Porter’s Five Forces
3.3. Market Ecosystem
3.4. SWOT Analysis
3.5. Regulatory Scenario
3.3. Effects of Inflation, Russia-Ukraine War, moderating economic growth, and other macroeconomic factors
Chapter 4. Competitive Landscape
4.1. Market Share Analysis
4.1.1. Global Low carb Salad Dressing Market Share by Company, 2023
4.1.2. Product Offerings of Leading Low carb Salad Dressing Companies
4.2. Market Entropy
4.2.1. New Product Launches in the Industry
4.2.2. Mergers, Acquisitions, Joint ventures, and Partnerships
4.3. Key Strategies and Best Practices
Chapter 5. Global Market Projections: Best, Reference, and Low Case Scenarios
5.1. Growth Analysis- Case Scenario Definitions
5.2. Low Growth Case Scenario Forecasts
5.3. Reference Growth Case Scenario Forecasts
5.4. High Growth Case Scenario Forecasts
Chapter 6. Market Dynamics
6.1. Low carb Salad Dressing Market Drivers
6.2. Low carb Salad Dressing Market Challenges
6.6. Low carb Salad Dressing Market Opportunities
6.4. Low carb Salad Dressing Market Trends
Chapter 7. Global Low carb Salad Dressing Market Outlook Trends
7.1. Global Low carb Salad Dressing Revenue (USD Million) and CAGR (%) by Type (2021-2032)
7.2. Global Low carb Salad Dressing Revenue (USD Million) and CAGR (%) by Application (2021-2032)
7.3. Global Low carb Salad Dressing Revenue (USD Million) and CAGR (%) by Product (2021-2032)
By Type
Less Than 1gm per Serving
Equal to 1gm per Serving
By Application
Online Shopping
Retailer
Supermarket
Others
Chapter 8. Global Low carb Salad Dressing Regional Analysis and Outlook
8.1. Global Low carb Salad Dressing Revenue (USD Million) By Regions (2021- 2032)
8.2. North America Low carb Salad Dressing Revenue (USD Million) by Country (2021-2032)
8.2.1. United States Low carb Salad Dressing Regional Analysis and Outlook
8.2.2. Canada Low carb Salad Dressing Regional Analysis and Outlook
8.2.3. Mexico Low carb Salad Dressing Regional Analysis and Outlook
8.3. Europe Low carb Salad Dressing Revenue (USD Million), by Country (2021-2032)
8.3.1. Germany Low carb Salad Dressing Regional Analysis and Outlook
8.3.2. France Low carb Salad Dressing Regional Analysis and Outlook
8.3.3. United Kingdom Low carb Salad Dressing Regional Analysis and Outlook
8.3.4. Spain Low carb Salad Dressing Regional Analysis and Outlook
8.3.5. Italy Low carb Salad Dressing Regional Analysis and Outlook
8.3.6. Russia Low carb Salad Dressing Regional Analysis and Outlook
8.3.7. Rest of Europe Low carb Salad Dressing Regional Analysis and Outlook
8.4. Asia Pacific Low carb Salad Dressing Revenue (USD Million) by Country (2021-2032)
8.4.1. China Low carb Salad Dressing Regional Analysis and Outlook
8.4.2. Japan Low carb Salad Dressing Regional Analysis and Outlook
8.4.3. India Low carb Salad Dressing Regional Analysis and Outlook
8.4.4. South Korea Low carb Salad Dressing Regional Analysis and Outlook
8.4.5. Australia Low carb Salad Dressing Regional Analysis and Outlook
8.4.6. South East Asia Low carb Salad Dressing Regional Analysis and Outlook
8.4.7. Rest of Asia Pacific Low carb Salad Dressing Regional Analysis and Outlook
8.5. South America Low carb Salad Dressing Revenue (USD Million), by Country (2021-2032)
8.5.1. Brazil Low carb Salad Dressing Regional Analysis and Outlook
8.5.2. Argentina Low carb Salad Dressing Regional Analysis and Outlook
8.5.3. Rest of South America Low carb Salad Dressing Regional Analysis and Outlook
8.6. Middle East and Africa Low carb Salad Dressing Revenue (USD Million) by Country (2021-2032)
8.6.1. Middle East Low carb Salad Dressing Regional Analysis and Outlook
8.6.2. Africa Low carb Salad Dressing Regional Analysis and Outlook
Chapter 9. North America Low carb Salad Dressing Analysis and Outlook
9.1. North America Low carb Salad Dressing Revenue (USD Million) by Segments (2021-2032)
9.1.1. North America Low carb Salad Dressing Revenue (USD Million) by Type (2021-2032)
9.1.2. North America Low carb Salad Dressing Revenue (USD Million) by Application (2021-2032)
9.1.3. North America Low carb Salad Dressing Revenue (USD Million) by Product (2021-2032)
By Type
Less Than 1gm per Serving
Equal to 1gm per Serving
By Application
Online Shopping
Retailer
Supermarket
Others
Chapter 10. Europe Low carb Salad Dressing Analysis and Outlook
10.1. Europe Low carb Salad Dressing Revenue (USD Million), by Segments (USD Million) (2021-2032)
10.1.1. Europe Low carb Salad Dressing Revenue (USD Million) by Type (2021-2032)
10.1.2. Europe Low carb Salad Dressing Revenue (USD Million) by Application (2021-2032)
10.1.3. Europe Low carb Salad Dressing Revenue (USD Million) by Product (2021-2032)
By Type
Less Than 1gm per Serving
Equal to 1gm per Serving
By Application
Online Shopping
Retailer
Supermarket
Others
Chapter 11. Asia Pacific Low carb Salad Dressing Analysis and Outlook
11.1. Asia Pacific Low carb Salad Dressing Revenue (USD Million), and Revenue (USD Million) by Segments (2021-2032)
11.1.1. Asia Pacific Low carb Salad Dressing Revenue (USD Million) by Type (2021-2032)
11.1.2. Asia Pacific Low carb Salad Dressing Revenue (USD Million) by Application (2021-2032)
11.1.3. Asia Pacific Low carb Salad Dressing Revenue (USD Million) by Product (2021-2032)
By Type
Less Than 1gm per Serving
Equal to 1gm per Serving
By Application
Online Shopping
Retailer
Supermarket
Others
Chapter 12. South America Low carb Salad Dressing Analysis and Outlook
12.1. South America Low carb Salad Dressing Revenue (USD Million), by Segments (2021-2032)
12.1.1. South America Low carb Salad Dressing Revenue (USD Million) by Type (2021-2032)
12.1.2. South America Low carb Salad Dressing Revenue (USD Million) by Application (2021-2032)
12.1.3. South America Low carb Salad Dressing Revenue (USD Million) by Product (2021-2032)
By Type
Less Than 1gm per Serving
Equal to 1gm per Serving
By Application
Online Shopping
Retailer
Supermarket
Others
Chapter 13. Middle East and Africa Low carb Salad Dressing Analysis and Outlook
13.1. Middle East and Africa Low carb Salad Dressing Revenue (USD Million), by Segments (2021-2032)
13.1.1. Middle East and Africa Low carb Salad Dressing Revenue (USD Million) by Type (2021-2032)
13.1.2. Middle East and Africa Low carb Salad Dressing Revenue (USD Million) by Application (2021-2032)
13.1.3. Middle East and Africa Low carb Salad Dressing Revenue (USD Million) by Product (2021-2032)
By Type
Less Than 1gm per Serving
Equal to 1gm per Serving
By Application
Online Shopping
Retailer
Supermarket
Others
Chapter 14. Low carb Salad Dressing Company Profiles
14.1 Business Overview
14.2 Product Profiles
14.3 SWOT Profiles
14.5 Recent Developments
14.6 Financial Profile
List of Companies
Henkel AG & Co. KGaA
InFATuated Foods
Ken's Foods
Kewpie Corp
Panos Brands
Primal Kitchen
Simply Good Foods
Tessemae's All Natural
The Kraft Heinz Company
15. Methodology and Data Sources
15.1 Customization Offerings
15.2 Subscription Services
15.3 Related Reports
15.4 Publisher Expertise
LIST OF TABLES
Table 1 Market Segmentation Analysis
Table 2 Global Low carb Salad Dressing Market Share of Leading Companies, 2023
Table 3 Product Offerings of Leading Companies
Table 4 Low Growth Scenario Forecasts
Table 5 Reference Case Growth Scenario
Table 6 High Growth Case Scenario
Table 7 Global Low carb Salad Dressing Revenue (USD Million) And CAGR (%) By Type (2021-2032)
Table 8 Global Low carb Salad Dressing Revenue (USD Million) And CAGR (%) By Application (2021-2032)
Table 9 Global Low carb Salad Dressing Revenue (USD Million) And CAGR (%) By Product (2021-2032)
Table 10 Global Low carb Salad Dressing Market Revenue (USD Million) By Regions (2021-2032)
Table 11 Global Low carb Salad Dressing Market Share (%) By Regions (2021-2032)
Table 12 North America Low carb Salad Dressing Revenue (USD Million) By Country (2021-2032)
Table 13 Europe Low carb Salad Dressing Revenue (USD Million) By Country (2021-2032)
Table 14 Asia Pacific Low carb Salad Dressing Revenue (USD Million) By Country (2021-2032)
Table 15 South America Low carb Salad Dressing Revenue (USD Million) By Country (2021-2032)
Table 16 Middle East and Africa Low carb Salad Dressing Revenue (USD Million) By Region (2021-2032)
Table 17 North America Low carb Salad Dressing Revenue (USD Million) By Type (2021-2032)
Table 18 North America Low carb Salad Dressing Revenue (USD Million) By Application (2021-2032)
Table 19 North America Low carb Salad Dressing Revenue (USD Million) By Product (2021-2032)
Table 20 Europe Low carb Salad Dressing Revenue (USD Million) By Type (2021-2032)
Table 21 Europe Low carb Salad Dressing Revenue (USD Million) By Application (2021-2032)
Table 22 Europe Low carb Salad Dressing Revenue (USD Million) By Product (2021-2032)
Table 23 Asia Pacific Low carb Salad Dressing Revenue (USD Million) By Type (2021-2032)
Table 24 Asia Pacific Low carb Salad Dressing Revenue (USD Million) By Application (2021-2032)
Table 25 Asia Pacific Low carb Salad Dressing Revenue (USD Million) By Product (2021-2032)
Table 26 South America Low carb Salad Dressing Revenue (USD Million) By Type (2021-2032)
Table 27 South America Low carb Salad Dressing Revenue (USD Million) By Application (2021-2032)
Table 28 South America Low carb Salad Dressing Revenue (USD Million) By Product (2021-2032)
Table 29 Middle East and Africa Low carb Salad Dressing Revenue (USD Million) By Type (2021-2032)
Table 30 Middle East and Africa Low carb Salad Dressing Revenue (USD Million) By Application (2021-2032)
Table 31 Middle East and Africa Low carb Salad Dressing Revenue (USD Million) By Product (2021-2032)
LIST OF FIGURES
Figure 1. Market Scope
Figure 2. Pricing Forecasts Per Unit, 2023- 2032
Figure 3. Porter’s Five Forces
Figure 4. Global Low carb Salad Dressing Market Revenue (USD Million) By Regions (2021-2032)
Figure 5. Global Low carb Salad Dressing Market Share (%) By Regions (2023)
Figure 6. North America Low carb Salad Dressing Revenue (USD Million) By Country (2021-2032)
Figure 7. United States Low carb Salad Dressing Revenue (USD Million) By Country (2021-2032)
Figure 8. Canada Low carb Salad Dressing Revenue (USD Million) By Country (2021-2032)
Figure 9. Mexico Low carb Salad Dressing Revenue (USD Million) By Country (2021-2032)
Figure 10. Europe Low carb Salad Dressing Revenue (USD Million) By Country (2021-2032)
Figure 11. Germany Low carb Salad Dressing Revenue (USD Million) By Country (2021-2032)
Figure 12. France Low carb Salad Dressing Revenue (USD Million) By Country (2021-2032)
Figure 13. United Kingdom Low carb Salad Dressing Revenue (USD Million) By Country (2021-2032)
Figure 14. Spain Low carb Salad Dressing Revenue (USD Million) By Country (2021-2032)
Figure 15. Italy Low carb Salad Dressing Revenue (USD Million) By Country (2021-2032)
Figure 16. Russia Low carb Salad Dressing Revenue (USD Million) By Country (2021-2032)
Figure 17. Rest of Europe Low carb Salad Dressing Revenue (USD Million) By Country (2021-2032)
Figure 11. Asia Pacific Low carb Salad Dressing Revenue (USD Million) By Country (2021-2032)
Figure 12. China Low carb Salad Dressing Revenue (USD Million) By Country (2021-2032)
Figure 13. Japan Low carb Salad Dressing Revenue (USD Million) By Country (2021-2032)
Figure 14. India Low carb Salad Dressing Revenue (USD Million) By Country (2021-2032)
Figure 15. South Korea Low carb Salad Dressing Revenue (USD Million) By Country (2021-2032)
Figure 16. Australia Low carb Salad Dressing Revenue (USD Million) By Country (2021-2032)
Figure 17. South East Asia Low carb Salad Dressing Revenue (USD Million) By Country (2021-2032)
Figure 18. South America Low carb Salad Dressing Revenue (USD Million) By Country (2021-2032)
Figure 19. Brazil Low carb Salad Dressing Revenue (USD Million) By Country (2021-2032)
Figure 20. Argentina Low carb Salad Dressing Revenue (USD Million) By Country (2021-2032)
Figure 21. Rest of Asia Pacific Low carb Salad Dressing Revenue (USD Million) By Country (2021-2032)
Figure 22. Middle East and Africa Low carb Salad Dressing Revenue (USD Million) By Region (2021-2032)
Figure 23. Saudi Arabia Low carb Salad Dressing Revenue (USD Million) By Region (2021-2032)
Figure 24. The UAE Low carb Salad Dressing Revenue (USD Million) By Region (2021-2032)
Figure 25. Rest of Middle East Low carb Salad Dressing Revenue (USD Million) By Region (2021-2032)
Figure 26. South Africa Low carb Salad Dressing Revenue (USD Million) By Region (2021-2032)
Figure 27. Africa Low carb Salad Dressing Revenue (USD Million) By Region (2021-2032)
Figure 28. North America Low carb Salad Dressing Revenue (USD Million) By Type (2021-2032)
Figure 29. North America Low carb Salad Dressing Revenue (USD Million) By Application (2021-2032)
Figure 30. North America Low carb Salad Dressing Revenue (USD Million) By Product (2021-2032)
Figure 31. Europe Low carb Salad Dressing Revenue (USD Million) By Type (2021-2032)
Figure 32. Europe Low carb Salad Dressing Revenue (USD Million) By Application (2021-2032)
Figure 33. Europe Low carb Salad Dressing Revenue (USD Million) By Product (2021-2032)
Figure 34. Asia Pacific Low carb Salad Dressing Revenue (USD Million) By Type (2021-2032)
Figure 35. Asia Pacific Low carb Salad Dressing Revenue (USD Million) By Application (2021-2032)
Figure 36. Asia Pacific Low carb Salad Dressing Revenue (USD Million) By Product (2021-2032)
Figure 37. South America Low carb Salad Dressing Revenue (USD Million) By Type (2021-2032)
Figure 38. South America Low carb Salad Dressing Revenue (USD Million) By Application (2021-2032)
Figure 39. South America Low carb Salad Dressing Revenue (USD Million) By Product (2021-2032)
Figure 40. Middle East and Africa Low carb Salad Dressing Revenue (USD Million) By Type (2021-2032)
Figure 41. Middle East and Africa Low carb Salad Dressing Revenue (USD Million) By Application (2021-2032)
Figure 42. Middle East and Africa Low carb Salad Dressing Revenue (USD Million) By Product (2021-2032)
By Type
Less Than 1gm per Serving
Equal to 1gm per Serving
By Application
Online Shopping
Retailer
Supermarket
Others
Countries Analyzed
North America (US, Canada, Mexico)
Europe (Germany, UK, France, Spain, Italy, Russia, Rest of Europe)
Asia Pacific (China, India, Japan, South Korea, Australia, South East Asia, Rest of Asia)
South America (Brazil, Argentina, Rest of South America)
Middle East and Africa (Saudi Arabia, UAE, Rest of Middle East, South Africa, Egypt, Rest of Africa)
