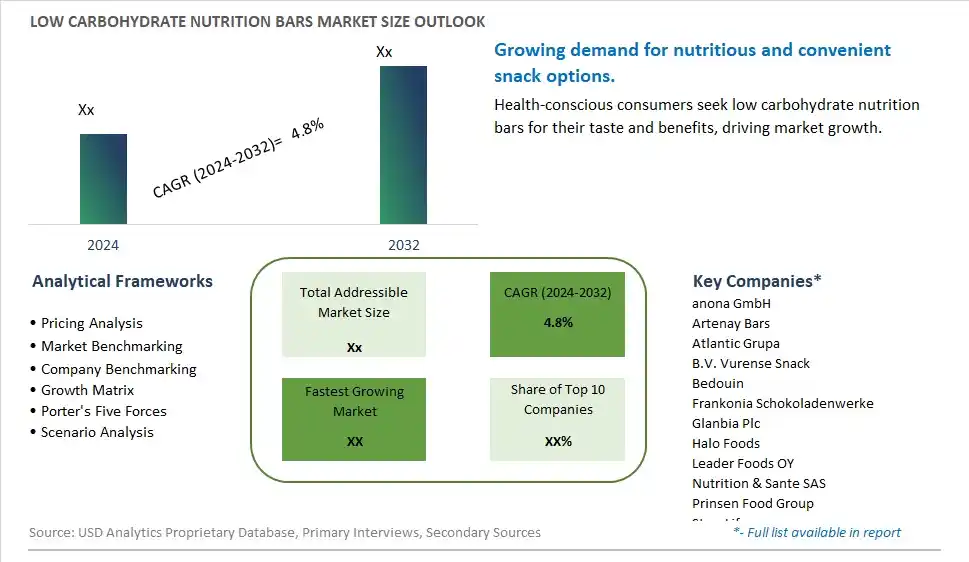
Global Low Carbohydrate Nutrition Bars Market Size is valued at $XX Million in 2024 and is forecast to register a growth rate (CAGR) of 4.8% to reach $XX Million by 2032.
The global Low Carbohydrate Nutrition Bars Market Comprehensive Study analyzes and forecasts the market size across 6 regions and 24 countries for diverse segments -By Type (Organic, Conventional), By Application (Institutional Sales, Specialty Stores, Online Retail, Others)
An Introduction to Low Carbohydrate Nutrition Bars Market
In 2024, the low carbohydrate nutrition bars market is thriving, driven by the increasing demand for convenient, high-protein snacks that support low-carb and ketogenic diets. These bars, formulated with minimal sugars and high-quality protein sources, cater to health-conscious consumers seeking to manage their weight and maintain energy levels. The market benefits from innovations in flavor and texture, ensuring that low-carb nutrition bars are both tasty and satisfying. The trend towards clean label and natural ingredients is influencing product development. The rise of fitness and wellness trends is further propelling market growth.
Low Carbohydrate Nutrition Bars Competitive Landscape
The market report analyses the leading companies in the industry including anona GmbH, Artenay Bars, Atlantic Grupa, B.V. Vurense Snack, Bedouin, Frankonia Schokoladenwerke, Glanbia Plc, Halo Foods, Leader Foods OY, Nutrition & Sante SAS, Prinsen Food Group, SternLife, Viba Sweets, and Others.
Low Carbohydrate Nutrition Bars Market Dynamics
Low Carbohydrate Nutrition Bars Market Trend: Rising Popularity of Low-Carb and High-Protein Snacks
The most prominent trend in the Low Carbohydrate Nutrition Bars Market is the rising popularity of low-carb and high-protein snacks. Consumers are seeking convenient and nutritious snack options that support their low-carb diets and active lifestyles. This trend is driven by the growing interest in fitness, weight management, and healthy eating habits.
Low Carbohydrate Nutrition Bars Market Driver: Health Consciousness and Demand for Functional Foods
A key driver in the Low Carbohydrate Nutrition Bars Market is health consciousness and the demand for functional foods. As more individuals focus on maintaining a balanced diet and achieving their fitness goals, there is a rising demand for nutrition bars that offer low carbohydrate content and high protein levels. These bars provide a convenient source of energy and nutrients, supporting market growth.
Low Carbohydrate Nutrition Bars Market Opportunity: Innovation in Ingredients and Flavors
One significant opportunity in the Low Carbohydrate Nutrition Bars Market lies in innovation in ingredients and flavors. Companies can develop new nutrition bar recipes using alternative sweeteners, high-fiber ingredients, and natural flavors to create appealing and health-conscious products. By offering diverse and nutritious options, manufacturers can attract health-conscious consumers and expand their product offerings.
Low Carbohydrate Nutrition Bars Market Share Analysis: Conventional segment generated the highest revenue share in the industry
The largest segment in the Low Carbohydrate Nutrition Bars Market by type is the Conventional segment. Conventional low carbohydrate nutrition bars dominate the market due to their widespread availability and cost-effectiveness. These bars are made with standard agricultural practices and ingredients, making them more accessible to a broader consumer base compared to their organic counterparts. Conventional nutrition bars offer a variety of flavors and formulations, catering to diverse taste preferences and dietary needs. They are often fortified with essential vitamins, minerals, and protein, making them a convenient and nutritious snack option for health-conscious consumers. The affordability and extensive distribution network of conventional nutrition bars, which includes supermarkets, convenience stores, and online platforms, ensure their dominance in the market. The combination of accessibility, variety, and nutritional benefits makes conventional low carbohydrate nutrition bars the largest segment in the market.
Low Carbohydrate Nutrition Bars Market Share Analysis: Online Retail is the fastest growing segment over the forecast period to 2032
The fastest-growing segment in the Low Carbohydrate Nutrition Bars Market by application is the Online Retail segment. The rapid growth of e-commerce and the increasing preference for online shopping are the primary drivers of this segment's expansion. Consumers are increasingly turning to online platforms for their nutrition bar needs due to the convenience of home delivery, the ability to compare products and prices, and the wide range of options available. Online retailers offer detailed product descriptions, customer reviews, and the ability to discover niche and specialty low carbohydrate nutrition bars that may not be readily available in physical stores. The Past few yearshas significantly accelerated the adoption of online shopping, as more consumers have become accustomed to purchasing their health and wellness products online. Additionally, online retailers often provide competitive pricing, subscription services, and promotional offers, further enhancing their attractiveness. As digital infrastructure and logistics continue to improve, the online retail segment is expected to witness substantial growth, making it the fastest-growing distribution channel in the low carbohydrate nutrition bars market leading up to 2032.
Low Carbohydrate Nutrition Bars Market Segmentation
By Type
Organic
Conventional
By Application
Institutional Sales
Specialty Stores
Online Retail
Others
Countries Analyzed
North America (US, Canada, Mexico)
Europe (Germany, UK, France, Spain, Italy, Russia, Rest of Europe)
Asia Pacific (China, India, Japan, South Korea, Australia, South East Asia, Rest of Asia)
South America (Brazil, Argentina, Rest of South America)
Middle East and Africa (Saudi Arabia, UAE, Rest of Middle East, South Africa, Egypt, Rest of Africa)
Low Carbohydrate Nutrition Bars Companies Profiled in the Study
anona GmbH
Artenay Bars
Atlantic Grupa
B.V. Vurense Snack
Bedouin
Frankonia Schokoladenwerke
Glanbia Plc
Halo Foods
Leader Foods OY
Nutrition & Sante SAS
Prinsen Food Group
SternLife
Viba Sweets
*- List Not Exhaustive
Chapter 1. TABLE OF CONTENTS
Chapter 2. Introduction to Low Carbohydrate Nutrition Bars Market
2.1. Market Overview
2.2. Key Statistics and Report Highlights
2.3. Scope of the Comprehensive Study
2.3.1. Market Definition
2.3.2 Countries and Regions Covered
2.3.3 Research Objective
2.3.4 Units, Currency, and Conversions
2.3.5 Industry Value Chain
2.4. Key Market Segments
2.5. Key Companies
2.6. Study Period
Chapter 3. Strategic Analysis Review
3.1. Low Carbohydrate Nutrition Bars Pricing Analysis and Forecast
3.2. Porter’s Five Forces
3.3. Market Ecosystem
3.4. SWOT Analysis
3.5. Regulatory Scenario
3.3. Effects of Inflation, Russia-Ukraine War, moderating economic growth, and other macroeconomic factors
Chapter 4. Competitive Landscape
4.1. Market Share Analysis
4.1.1. Global Low Carbohydrate Nutrition Bars Market Share by Company, 2023
4.1.2. Product Offerings of Leading Low Carbohydrate Nutrition Bars Companies
4.2. Market Entropy
4.2.1. New Product Launches in the Industry
4.2.2. Mergers, Acquisitions, Joint ventures, and Partnerships
4.3. Key Strategies and Best Practices
Chapter 5. Global Market Projections: Best, Reference, and Low Case Scenarios
5.1. Growth Analysis- Case Scenario Definitions
5.2. Low Growth Case Scenario Forecasts
5.3. Reference Growth Case Scenario Forecasts
5.4. High Growth Case Scenario Forecasts
Chapter 6. Market Dynamics
6.1. Low Carbohydrate Nutrition Bars Market Drivers
6.2. Low Carbohydrate Nutrition Bars Market Challenges
6.6. Low Carbohydrate Nutrition Bars Market Opportunities
6.4. Low Carbohydrate Nutrition Bars Market Trends
Chapter 7. Global Low Carbohydrate Nutrition Bars Market Outlook Trends
7.1. Global Low Carbohydrate Nutrition Bars Revenue (USD Million) and CAGR (%) by Type (2021-2032)
7.2. Global Low Carbohydrate Nutrition Bars Revenue (USD Million) and CAGR (%) by Application (2021-2032)
7.3. Global Low Carbohydrate Nutrition Bars Revenue (USD Million) and CAGR (%) by Product (2021-2032)
By Type
Organic
Conventional
By Application
Institutional Sales
Specialty Stores
Online Retail
Others
Chapter 8. Global Low Carbohydrate Nutrition Bars Regional Analysis and Outlook
8.1. Global Low Carbohydrate Nutrition Bars Revenue (USD Million) By Regions (2021- 2032)
8.2. North America Low Carbohydrate Nutrition Bars Revenue (USD Million) by Country (2021-2032)
8.2.1. United States Low Carbohydrate Nutrition Bars Regional Analysis and Outlook
8.2.2. Canada Low Carbohydrate Nutrition Bars Regional Analysis and Outlook
8.2.3. Mexico Low Carbohydrate Nutrition Bars Regional Analysis and Outlook
8.3. Europe Low Carbohydrate Nutrition Bars Revenue (USD Million), by Country (2021-2032)
8.3.1. Germany Low Carbohydrate Nutrition Bars Regional Analysis and Outlook
8.3.2. France Low Carbohydrate Nutrition Bars Regional Analysis and Outlook
8.3.3. United Kingdom Low Carbohydrate Nutrition Bars Regional Analysis and Outlook
8.3.4. Spain Low Carbohydrate Nutrition Bars Regional Analysis and Outlook
8.3.5. Italy Low Carbohydrate Nutrition Bars Regional Analysis and Outlook
8.3.6. Russia Low Carbohydrate Nutrition Bars Regional Analysis and Outlook
8.3.7. Rest of Europe Low Carbohydrate Nutrition Bars Regional Analysis and Outlook
8.4. Asia Pacific Low Carbohydrate Nutrition Bars Revenue (USD Million) by Country (2021-2032)
8.4.1. China Low Carbohydrate Nutrition Bars Regional Analysis and Outlook
8.4.2. Japan Low Carbohydrate Nutrition Bars Regional Analysis and Outlook
8.4.3. India Low Carbohydrate Nutrition Bars Regional Analysis and Outlook
8.4.4. South Korea Low Carbohydrate Nutrition Bars Regional Analysis and Outlook
8.4.5. Australia Low Carbohydrate Nutrition Bars Regional Analysis and Outlook
8.4.6. South East Asia Low Carbohydrate Nutrition Bars Regional Analysis and Outlook
8.4.7. Rest of Asia Pacific Low Carbohydrate Nutrition Bars Regional Analysis and Outlook
8.5. South America Low Carbohydrate Nutrition Bars Revenue (USD Million), by Country (2021-2032)
8.5.1. Brazil Low Carbohydrate Nutrition Bars Regional Analysis and Outlook
8.5.2. Argentina Low Carbohydrate Nutrition Bars Regional Analysis and Outlook
8.5.3. Rest of South America Low Carbohydrate Nutrition Bars Regional Analysis and Outlook
8.6. Middle East and Africa Low Carbohydrate Nutrition Bars Revenue (USD Million) by Country (2021-2032)
8.6.1. Middle East Low Carbohydrate Nutrition Bars Regional Analysis and Outlook
8.6.2. Africa Low Carbohydrate Nutrition Bars Regional Analysis and Outlook
Chapter 9. North America Low Carbohydrate Nutrition Bars Analysis and Outlook
9.1. North America Low Carbohydrate Nutrition Bars Revenue (USD Million) by Segments (2021-2032)
9.1.1. North America Low Carbohydrate Nutrition Bars Revenue (USD Million) by Type (2021-2032)
9.1.2. North America Low Carbohydrate Nutrition Bars Revenue (USD Million) by Application (2021-2032)
9.1.3. North America Low Carbohydrate Nutrition Bars Revenue (USD Million) by Product (2021-2032)
By Type
Organic
Conventional
By Application
Institutional Sales
Specialty Stores
Online Retail
Others
Chapter 10. Europe Low Carbohydrate Nutrition Bars Analysis and Outlook
10.1. Europe Low Carbohydrate Nutrition Bars Revenue (USD Million), by Segments (USD Million) (2021-2032)
10.1.1. Europe Low Carbohydrate Nutrition Bars Revenue (USD Million) by Type (2021-2032)
10.1.2. Europe Low Carbohydrate Nutrition Bars Revenue (USD Million) by Application (2021-2032)
10.1.3. Europe Low Carbohydrate Nutrition Bars Revenue (USD Million) by Product (2021-2032)
By Type
Organic
Conventional
By Application
Institutional Sales
Specialty Stores
Online Retail
Others
Chapter 11. Asia Pacific Low Carbohydrate Nutrition Bars Analysis and Outlook
11.1. Asia Pacific Low Carbohydrate Nutrition Bars Revenue (USD Million), and Revenue (USD Million) by Segments (2021-2032)
11.1.1. Asia Pacific Low Carbohydrate Nutrition Bars Revenue (USD Million) by Type (2021-2032)
11.1.2. Asia Pacific Low Carbohydrate Nutrition Bars Revenue (USD Million) by Application (2021-2032)
11.1.3. Asia Pacific Low Carbohydrate Nutrition Bars Revenue (USD Million) by Product (2021-2032)
By Type
Organic
Conventional
By Application
Institutional Sales
Specialty Stores
Online Retail
Others
Chapter 12. South America Low Carbohydrate Nutrition Bars Analysis and Outlook
12.1. South America Low Carbohydrate Nutrition Bars Revenue (USD Million), by Segments (2021-2032)
12.1.1. South America Low Carbohydrate Nutrition Bars Revenue (USD Million) by Type (2021-2032)
12.1.2. South America Low Carbohydrate Nutrition Bars Revenue (USD Million) by Application (2021-2032)
12.1.3. South America Low Carbohydrate Nutrition Bars Revenue (USD Million) by Product (2021-2032)
By Type
Organic
Conventional
By Application
Institutional Sales
Specialty Stores
Online Retail
Others
Chapter 13. Middle East and Africa Low Carbohydrate Nutrition Bars Analysis and Outlook
13.1. Middle East and Africa Low Carbohydrate Nutrition Bars Revenue (USD Million), by Segments (2021-2032)
13.1.1. Middle East and Africa Low Carbohydrate Nutrition Bars Revenue (USD Million) by Type (2021-2032)
13.1.2. Middle East and Africa Low Carbohydrate Nutrition Bars Revenue (USD Million) by Application (2021-2032)
13.1.3. Middle East and Africa Low Carbohydrate Nutrition Bars Revenue (USD Million) by Product (2021-2032)
By Type
Organic
Conventional
By Application
Institutional Sales
Specialty Stores
Online Retail
Others
Chapter 14. Low Carbohydrate Nutrition Bars Company Profiles
14.1 Business Overview
14.2 Product Profiles
14.3 SWOT Profiles
14.5 Recent Developments
14.6 Financial Profile
List of Companies
anona GmbH
Artenay Bars
Atlantic Grupa
B.V. Vurense Snack
Bedouin
Frankonia Schokoladenwerke
Glanbia Plc
Halo Foods
Leader Foods OY
Nutrition & Sante SAS
Prinsen Food Group
SternLife
Viba Sweets
15. Methodology and Data Sources
15.1 Customization Offerings
15.2 Subscription Services
15.3 Related Reports
15.4 Publisher Expertise
LIST OF TABLES
Table 1 Market Segmentation Analysis
Table 2 Global Low Carbohydrate Nutrition Bars Market Share of Leading Companies, 2023
Table 3 Product Offerings of Leading Companies
Table 4 Low Growth Scenario Forecasts
Table 5 Reference Case Growth Scenario
Table 6 High Growth Case Scenario
Table 7 Global Low Carbohydrate Nutrition Bars Revenue (USD Million) And CAGR (%) By Type (2021-2032)
Table 8 Global Low Carbohydrate Nutrition Bars Revenue (USD Million) And CAGR (%) By Application (2021-2032)
Table 9 Global Low Carbohydrate Nutrition Bars Revenue (USD Million) And CAGR (%) By Product (2021-2032)
Table 10 Global Low Carbohydrate Nutrition Bars Market Revenue (USD Million) By Regions (2021-2032)
Table 11 Global Low Carbohydrate Nutrition Bars Market Share (%) By Regions (2021-2032)
Table 12 North America Low Carbohydrate Nutrition Bars Revenue (USD Million) By Country (2021-2032)
Table 13 Europe Low Carbohydrate Nutrition Bars Revenue (USD Million) By Country (2021-2032)
Table 14 Asia Pacific Low Carbohydrate Nutrition Bars Revenue (USD Million) By Country (2021-2032)
Table 15 South America Low Carbohydrate Nutrition Bars Revenue (USD Million) By Country (2021-2032)
Table 16 Middle East and Africa Low Carbohydrate Nutrition Bars Revenue (USD Million) By Region (2021-2032)
Table 17 North America Low Carbohydrate Nutrition Bars Revenue (USD Million) By Type (2021-2032)
Table 18 North America Low Carbohydrate Nutrition Bars Revenue (USD Million) By Application (2021-2032)
Table 19 North America Low Carbohydrate Nutrition Bars Revenue (USD Million) By Product (2021-2032)
Table 20 Europe Low Carbohydrate Nutrition Bars Revenue (USD Million) By Type (2021-2032)
Table 21 Europe Low Carbohydrate Nutrition Bars Revenue (USD Million) By Application (2021-2032)
Table 22 Europe Low Carbohydrate Nutrition Bars Revenue (USD Million) By Product (2021-2032)
Table 23 Asia Pacific Low Carbohydrate Nutrition Bars Revenue (USD Million) By Type (2021-2032)
Table 24 Asia Pacific Low Carbohydrate Nutrition Bars Revenue (USD Million) By Application (2021-2032)
Table 25 Asia Pacific Low Carbohydrate Nutrition Bars Revenue (USD Million) By Product (2021-2032)
Table 26 South America Low Carbohydrate Nutrition Bars Revenue (USD Million) By Type (2021-2032)
Table 27 South America Low Carbohydrate Nutrition Bars Revenue (USD Million) By Application (2021-2032)
Table 28 South America Low Carbohydrate Nutrition Bars Revenue (USD Million) By Product (2021-2032)
Table 29 Middle East and Africa Low Carbohydrate Nutrition Bars Revenue (USD Million) By Type (2021-2032)
Table 30 Middle East and Africa Low Carbohydrate Nutrition Bars Revenue (USD Million) By Application (2021-2032)
Table 31 Middle East and Africa Low Carbohydrate Nutrition Bars Revenue (USD Million) By Product (2021-2032)
LIST OF FIGURES
Figure 1. Market Scope
Figure 2. Pricing Forecasts Per Unit, 2023- 2032
Figure 3. Porter’s Five Forces
Figure 4. Global Low Carbohydrate Nutrition Bars Market Revenue (USD Million) By Regions (2021-2032)
Figure 5. Global Low Carbohydrate Nutrition Bars Market Share (%) By Regions (2023)
Figure 6. North America Low Carbohydrate Nutrition Bars Revenue (USD Million) By Country (2021-2032)
Figure 7. United States Low Carbohydrate Nutrition Bars Revenue (USD Million) By Country (2021-2032)
Figure 8. Canada Low Carbohydrate Nutrition Bars Revenue (USD Million) By Country (2021-2032)
Figure 9. Mexico Low Carbohydrate Nutrition Bars Revenue (USD Million) By Country (2021-2032)
Figure 10. Europe Low Carbohydrate Nutrition Bars Revenue (USD Million) By Country (2021-2032)
Figure 11. Germany Low Carbohydrate Nutrition Bars Revenue (USD Million) By Country (2021-2032)
Figure 12. France Low Carbohydrate Nutrition Bars Revenue (USD Million) By Country (2021-2032)
Figure 13. United Kingdom Low Carbohydrate Nutrition Bars Revenue (USD Million) By Country (2021-2032)
Figure 14. Spain Low Carbohydrate Nutrition Bars Revenue (USD Million) By Country (2021-2032)
Figure 15. Italy Low Carbohydrate Nutrition Bars Revenue (USD Million) By Country (2021-2032)
Figure 16. Russia Low Carbohydrate Nutrition Bars Revenue (USD Million) By Country (2021-2032)
Figure 17. Rest of Europe Low Carbohydrate Nutrition Bars Revenue (USD Million) By Country (2021-2032)
Figure 11. Asia Pacific Low Carbohydrate Nutrition Bars Revenue (USD Million) By Country (2021-2032)
Figure 12. China Low Carbohydrate Nutrition Bars Revenue (USD Million) By Country (2021-2032)
Figure 13. Japan Low Carbohydrate Nutrition Bars Revenue (USD Million) By Country (2021-2032)
Figure 14. India Low Carbohydrate Nutrition Bars Revenue (USD Million) By Country (2021-2032)
Figure 15. South Korea Low Carbohydrate Nutrition Bars Revenue (USD Million) By Country (2021-2032)
Figure 16. Australia Low Carbohydrate Nutrition Bars Revenue (USD Million) By Country (2021-2032)
Figure 17. South East Asia Low Carbohydrate Nutrition Bars Revenue (USD Million) By Country (2021-2032)
Figure 18. South America Low Carbohydrate Nutrition Bars Revenue (USD Million) By Country (2021-2032)
Figure 19. Brazil Low Carbohydrate Nutrition Bars Revenue (USD Million) By Country (2021-2032)
Figure 20. Argentina Low Carbohydrate Nutrition Bars Revenue (USD Million) By Country (2021-2032)
Figure 21. Rest of Asia Pacific Low Carbohydrate Nutrition Bars Revenue (USD Million) By Country (2021-2032)
Figure 22. Middle East and Africa Low Carbohydrate Nutrition Bars Revenue (USD Million) By Region (2021-2032)
Figure 23. Saudi Arabia Low Carbohydrate Nutrition Bars Revenue (USD Million) By Region (2021-2032)
Figure 24. The UAE Low Carbohydrate Nutrition Bars Revenue (USD Million) By Region (2021-2032)
Figure 25. Rest of Middle East Low Carbohydrate Nutrition Bars Revenue (USD Million) By Region (2021-2032)
Figure 26. South Africa Low Carbohydrate Nutrition Bars Revenue (USD Million) By Region (2021-2032)
Figure 27. Africa Low Carbohydrate Nutrition Bars Revenue (USD Million) By Region (2021-2032)
Figure 28. North America Low Carbohydrate Nutrition Bars Revenue (USD Million) By Type (2021-2032)
Figure 29. North America Low Carbohydrate Nutrition Bars Revenue (USD Million) By Application (2021-2032)
Figure 30. North America Low Carbohydrate Nutrition Bars Revenue (USD Million) By Product (2021-2032)
Figure 31. Europe Low Carbohydrate Nutrition Bars Revenue (USD Million) By Type (2021-2032)
Figure 32. Europe Low Carbohydrate Nutrition Bars Revenue (USD Million) By Application (2021-2032)
Figure 33. Europe Low Carbohydrate Nutrition Bars Revenue (USD Million) By Product (2021-2032)
Figure 34. Asia Pacific Low Carbohydrate Nutrition Bars Revenue (USD Million) By Type (2021-2032)
Figure 35. Asia Pacific Low Carbohydrate Nutrition Bars Revenue (USD Million) By Application (2021-2032)
Figure 36. Asia Pacific Low Carbohydrate Nutrition Bars Revenue (USD Million) By Product (2021-2032)
Figure 37. South America Low Carbohydrate Nutrition Bars Revenue (USD Million) By Type (2021-2032)
Figure 38. South America Low Carbohydrate Nutrition Bars Revenue (USD Million) By Application (2021-2032)
Figure 39. South America Low Carbohydrate Nutrition Bars Revenue (USD Million) By Product (2021-2032)
Figure 40. Middle East and Africa Low Carbohydrate Nutrition Bars Revenue (USD Million) By Type (2021-2032)
Figure 41. Middle East and Africa Low Carbohydrate Nutrition Bars Revenue (USD Million) By Application (2021-2032)
Figure 42. Middle East and Africa Low Carbohydrate Nutrition Bars Revenue (USD Million) By Product (2021-2032)
By Type
Organic
Conventional
By Application
Institutional Sales
Specialty Stores
Online Retail
Others
Countries Analyzed
North America (US, Canada, Mexico)
Europe (Germany, UK, France, Spain, Italy, Russia, Rest of Europe)
Asia Pacific (China, India, Japan, South Korea, Australia, South East Asia, Rest of Asia)
South America (Brazil, Argentina, Rest of South America)
Middle East and Africa (Saudi Arabia, UAE, Rest of Middle East, South Africa, Egypt, Rest of Africa)
