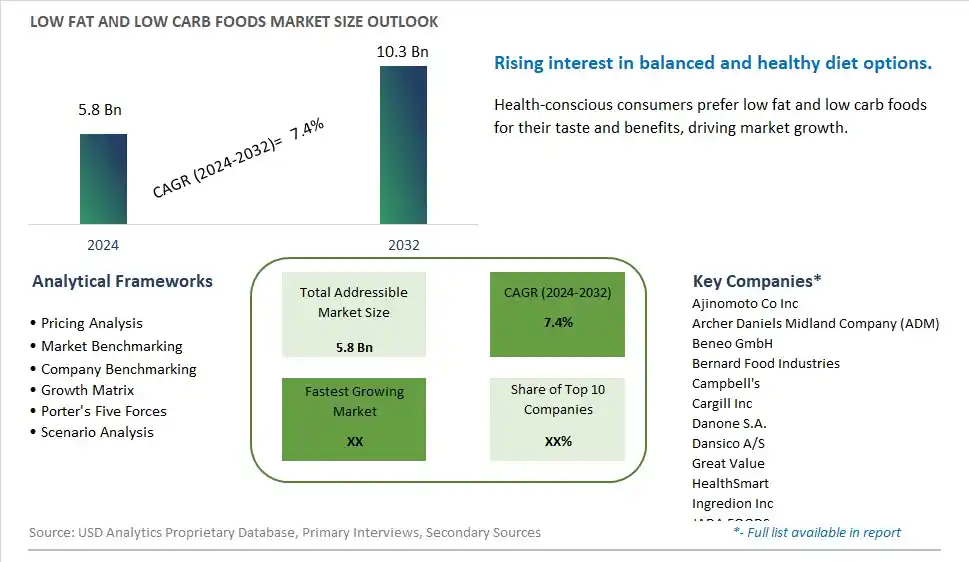
Global Low Fat and Low Carb Foods Market Size is valued at $5.8 Billion in 2024 and is forecast to register a growth rate (CAGR) of 7.4% to reach $10.3 Billion by 2032.
The global Low Fat and Low Carb Foods Market Comprehensive Study analyzes and forecasts the market size across 6 regions and 24 countries for diverse segments -By Form (Granules, Liquids, Powders, Sliced, Whole, Bars, Others), By Flavor (Unflavored, Flavored, -Chocolate, -Vanilla, -Orange, -Cherry, -Grape, -Berry, -Apple, -Mint, -Coconut, -Citrus, -Caramel, -Others), By Distribution Channel (Supermarkets/Hypermarkets, convenient Stores, Grocery Stores, Online Stores, Others)
An Introduction to Low Fat and Low Carb Foods Market
The low fat and low carb foods market in 2024 is expanding rapidly, fueled by the growing consumer interest in healthier eating habits. These products, which include a wide range of snacks, meals, and beverages, offer the benefits of reduced fat and carbohydrate content while maintaining flavor and nutritional value. The market benefits from advancements in food science and ingredient innovation, which enhance product quality and taste. The trend towards clean label and natural ingredients is influencing market dynamics. Increasing awareness of diet-related health issues and the popularity of weight management programs are further supporting market growth.
Low Fat and Low Carb Foods Competitive Landscape
The market report analyses the leading companies in the industry including Ajinomoto Co Inc, Archer Daniels Midland Company (ADM), Beneo GmbH, Bernard Food Industries, Campbell's, Cargill Inc, Danone S.A., Dansico A/S, Great Value, HealthSmart, Ingredion Inc, JADA FOODS, McNeil Nutritionals, Nestlé SA, PepsiCo Inc, Progresso, The Coca-Cola Company, and Others.
Low Fat and Low Carb Foods Market Dynamics
Low Fat and Low Carb Foods Market Trend: Growing Demand for Healthier Food Alternatives
The most prominent trend in the Low Fat and Low Carb Foods Market is the growing demand for healthier food alternatives. Consumers are seeking food products that offer the benefits of reduced fat and carbohydrate content while still providing satisfying taste and texture. This trend is driven by the increasing awareness of the health impacts of high-fat and high-carb diets and the desire for better-for-you options.
Low Fat and Low Carb Foods Market Driver: Health Consciousness and Dietary Changes
A key driver in the Low Fat and Low Carb Foods Market is health consciousness and dietary changes. As more individuals adopt healthier eating habits and focus on weight management, there is a rising demand for foods that support these goals. Low fat and low carb foods, which offer lighter and more nutritious options, cater to this demand and support market growth.
Low Fat and Low Carb Foods Market Opportunity: Expansion into Diverse Food Categories
One significant opportunity in the Low Fat and Low Carb Foods Market lies in expansion into diverse food categories. Companies can innovate by offering a wide variety of low fat and low carb foods, such as snacks, baked goods, and meal replacements, and incorporating healthy ingredients like whole grains, lean proteins, and vegetables. By providing diverse and nutritious options, manufacturers can attract health-conscious consumers and drive market growth.
Low Fat and Low Carb Foods Market Share Analysis: Bars segment generated the highest revenue share in the industry
The largest segment in the Low Fat and Low Carb Foods Market by form is the Bars segment. Low fat and low carb bars have become extremely popular due to their convenience, portability, and ability to deliver balanced nutrition in a compact form. These bars are favored by health-conscious consumers, athletes, and busy individuals looking for quick, on-the-go snacks that align with their dietary preferences. They come in various formulations, including protein bars, meal replacement bars, and energy bars, which cater to different nutritional needs and taste preferences. The versatility and wide availability of these bars in supermarkets, convenience stores, and online platforms contribute to their dominance in the market. Additionally, manufacturers continue to innovate with new flavors and ingredients, keeping consumer interest high and ensuring sustained demand. The combination of convenience, variety, and nutritional benefits makes bars the largest segment in the low fat and low carb foods market.
Low Fat and Low Carb Foods Market Share Analysis: Flavored (Berry) is the fastest growing segment over the forecast period to 2032
The fastest-growing segment in the Low Fat and Low Carb Foods Market by flavor is the Flavored segment, with Berry being the standout. Berry-flavored low fat and low carb foods are rapidly gaining popularity due to their appealing taste and perceived health benefits. Berries are often associated with antioxidants, vitamins, and minerals, which enhance their attractiveness to health-conscious consumers. The natural sweetness and vibrant flavor of berries, such as strawberry, blueberry, raspberry, and blackberry, make them a favorite choice for flavoring a wide range of products, including bars, shakes, yogurts, and snacks. The growing consumer preference for natural and fruity flavors, combined with the health halo surrounding berries, drives the demand for berry-flavored low fat and low carb foods. As manufacturers continue to innovate and expand their product lines with berry flavors, this segment is expected to experience substantial growth, making it the fastest-growing flavor category in the low fat and low carb foods market leading up to 2032.
Low Fat and Low Carb Foods Market Share Analysis: Supermarkets/Hypermarkets segment generated the highest revenue share in the industry
The largest segment in the Low Fat and Low Carb Foods Market by distribution channel is the Supermarkets/Hypermarkets segment. Supermarkets and hypermarkets dominate this market due to their extensive reach, wide product range, and the convenience they offer to consumers. These retail giants provide a one-stop shopping experience where consumers can find a variety of low fat and low carb food products under one roof. The ability to physically inspect products, read nutritional labels, and compare different brands in-store adds to their appeal. Additionally, supermarkets and hypermarkets often run promotional campaigns, discounts, and loyalty programs that attract a large number of health-conscious shoppers looking for value deals. The strategic location of these stores in urban and suburban areas ensures high foot traffic and accessibility, further cementing their dominance in the market. The comprehensive selection and convenience offered by supermarkets and hypermarkets make them the largest segment in the distribution of low fat and low carb foods.
Low Fat and Low Carb Foods Market Share Analysis: Online Stores is the fastest growing segment over the forecast period to 2032
The fastest-growing segment in the Low Fat and Low Carb Foods Market by distribution channel is the Online Stores segment. The rapid growth of e-commerce and the increasing preference for online shopping are driving this expansion. Consumers are increasingly turning to online platforms for their dietary needs due to the convenience of home delivery, the ability to compare products and prices, and the vast selection available. Online stores offer detailed product descriptions, customer reviews, and the convenience of shopping from anywhere at any time, making it an attractive option for busy and health-conscious consumers. The Past few yearshas significantly accelerated the adoption of online shopping, as more consumers have become accustomed to purchasing their groceries and dietary products online. Additionally, online retailers often provide competitive pricing, subscription services, and promotional offers, further enhancing their attractiveness. As digital infrastructure and logistics continue to improve, the online stores segment is expected to witness substantial growth, making it the fastest-growing distribution channel in the low fat and low carb foods market leading up to 2032.
Low Fat and Low Carb Foods Market Segmentation
By Form
Granules
Liquids
Powders
Sliced
Whole
Bars
Others
By Flavor
Unflavored
Flavored
-Chocolate
-Vanilla
-Orange
-Cherry
-Grape
-Berry
-Apple
-Mint
-Coconut
-Citrus
-Caramel
-Others
By Distribution Channel
Supermarkets/Hypermarkets
convenient Stores
Grocery Stores
Online Stores
Others
Countries Analyzed
North America (US, Canada, Mexico)
Europe (Germany, UK, France, Spain, Italy, Russia, Rest of Europe)
Asia Pacific (China, India, Japan, South Korea, Australia, South East Asia, Rest of Asia)
South America (Brazil, Argentina, Rest of South America)
Middle East and Africa (Saudi Arabia, UAE, Rest of Middle East, South Africa, Egypt, Rest of Africa)
Low Fat and Low Carb Foods Companies Profiled in the Study
Ajinomoto Co Inc
Archer Daniels Midland Company (ADM)
Beneo GmbH
Bernard Food Industries
Campbell's
Cargill Inc
Danone S.A.
Dansico A/S
Great Value
HealthSmart
Ingredion Inc
JADA FOODS
McNeil Nutritionals
Nestlé SA
PepsiCo Inc
Progresso
The Coca-Cola Company
*- List Not Exhaustive
Chapter 1. TABLE OF CONTENTS
Chapter 2. Introduction to Low Fat and Low Carb Foods Market
2.1. Market Overview
2.2. Key Statistics and Report Highlights
2.3. Scope of the Comprehensive Study
2.3.1. Market Definition
2.3.2 Countries and Regions Covered
2.3.3 Research Objective
2.3.4 Units, Currency, and Conversions
2.3.5 Industry Value Chain
2.4. Key Market Segments
2.5. Key Companies
2.6. Study Period
Chapter 3. Strategic Analysis Review
3.1. Low Fat and Low Carb Foods Pricing Analysis and Forecast
3.2. Porter’s Five Forces
3.3. Market Ecosystem
3.4. SWOT Analysis
3.5. Regulatory Scenario
3.3. Effects of Inflation, Russia-Ukraine War, moderating economic growth, and other macroeconomic factors
Chapter 4. Competitive Landscape
4.1. Market Share Analysis
4.1.1. Global Low Fat and Low Carb Foods Market Share by Company, 2023
4.1.2. Product Offerings of Leading Low Fat and Low Carb Foods Companies
4.2. Market Entropy
4.2.1. New Product Launches in the Industry
4.2.2. Mergers, Acquisitions, Joint ventures, and Partnerships
4.3. Key Strategies and Best Practices
Chapter 5. Global Market Projections: Best, Reference, and Low Case Scenarios
5.1. Growth Analysis- Case Scenario Definitions
5.2. Low Growth Case Scenario Forecasts
5.3. Reference Growth Case Scenario Forecasts
5.4. High Growth Case Scenario Forecasts
Chapter 6. Market Dynamics
6.1. Low Fat and Low Carb Foods Market Drivers
6.2. Low Fat and Low Carb Foods Market Challenges
6.6. Low Fat and Low Carb Foods Market Opportunities
6.4. Low Fat and Low Carb Foods Market Trends
Chapter 7. Global Low Fat and Low Carb Foods Market Outlook Trends
7.1. Global Low Fat and Low Carb Foods Revenue (USD Million) and CAGR (%) by Type (2021-2032)
7.2. Global Low Fat and Low Carb Foods Revenue (USD Million) and CAGR (%) by Application (2021-2032)
7.3. Global Low Fat and Low Carb Foods Revenue (USD Million) and CAGR (%) by Product (2021-2032)
By Form
Granules
Liquids
Powders
Sliced
Whole
Bars
Others
By Flavor
Unflavored
Flavored
-Chocolate
-Vanilla
-Orange
-Cherry
-Grape
-Berry
-Apple
-Mint
-Coconut
-Citrus
-Caramel
-Others
By Distribution Channel
Supermarkets/Hypermarkets
convenient Stores
Grocery Stores
Online Stores
Others
Chapter 8. Global Low Fat and Low Carb Foods Regional Analysis and Outlook
8.1. Global Low Fat and Low Carb Foods Revenue (USD Million) By Regions (2021- 2032)
8.2. North America Low Fat and Low Carb Foods Revenue (USD Million) by Country (2021-2032)
8.2.1. United States Low Fat and Low Carb Foods Regional Analysis and Outlook
8.2.2. Canada Low Fat and Low Carb Foods Regional Analysis and Outlook
8.2.3. Mexico Low Fat and Low Carb Foods Regional Analysis and Outlook
8.3. Europe Low Fat and Low Carb Foods Revenue (USD Million), by Country (2021-2032)
8.3.1. Germany Low Fat and Low Carb Foods Regional Analysis and Outlook
8.3.2. France Low Fat and Low Carb Foods Regional Analysis and Outlook
8.3.3. United Kingdom Low Fat and Low Carb Foods Regional Analysis and Outlook
8.3.4. Spain Low Fat and Low Carb Foods Regional Analysis and Outlook
8.3.5. Italy Low Fat and Low Carb Foods Regional Analysis and Outlook
8.3.6. Russia Low Fat and Low Carb Foods Regional Analysis and Outlook
8.3.7. Rest of Europe Low Fat and Low Carb Foods Regional Analysis and Outlook
8.4. Asia Pacific Low Fat and Low Carb Foods Revenue (USD Million) by Country (2021-2032)
8.4.1. China Low Fat and Low Carb Foods Regional Analysis and Outlook
8.4.2. Japan Low Fat and Low Carb Foods Regional Analysis and Outlook
8.4.3. India Low Fat and Low Carb Foods Regional Analysis and Outlook
8.4.4. South Korea Low Fat and Low Carb Foods Regional Analysis and Outlook
8.4.5. Australia Low Fat and Low Carb Foods Regional Analysis and Outlook
8.4.6. South East Asia Low Fat and Low Carb Foods Regional Analysis and Outlook
8.4.7. Rest of Asia Pacific Low Fat and Low Carb Foods Regional Analysis and Outlook
8.5. South America Low Fat and Low Carb Foods Revenue (USD Million), by Country (2021-2032)
8.5.1. Brazil Low Fat and Low Carb Foods Regional Analysis and Outlook
8.5.2. Argentina Low Fat and Low Carb Foods Regional Analysis and Outlook
8.5.3. Rest of South America Low Fat and Low Carb Foods Regional Analysis and Outlook
8.6. Middle East and Africa Low Fat and Low Carb Foods Revenue (USD Million) by Country (2021-2032)
8.6.1. Middle East Low Fat and Low Carb Foods Regional Analysis and Outlook
8.6.2. Africa Low Fat and Low Carb Foods Regional Analysis and Outlook
Chapter 9. North America Low Fat and Low Carb Foods Analysis and Outlook
9.1. North America Low Fat and Low Carb Foods Revenue (USD Million) by Segments (2021-2032)
9.1.1. North America Low Fat and Low Carb Foods Revenue (USD Million) by Type (2021-2032)
9.1.2. North America Low Fat and Low Carb Foods Revenue (USD Million) by Application (2021-2032)
9.1.3. North America Low Fat and Low Carb Foods Revenue (USD Million) by Product (2021-2032)
By Form
Granules
Liquids
Powders
Sliced
Whole
Bars
Others
By Flavor
Unflavored
Flavored
-Chocolate
-Vanilla
-Orange
-Cherry
-Grape
-Berry
-Apple
-Mint
-Coconut
-Citrus
-Caramel
-Others
By Distribution Channel
Supermarkets/Hypermarkets
convenient Stores
Grocery Stores
Online Stores
Others
Chapter 10. Europe Low Fat and Low Carb Foods Analysis and Outlook
10.1. Europe Low Fat and Low Carb Foods Revenue (USD Million), by Segments (USD Million) (2021-2032)
10.1.1. Europe Low Fat and Low Carb Foods Revenue (USD Million) by Type (2021-2032)
10.1.2. Europe Low Fat and Low Carb Foods Revenue (USD Million) by Application (2021-2032)
10.1.3. Europe Low Fat and Low Carb Foods Revenue (USD Million) by Product (2021-2032)
By Form
Granules
Liquids
Powders
Sliced
Whole
Bars
Others
By Flavor
Unflavored
Flavored
-Chocolate
-Vanilla
-Orange
-Cherry
-Grape
-Berry
-Apple
-Mint
-Coconut
-Citrus
-Caramel
-Others
By Distribution Channel
Supermarkets/Hypermarkets
convenient Stores
Grocery Stores
Online Stores
Others
Chapter 11. Asia Pacific Low Fat and Low Carb Foods Analysis and Outlook
11.1. Asia Pacific Low Fat and Low Carb Foods Revenue (USD Million), and Revenue (USD Million) by Segments (2021-2032)
11.1.1. Asia Pacific Low Fat and Low Carb Foods Revenue (USD Million) by Type (2021-2032)
11.1.2. Asia Pacific Low Fat and Low Carb Foods Revenue (USD Million) by Application (2021-2032)
11.1.3. Asia Pacific Low Fat and Low Carb Foods Revenue (USD Million) by Product (2021-2032)
By Form
Granules
Liquids
Powders
Sliced
Whole
Bars
Others
By Flavor
Unflavored
Flavored
-Chocolate
-Vanilla
-Orange
-Cherry
-Grape
-Berry
-Apple
-Mint
-Coconut
-Citrus
-Caramel
-Others
By Distribution Channel
Supermarkets/Hypermarkets
convenient Stores
Grocery Stores
Online Stores
Others
Chapter 12. South America Low Fat and Low Carb Foods Analysis and Outlook
12.1. South America Low Fat and Low Carb Foods Revenue (USD Million), by Segments (2021-2032)
12.1.1. South America Low Fat and Low Carb Foods Revenue (USD Million) by Type (2021-2032)
12.1.2. South America Low Fat and Low Carb Foods Revenue (USD Million) by Application (2021-2032)
12.1.3. South America Low Fat and Low Carb Foods Revenue (USD Million) by Product (2021-2032)
By Form
Granules
Liquids
Powders
Sliced
Whole
Bars
Others
By Flavor
Unflavored
Flavored
-Chocolate
-Vanilla
-Orange
-Cherry
-Grape
-Berry
-Apple
-Mint
-Coconut
-Citrus
-Caramel
-Others
By Distribution Channel
Supermarkets/Hypermarkets
convenient Stores
Grocery Stores
Online Stores
Others
Chapter 13. Middle East and Africa Low Fat and Low Carb Foods Analysis and Outlook
13.1. Middle East and Africa Low Fat and Low Carb Foods Revenue (USD Million), by Segments (2021-2032)
13.1.1. Middle East and Africa Low Fat and Low Carb Foods Revenue (USD Million) by Type (2021-2032)
13.1.2. Middle East and Africa Low Fat and Low Carb Foods Revenue (USD Million) by Application (2021-2032)
13.1.3. Middle East and Africa Low Fat and Low Carb Foods Revenue (USD Million) by Product (2021-2032)
By Form
Granules
Liquids
Powders
Sliced
Whole
Bars
Others
By Flavor
Unflavored
Flavored
-Chocolate
-Vanilla
-Orange
-Cherry
-Grape
-Berry
-Apple
-Mint
-Coconut
-Citrus
-Caramel
-Others
By Distribution Channel
Supermarkets/Hypermarkets
convenient Stores
Grocery Stores
Online Stores
Others
Chapter 14. Low Fat and Low Carb Foods Company Profiles
14.1 Business Overview
14.2 Product Profiles
14.3 SWOT Profiles
14.5 Recent Developments
14.6 Financial Profile
List of Companies
Ajinomoto Co Inc
Archer Daniels Midland Company (ADM)
Beneo GmbH
Bernard Food Industries
Campbell's
Cargill Inc
Danone S.A.
Dansico A/S
Great Value
HealthSmart
Ingredion Inc
JADA FOODS
McNeil Nutritionals
Nestlé SA
PepsiCo Inc
Progresso
The Coca-Cola Company
15. Methodology and Data Sources
15.1 Customization Offerings
15.2 Subscription Services
15.3 Related Reports
15.4 Publisher Expertise
LIST OF TABLES
Table 1 Market Segmentation Analysis
Table 2 Global Low Fat and Low Carb Foods Market Share of Leading Companies, 2023
Table 3 Product Offerings of Leading Companies
Table 4 Low Growth Scenario Forecasts
Table 5 Reference Case Growth Scenario
Table 6 High Growth Case Scenario
Table 7 Global Low Fat and Low Carb Foods Revenue (USD Million) And CAGR (%) By Type (2021-2032)
Table 8 Global Low Fat and Low Carb Foods Revenue (USD Million) And CAGR (%) By Application (2021-2032)
Table 9 Global Low Fat and Low Carb Foods Revenue (USD Million) And CAGR (%) By Product (2021-2032)
Table 10 Global Low Fat and Low Carb Foods Market Revenue (USD Million) By Regions (2021-2032)
Table 11 Global Low Fat and Low Carb Foods Market Share (%) By Regions (2021-2032)
Table 12 North America Low Fat and Low Carb Foods Revenue (USD Million) By Country (2021-2032)
Table 13 Europe Low Fat and Low Carb Foods Revenue (USD Million) By Country (2021-2032)
Table 14 Asia Pacific Low Fat and Low Carb Foods Revenue (USD Million) By Country (2021-2032)
Table 15 South America Low Fat and Low Carb Foods Revenue (USD Million) By Country (2021-2032)
Table 16 Middle East and Africa Low Fat and Low Carb Foods Revenue (USD Million) By Region (2021-2032)
Table 17 North America Low Fat and Low Carb Foods Revenue (USD Million) By Type (2021-2032)
Table 18 North America Low Fat and Low Carb Foods Revenue (USD Million) By Application (2021-2032)
Table 19 North America Low Fat and Low Carb Foods Revenue (USD Million) By Product (2021-2032)
Table 20 Europe Low Fat and Low Carb Foods Revenue (USD Million) By Type (2021-2032)
Table 21 Europe Low Fat and Low Carb Foods Revenue (USD Million) By Application (2021-2032)
Table 22 Europe Low Fat and Low Carb Foods Revenue (USD Million) By Product (2021-2032)
Table 23 Asia Pacific Low Fat and Low Carb Foods Revenue (USD Million) By Type (2021-2032)
Table 24 Asia Pacific Low Fat and Low Carb Foods Revenue (USD Million) By Application (2021-2032)
Table 25 Asia Pacific Low Fat and Low Carb Foods Revenue (USD Million) By Product (2021-2032)
Table 26 South America Low Fat and Low Carb Foods Revenue (USD Million) By Type (2021-2032)
Table 27 South America Low Fat and Low Carb Foods Revenue (USD Million) By Application (2021-2032)
Table 28 South America Low Fat and Low Carb Foods Revenue (USD Million) By Product (2021-2032)
Table 29 Middle East and Africa Low Fat and Low Carb Foods Revenue (USD Million) By Type (2021-2032)
Table 30 Middle East and Africa Low Fat and Low Carb Foods Revenue (USD Million) By Application (2021-2032)
Table 31 Middle East and Africa Low Fat and Low Carb Foods Revenue (USD Million) By Product (2021-2032)
LIST OF FIGURES
Figure 1. Market Scope
Figure 2. Pricing Forecasts Per Unit, 2023- 2032
Figure 3. Porter’s Five Forces
Figure 4. Global Low Fat and Low Carb Foods Market Revenue (USD Million) By Regions (2021-2032)
Figure 5. Global Low Fat and Low Carb Foods Market Share (%) By Regions (2023)
Figure 6. North America Low Fat and Low Carb Foods Revenue (USD Million) By Country (2021-2032)
Figure 7. United States Low Fat and Low Carb Foods Revenue (USD Million) By Country (2021-2032)
Figure 8. Canada Low Fat and Low Carb Foods Revenue (USD Million) By Country (2021-2032)
Figure 9. Mexico Low Fat and Low Carb Foods Revenue (USD Million) By Country (2021-2032)
Figure 10. Europe Low Fat and Low Carb Foods Revenue (USD Million) By Country (2021-2032)
Figure 11. Germany Low Fat and Low Carb Foods Revenue (USD Million) By Country (2021-2032)
Figure 12. France Low Fat and Low Carb Foods Revenue (USD Million) By Country (2021-2032)
Figure 13. United Kingdom Low Fat and Low Carb Foods Revenue (USD Million) By Country (2021-2032)
Figure 14. Spain Low Fat and Low Carb Foods Revenue (USD Million) By Country (2021-2032)
Figure 15. Italy Low Fat and Low Carb Foods Revenue (USD Million) By Country (2021-2032)
Figure 16. Russia Low Fat and Low Carb Foods Revenue (USD Million) By Country (2021-2032)
Figure 17. Rest of Europe Low Fat and Low Carb Foods Revenue (USD Million) By Country (2021-2032)
Figure 11. Asia Pacific Low Fat and Low Carb Foods Revenue (USD Million) By Country (2021-2032)
Figure 12. China Low Fat and Low Carb Foods Revenue (USD Million) By Country (2021-2032)
Figure 13. Japan Low Fat and Low Carb Foods Revenue (USD Million) By Country (2021-2032)
Figure 14. India Low Fat and Low Carb Foods Revenue (USD Million) By Country (2021-2032)
Figure 15. South Korea Low Fat and Low Carb Foods Revenue (USD Million) By Country (2021-2032)
Figure 16. Australia Low Fat and Low Carb Foods Revenue (USD Million) By Country (2021-2032)
Figure 17. South East Asia Low Fat and Low Carb Foods Revenue (USD Million) By Country (2021-2032)
Figure 18. South America Low Fat and Low Carb Foods Revenue (USD Million) By Country (2021-2032)
Figure 19. Brazil Low Fat and Low Carb Foods Revenue (USD Million) By Country (2021-2032)
Figure 20. Argentina Low Fat and Low Carb Foods Revenue (USD Million) By Country (2021-2032)
Figure 21. Rest of Asia Pacific Low Fat and Low Carb Foods Revenue (USD Million) By Country (2021-2032)
Figure 22. Middle East and Africa Low Fat and Low Carb Foods Revenue (USD Million) By Region (2021-2032)
Figure 23. Saudi Arabia Low Fat and Low Carb Foods Revenue (USD Million) By Region (2021-2032)
Figure 24. The UAE Low Fat and Low Carb Foods Revenue (USD Million) By Region (2021-2032)
Figure 25. Rest of Middle East Low Fat and Low Carb Foods Revenue (USD Million) By Region (2021-2032)
Figure 26. South Africa Low Fat and Low Carb Foods Revenue (USD Million) By Region (2021-2032)
Figure 27. Africa Low Fat and Low Carb Foods Revenue (USD Million) By Region (2021-2032)
Figure 28. North America Low Fat and Low Carb Foods Revenue (USD Million) By Type (2021-2032)
Figure 29. North America Low Fat and Low Carb Foods Revenue (USD Million) By Application (2021-2032)
Figure 30. North America Low Fat and Low Carb Foods Revenue (USD Million) By Product (2021-2032)
Figure 31. Europe Low Fat and Low Carb Foods Revenue (USD Million) By Type (2021-2032)
Figure 32. Europe Low Fat and Low Carb Foods Revenue (USD Million) By Application (2021-2032)
Figure 33. Europe Low Fat and Low Carb Foods Revenue (USD Million) By Product (2021-2032)
Figure 34. Asia Pacific Low Fat and Low Carb Foods Revenue (USD Million) By Type (2021-2032)
Figure 35. Asia Pacific Low Fat and Low Carb Foods Revenue (USD Million) By Application (2021-2032)
Figure 36. Asia Pacific Low Fat and Low Carb Foods Revenue (USD Million) By Product (2021-2032)
Figure 37. South America Low Fat and Low Carb Foods Revenue (USD Million) By Type (2021-2032)
Figure 38. South America Low Fat and Low Carb Foods Revenue (USD Million) By Application (2021-2032)
Figure 39. South America Low Fat and Low Carb Foods Revenue (USD Million) By Product (2021-2032)
Figure 40. Middle East and Africa Low Fat and Low Carb Foods Revenue (USD Million) By Type (2021-2032)
Figure 41. Middle East and Africa Low Fat and Low Carb Foods Revenue (USD Million) By Application (2021-2032)
Figure 42. Middle East and Africa Low Fat and Low Carb Foods Revenue (USD Million) By Product (2021-2032)
By Form
Granules
Liquids
Powders
Sliced
Whole
Bars
Others
By Flavor
Unflavored
Flavored
-Chocolate
-Vanilla
-Orange
-Cherry
-Grape
-Berry
-Apple
-Mint
-Coconut
-Citrus
-Caramel
-Others
By Distribution Channel
Supermarkets/Hypermarkets
convenient Stores
Grocery Stores
Online Stores
Others
Countries Analyzed
North America (US, Canada, Mexico)
Europe (Germany, UK, France, Spain, Italy, Russia, Rest of Europe)
Asia Pacific (China, India, Japan, South Korea, Australia, South East Asia, Rest of Asia)
South America (Brazil, Argentina, Rest of South America)
Middle East and Africa (Saudi Arabia, UAE, Rest of Middle East, South Africa, Egypt, Rest of Africa)
