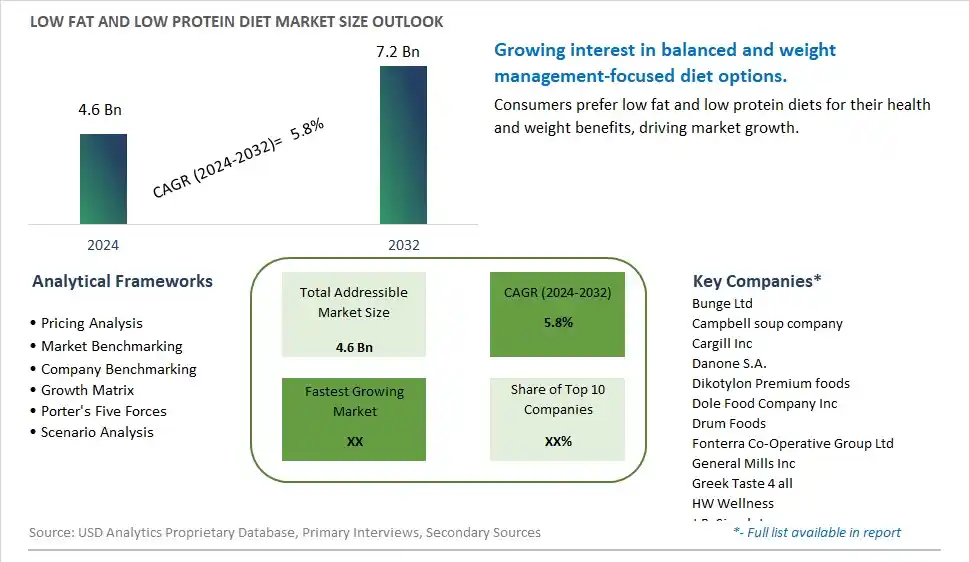
Global Low Fat and Low Protein Diet Market Size is valued at $4.6 Billion in 2024 and is forecast to register a growth rate (CAGR) of 5.8% to reach $7.2 Billion by 2032.
The global Low Fat and Low Protein Diet Market Comprehensive Study analyzes and forecasts the market size across 6 regions and 24 countries for diverse segments -By Source (Plant-based, -Soy protein, -Pea protein, -Almond milk, -Oat milk, Animal-based, -Lean Chicken, -Lean fish, -Lean Pork and Beef), By Type (Protein Sources, Fruits and Vegetables, Bread and Grains, Sweets, Canned Foods, Dairy Products, Condiments), By Special Diet Needs (Vegan, Paleo, Keto, Organic), By Application (Food and Beverages Industry, -Bakery and Confectionery, -Snacks, -Others, Household Industry), By Distribution Channel (Supermarkets/ Hypermarkets, Convenience Stores, Specialty Stores, Online Retail, Others)
An Introduction to Low Fat and Low Protein Diet Market
The low fat and low protein diet market in 2024 is growing steadily, driven by specific dietary needs such as managing kidney health and certain metabolic disorders. These products, which include specially formulated foods and beverages, cater to individuals requiring restricted protein and fat intake. The market benefits from ongoing research into diet-disease relationships and innovations in food formulations that ensure nutritional adequacy and palatability. The trend towards personalized nutrition and the increasing prevalence of chronic health conditions are supporting demand for low fat and low protein diet options.
Low fat and Low Protein Diet Competitive Landscape
The market report analyses the leading companies in the industry including Bunge Ltd, Campbell soup company, Cargill Inc, Danone S.A., Dikotylon Premium foods, Dole Food Company Inc, Drum Foods, Fonterra Co-Operative Group Ltd, General Mills Inc, Greek Taste 4 all, HW Wellness, J.R. Simplot, Kerry Group PLC, L T Foods, Medifast Inc, Mondelez International Inc, Nestlé SA, Sun-Maid Bel Brands, The Archer-Daniels-Midland Company, The Kraft Heinz Company, Wellversed health, and Others.
Low fat and Low Protein Diet Market Dynamics
Low Fat and Low Protein Diet Market Trend: Rising Demand for Specialized Dietary Solutions
The most prominent trend in the Low Fat and Low Protein Diet Market is the rising demand for specialized dietary solutions. Consumers with specific health conditions, such as kidney disease, are seeking diets that help manage their symptoms and improve their overall health. This trend is driven by the growing need for personalized nutrition plans that cater to individual health requirements.
Low Fat and Low Protein Diet Market Driver: Health Conditions Requiring Dietary Management
A key driver in the Low Fat and Low Protein Diet Market is the prevalence of health conditions that require dietary management. As more individuals are diagnosed with conditions such as chronic kidney disease and metabolic disorders, there is a rising demand for diets that help manage these conditions. Low fat and low protein diets, which support specific health needs, cater to this demand and support market growth.
Low Fat and Low Protein Diet Market Opportunity: Development of Medical Nutrition Products
One significant opportunity in the Low Fat and Low Protein Diet Market lies in the development of medical nutrition products. Companies can innovate by creating foods and supplements that are specifically designed to meet the dietary needs of individuals with health conditions. By offering convenient and nutritionally balanced options, manufacturers can attract health-conscious consumers and drive market growth.
Low fat and Low Protein Diet Market Share Analysis: Plant-based segment generated the highest revenue share in the industry
The largest segment in the Low Fat and Low Protein Diet Market by source is the Plant-based segment. Plant-based sources, including soy protein, pea protein, almond milk, and oat milk, have gained substantial popularity due to their health benefits and alignment with modern dietary preferences. Consumers are increasingly seeking plant-based options to reduce their intake of animal products, driven by health, ethical, and environmental considerations. Soy and pea proteins are valued for their high-quality protein content and versatility in various food products, while almond and oat milk serve as popular dairy alternatives. The growing trend towards plant-based diets and the widespread availability of these products in supermarkets, specialty stores, and online platforms contribute to their dominance in the market. The combination of nutritional benefits, environmental sustainability, and consumer demand ensures that plant-based sources remain the largest segment in the low fat and low protein diet market.
Low fat and Low Protein Diet Market Share Analysis: Fruits and Vegetables is the fastest growing segment over the forecast period to 2032
The fastest-growing segment in the Low Fat and Low Protein Diet Market by type is the Fruits and Vegetables segment. This segment is experiencing rapid growth due to the increasing emphasis on whole, natural foods as part of a healthy diet. Fruits and vegetables are naturally low in fat and protein, making them ideal components of a low fat and low protein diet. The rise of plant-based and clean eating trends has propelled the demand for fresh produce, which is rich in essential vitamins, minerals, and antioxidants. Consumers are becoming more health-conscious and are prioritizing diets rich in fruits and vegetables to reduce the risk of chronic diseases and promote overall well-being. The convenience of accessing fresh produce through farmers' markets, supermarkets, and online grocery delivery services has also contributed to the growth of this segment. As the focus on health and nutrition continues to intensify, the fruits and vegetables segment is expected to witness substantial growth leading up to 2032.
Low fat and Low Protein Diet Market Share Analysis: Vegan segment generated the highest revenue share in the industry
The largest segment in the Low Fat and Low Protein Diet Market by special diet needs is the Vegan segment. The vegan diet, which excludes all animal products, has gained significant traction due to growing awareness of its health, ethical, and environmental benefits. Vegan diets are naturally low in fat and protein, relying heavily on plant-based foods such as fruits, vegetables, grains, legumes, nuts, and seeds. The increasing availability of vegan products, including meat and dairy alternatives, has made it easier for consumers to adopt and maintain a vegan lifestyle. The rise of veganism is also supported by a growing body of research highlighting the health benefits of plant-based diets, including reduced risk of chronic diseases and improved weight management. The strong demand for vegan products and the continuous innovation in this category ensure that the vegan segment remains the largest in the low fat and low protein diet market by special diet needs.
Low fat and Low Protein Diet Market Share Analysis: Snacks (Food and Beverages Industry) is the fastest growing segment over the forecast period to 2032
The fastest-growing segment in the Low Fat and Low Protein Diet Market by application is the Snacks segment within the Food and Beverages Industry. The demand for low fat and low protein snacks is driven by the growing trend of healthy snacking, as consumers seek convenient and nutritious options to support their dietary goals. Snack products such as vegetable chips, fruit snacks, rice cakes, and low-calorie granola bars are gaining popularity among health-conscious consumers. The food industry has responded with a variety of innovative snack options that cater to the demand for low fat and low protein content, often incorporating plant-based ingredients and natural flavors. The convenience of snack products and their availability in supermarkets, convenience stores, and online retail channels contribute to their rapid growth. As consumers continue to prioritize health and wellness, the snacks segment within the food and beverages industry is expected to experience substantial growth, making it the fastest-growing application in the low fat and low protein diet market leading up to 2032.
Low fat and Low Protein Diet Market Segmentation
By Source
Plant-based
-Soy protein
-Pea protein
-Almond milk
-Oat milk
Animal-based
-Lean Chicken
-Lean fish
-Lean Pork and Beef
By Type
Protein Sources
Fruits and Vegetables
Bread and Grains
Sweets
Canned Foods
Dairy Products
Condiments
By Special Diet Needs
Vegan
Paleo
Keto
Organic
By Application
Food and Beverages Industry
-Bakery and Confectionery
-Snacks
-Others
Household Industry
By Distribution Channel
Supermarkets/ Hypermarkets
Convenience Stores
Specialty Stores
Online Retail
Others
Countries Analyzed
North America (US, Canada, Mexico)
Europe (Germany, UK, France, Spain, Italy, Russia, Rest of Europe)
Asia Pacific (China, India, Japan, South Korea, Australia, South East Asia, Rest of Asia)
South America (Brazil, Argentina, Rest of South America)
Middle East and Africa (Saudi Arabia, UAE, Rest of Middle East, South Africa, Egypt, Rest of Africa)
Low fat and Low Protein Diet Companies Profiled in the Study
Bunge Ltd
Campbell soup company
Cargill Inc
Danone S.A.
Dikotylon Premium foods
Dole Food Company Inc
Drum Foods
Fonterra Co-Operative Group Ltd
General Mills Inc
Greek Taste 4 all
HW Wellness
J.R. Simplot
Kerry Group PLC
L T Foods
Medifast Inc
Mondelez International Inc
Nestlé SA
Sun-Maid Bel Brands
The Archer-Daniels-Midland Company
The Kraft Heinz Company
Wellversed health
*- List Not Exhaustive
Chapter 1. TABLE OF CONTENTS
Chapter 2. Introduction to Low fat and Low Protein Diet Market
2.1. Market Overview
2.2. Key Statistics and Report Highlights
2.3. Scope of the Comprehensive Study
2.3.1. Market Definition
2.3.2 Countries and Regions Covered
2.3.3 Research Objective
2.3.4 Units, Currency, and Conversions
2.3.5 Industry Value Chain
2.4. Key Market Segments
2.5. Key Companies
2.6. Study Period
Chapter 3. Strategic Analysis Review
3.1. Low fat and Low Protein Diet Pricing Analysis and Forecast
3.2. Porter’s Five Forces
3.3. Market Ecosystem
3.4. SWOT Analysis
3.5. Regulatory Scenario
3.3. Effects of Inflation, Russia-Ukraine War, moderating economic growth, and other macroeconomic factors
Chapter 4. Competitive Landscape
4.1. Market Share Analysis
4.1.1. Global Low fat and Low Protein Diet Market Share by Company, 2023
4.1.2. Product Offerings of Leading Low fat and Low Protein Diet Companies
4.2. Market Entropy
4.2.1. New Product Launches in the Industry
4.2.2. Mergers, Acquisitions, Joint ventures, and Partnerships
4.3. Key Strategies and Best Practices
Chapter 5. Global Market Projections: Best, Reference, and Low Case Scenarios
5.1. Growth Analysis- Case Scenario Definitions
5.2. Low Growth Case Scenario Forecasts
5.3. Reference Growth Case Scenario Forecasts
5.4. High Growth Case Scenario Forecasts
Chapter 6. Market Dynamics
6.1. Low fat and Low Protein Diet Market Drivers
6.2. Low fat and Low Protein Diet Market Challenges
6.6. Low fat and Low Protein Diet Market Opportunities
6.4. Low fat and Low Protein Diet Market Trends
Chapter 7. Global Low fat and Low Protein Diet Market Outlook Trends
7.1. Global Low fat and Low Protein Diet Revenue (USD Million) and CAGR (%) by Type (2021-2032)
7.2. Global Low fat and Low Protein Diet Revenue (USD Million) and CAGR (%) by Application (2021-2032)
7.3. Global Low fat and Low Protein Diet Revenue (USD Million) and CAGR (%) by Product (2021-2032)
By Source
Plant-based
-Soy protein
-Pea protein
-Almond milk
-Oat milk
Animal-based
-Lean Chicken
-Lean fish
-Lean Pork and Beef
By Type
Protein Sources
Fruits and Vegetables
Bread and Grains
Sweets
Canned Foods
Dairy Products
Condiments
By Special Diet Needs
Vegan
Paleo
Keto
Organic
By Application
Food and Beverages Industry
-Bakery and Confectionery
-Snacks
-Others
Household Industry
By Distribution Channel
Supermarkets/ Hypermarkets
Convenience Stores
Specialty Stores
Online Retail
Others
Chapter 8. Global Low fat and Low Protein Diet Regional Analysis and Outlook
8.1. Global Low fat and Low Protein Diet Revenue (USD Million) By Regions (2021- 2032)
8.2. North America Low fat and Low Protein Diet Revenue (USD Million) by Country (2021-2032)
8.2.1. United States Low fat and Low Protein Diet Regional Analysis and Outlook
8.2.2. Canada Low fat and Low Protein Diet Regional Analysis and Outlook
8.2.3. Mexico Low fat and Low Protein Diet Regional Analysis and Outlook
8.3. Europe Low fat and Low Protein Diet Revenue (USD Million), by Country (2021-2032)
8.3.1. Germany Low fat and Low Protein Diet Regional Analysis and Outlook
8.3.2. France Low fat and Low Protein Diet Regional Analysis and Outlook
8.3.3. United Kingdom Low fat and Low Protein Diet Regional Analysis and Outlook
8.3.4. Spain Low fat and Low Protein Diet Regional Analysis and Outlook
8.3.5. Italy Low fat and Low Protein Diet Regional Analysis and Outlook
8.3.6. Russia Low fat and Low Protein Diet Regional Analysis and Outlook
8.3.7. Rest of Europe Low fat and Low Protein Diet Regional Analysis and Outlook
8.4. Asia Pacific Low fat and Low Protein Diet Revenue (USD Million) by Country (2021-2032)
8.4.1. China Low fat and Low Protein Diet Regional Analysis and Outlook
8.4.2. Japan Low fat and Low Protein Diet Regional Analysis and Outlook
8.4.3. India Low fat and Low Protein Diet Regional Analysis and Outlook
8.4.4. South Korea Low fat and Low Protein Diet Regional Analysis and Outlook
8.4.5. Australia Low fat and Low Protein Diet Regional Analysis and Outlook
8.4.6. South East Asia Low fat and Low Protein Diet Regional Analysis and Outlook
8.4.7. Rest of Asia Pacific Low fat and Low Protein Diet Regional Analysis and Outlook
8.5. South America Low fat and Low Protein Diet Revenue (USD Million), by Country (2021-2032)
8.5.1. Brazil Low fat and Low Protein Diet Regional Analysis and Outlook
8.5.2. Argentina Low fat and Low Protein Diet Regional Analysis and Outlook
8.5.3. Rest of South America Low fat and Low Protein Diet Regional Analysis and Outlook
8.6. Middle East and Africa Low fat and Low Protein Diet Revenue (USD Million) by Country (2021-2032)
8.6.1. Middle East Low fat and Low Protein Diet Regional Analysis and Outlook
8.6.2. Africa Low fat and Low Protein Diet Regional Analysis and Outlook
Chapter 9. North America Low fat and Low Protein Diet Analysis and Outlook
9.1. North America Low fat and Low Protein Diet Revenue (USD Million) by Segments (2021-2032)
9.1.1. North America Low fat and Low Protein Diet Revenue (USD Million) by Type (2021-2032)
9.1.2. North America Low fat and Low Protein Diet Revenue (USD Million) by Application (2021-2032)
9.1.3. North America Low fat and Low Protein Diet Revenue (USD Million) by Product (2021-2032)
By Source
Plant-based
-Soy protein
-Pea protein
-Almond milk
-Oat milk
Animal-based
-Lean Chicken
-Lean fish
-Lean Pork and Beef
By Type
Protein Sources
Fruits and Vegetables
Bread and Grains
Sweets
Canned Foods
Dairy Products
Condiments
By Special Diet Needs
Vegan
Paleo
Keto
Organic
By Application
Food and Beverages Industry
-Bakery and Confectionery
-Snacks
-Others
Household Industry
By Distribution Channel
Supermarkets/ Hypermarkets
Convenience Stores
Specialty Stores
Online Retail
Others
Chapter 10. Europe Low fat and Low Protein Diet Analysis and Outlook
10.1. Europe Low fat and Low Protein Diet Revenue (USD Million), by Segments (USD Million) (2021-2032)
10.1.1. Europe Low fat and Low Protein Diet Revenue (USD Million) by Type (2021-2032)
10.1.2. Europe Low fat and Low Protein Diet Revenue (USD Million) by Application (2021-2032)
10.1.3. Europe Low fat and Low Protein Diet Revenue (USD Million) by Product (2021-2032)
By Source
Plant-based
-Soy protein
-Pea protein
-Almond milk
-Oat milk
Animal-based
-Lean Chicken
-Lean fish
-Lean Pork and Beef
By Type
Protein Sources
Fruits and Vegetables
Bread and Grains
Sweets
Canned Foods
Dairy Products
Condiments
By Special Diet Needs
Vegan
Paleo
Keto
Organic
By Application
Food and Beverages Industry
-Bakery and Confectionery
-Snacks
-Others
Household Industry
By Distribution Channel
Supermarkets/ Hypermarkets
Convenience Stores
Specialty Stores
Online Retail
Others
Chapter 11. Asia Pacific Low fat and Low Protein Diet Analysis and Outlook
11.1. Asia Pacific Low fat and Low Protein Diet Revenue (USD Million), and Revenue (USD Million) by Segments (2021-2032)
11.1.1. Asia Pacific Low fat and Low Protein Diet Revenue (USD Million) by Type (2021-2032)
11.1.2. Asia Pacific Low fat and Low Protein Diet Revenue (USD Million) by Application (2021-2032)
11.1.3. Asia Pacific Low fat and Low Protein Diet Revenue (USD Million) by Product (2021-2032)
By Source
Plant-based
-Soy protein
-Pea protein
-Almond milk
-Oat milk
Animal-based
-Lean Chicken
-Lean fish
-Lean Pork and Beef
By Type
Protein Sources
Fruits and Vegetables
Bread and Grains
Sweets
Canned Foods
Dairy Products
Condiments
By Special Diet Needs
Vegan
Paleo
Keto
Organic
By Application
Food and Beverages Industry
-Bakery and Confectionery
-Snacks
-Others
Household Industry
By Distribution Channel
Supermarkets/ Hypermarkets
Convenience Stores
Specialty Stores
Online Retail
Others
Chapter 12. South America Low fat and Low Protein Diet Analysis and Outlook
12.1. South America Low fat and Low Protein Diet Revenue (USD Million), by Segments (2021-2032)
12.1.1. South America Low fat and Low Protein Diet Revenue (USD Million) by Type (2021-2032)
12.1.2. South America Low fat and Low Protein Diet Revenue (USD Million) by Application (2021-2032)
12.1.3. South America Low fat and Low Protein Diet Revenue (USD Million) by Product (2021-2032)
By Source
Plant-based
-Soy protein
-Pea protein
-Almond milk
-Oat milk
Animal-based
-Lean Chicken
-Lean fish
-Lean Pork and Beef
By Type
Protein Sources
Fruits and Vegetables
Bread and Grains
Sweets
Canned Foods
Dairy Products
Condiments
By Special Diet Needs
Vegan
Paleo
Keto
Organic
By Application
Food and Beverages Industry
-Bakery and Confectionery
-Snacks
-Others
Household Industry
By Distribution Channel
Supermarkets/ Hypermarkets
Convenience Stores
Specialty Stores
Online Retail
Others
Chapter 13. Middle East and Africa Low fat and Low Protein Diet Analysis and Outlook
13.1. Middle East and Africa Low fat and Low Protein Diet Revenue (USD Million), by Segments (2021-2032)
13.1.1. Middle East and Africa Low fat and Low Protein Diet Revenue (USD Million) by Type (2021-2032)
13.1.2. Middle East and Africa Low fat and Low Protein Diet Revenue (USD Million) by Application (2021-2032)
13.1.3. Middle East and Africa Low fat and Low Protein Diet Revenue (USD Million) by Product (2021-2032)
By Source
Plant-based
-Soy protein
-Pea protein
-Almond milk
-Oat milk
Animal-based
-Lean Chicken
-Lean fish
-Lean Pork and Beef
By Type
Protein Sources
Fruits and Vegetables
Bread and Grains
Sweets
Canned Foods
Dairy Products
Condiments
By Special Diet Needs
Vegan
Paleo
Keto
Organic
By Application
Food and Beverages Industry
-Bakery and Confectionery
-Snacks
-Others
Household Industry
By Distribution Channel
Supermarkets/ Hypermarkets
Convenience Stores
Specialty Stores
Online Retail
Others
Chapter 14. Low fat and Low Protein Diet Company Profiles
14.1 Business Overview
14.2 Product Profiles
14.3 SWOT Profiles
14.5 Recent Developments
14.6 Financial Profile
List of Companies
Bunge Ltd
Campbell soup company
Cargill Inc
Danone S.A.
Dikotylon Premium foods
Dole Food Company Inc
Drum Foods
Fonterra Co-Operative Group Ltd
General Mills Inc
Greek Taste 4 all
HW Wellness
J.R. Simplot
Kerry Group PLC
L T Foods
Medifast Inc
Mondelez International Inc
Nestlé SA
Sun-Maid Bel Brands
The Archer-Daniels-Midland Company
The Kraft Heinz Company
Wellversed health
15. Methodology and Data Sources
15.1 Customization Offerings
15.2 Subscription Services
15.3 Related Reports
15.4 Publisher Expertise
LIST OF TABLES
Table 1 Market Segmentation Analysis
Table 2 Global Low fat and Low Protein Diet Market Share of Leading Companies, 2023
Table 3 Product Offerings of Leading Companies
Table 4 Low Growth Scenario Forecasts
Table 5 Reference Case Growth Scenario
Table 6 High Growth Case Scenario
Table 7 Global Low fat and Low Protein Diet Revenue (USD Million) And CAGR (%) By Type (2021-2032)
Table 8 Global Low fat and Low Protein Diet Revenue (USD Million) And CAGR (%) By Application (2021-2032)
Table 9 Global Low fat and Low Protein Diet Revenue (USD Million) And CAGR (%) By Product (2021-2032)
Table 10 Global Low fat and Low Protein Diet Market Revenue (USD Million) By Regions (2021-2032)
Table 11 Global Low fat and Low Protein Diet Market Share (%) By Regions (2021-2032)
Table 12 North America Low fat and Low Protein Diet Revenue (USD Million) By Country (2021-2032)
Table 13 Europe Low fat and Low Protein Diet Revenue (USD Million) By Country (2021-2032)
Table 14 Asia Pacific Low fat and Low Protein Diet Revenue (USD Million) By Country (2021-2032)
Table 15 South America Low fat and Low Protein Diet Revenue (USD Million) By Country (2021-2032)
Table 16 Middle East and Africa Low fat and Low Protein Diet Revenue (USD Million) By Region (2021-2032)
Table 17 North America Low fat and Low Protein Diet Revenue (USD Million) By Type (2021-2032)
Table 18 North America Low fat and Low Protein Diet Revenue (USD Million) By Application (2021-2032)
Table 19 North America Low fat and Low Protein Diet Revenue (USD Million) By Product (2021-2032)
Table 20 Europe Low fat and Low Protein Diet Revenue (USD Million) By Type (2021-2032)
Table 21 Europe Low fat and Low Protein Diet Revenue (USD Million) By Application (2021-2032)
Table 22 Europe Low fat and Low Protein Diet Revenue (USD Million) By Product (2021-2032)
Table 23 Asia Pacific Low fat and Low Protein Diet Revenue (USD Million) By Type (2021-2032)
Table 24 Asia Pacific Low fat and Low Protein Diet Revenue (USD Million) By Application (2021-2032)
Table 25 Asia Pacific Low fat and Low Protein Diet Revenue (USD Million) By Product (2021-2032)
Table 26 South America Low fat and Low Protein Diet Revenue (USD Million) By Type (2021-2032)
Table 27 South America Low fat and Low Protein Diet Revenue (USD Million) By Application (2021-2032)
Table 28 South America Low fat and Low Protein Diet Revenue (USD Million) By Product (2021-2032)
Table 29 Middle East and Africa Low fat and Low Protein Diet Revenue (USD Million) By Type (2021-2032)
Table 30 Middle East and Africa Low fat and Low Protein Diet Revenue (USD Million) By Application (2021-2032)
Table 31 Middle East and Africa Low fat and Low Protein Diet Revenue (USD Million) By Product (2021-2032)
LIST OF FIGURES
Figure 1. Market Scope
Figure 2. Pricing Forecasts Per Unit, 2023- 2032
Figure 3. Porter’s Five Forces
Figure 4. Global Low fat and Low Protein Diet Market Revenue (USD Million) By Regions (2021-2032)
Figure 5. Global Low fat and Low Protein Diet Market Share (%) By Regions (2023)
Figure 6. North America Low fat and Low Protein Diet Revenue (USD Million) By Country (2021-2032)
Figure 7. United States Low fat and Low Protein Diet Revenue (USD Million) By Country (2021-2032)
Figure 8. Canada Low fat and Low Protein Diet Revenue (USD Million) By Country (2021-2032)
Figure 9. Mexico Low fat and Low Protein Diet Revenue (USD Million) By Country (2021-2032)
Figure 10. Europe Low fat and Low Protein Diet Revenue (USD Million) By Country (2021-2032)
Figure 11. Germany Low fat and Low Protein Diet Revenue (USD Million) By Country (2021-2032)
Figure 12. France Low fat and Low Protein Diet Revenue (USD Million) By Country (2021-2032)
Figure 13. United Kingdom Low fat and Low Protein Diet Revenue (USD Million) By Country (2021-2032)
Figure 14. Spain Low fat and Low Protein Diet Revenue (USD Million) By Country (2021-2032)
Figure 15. Italy Low fat and Low Protein Diet Revenue (USD Million) By Country (2021-2032)
Figure 16. Russia Low fat and Low Protein Diet Revenue (USD Million) By Country (2021-2032)
Figure 17. Rest of Europe Low fat and Low Protein Diet Revenue (USD Million) By Country (2021-2032)
Figure 11. Asia Pacific Low fat and Low Protein Diet Revenue (USD Million) By Country (2021-2032)
Figure 12. China Low fat and Low Protein Diet Revenue (USD Million) By Country (2021-2032)
Figure 13. Japan Low fat and Low Protein Diet Revenue (USD Million) By Country (2021-2032)
Figure 14. India Low fat and Low Protein Diet Revenue (USD Million) By Country (2021-2032)
Figure 15. South Korea Low fat and Low Protein Diet Revenue (USD Million) By Country (2021-2032)
Figure 16. Australia Low fat and Low Protein Diet Revenue (USD Million) By Country (2021-2032)
Figure 17. South East Asia Low fat and Low Protein Diet Revenue (USD Million) By Country (2021-2032)
Figure 18. South America Low fat and Low Protein Diet Revenue (USD Million) By Country (2021-2032)
Figure 19. Brazil Low fat and Low Protein Diet Revenue (USD Million) By Country (2021-2032)
Figure 20. Argentina Low fat and Low Protein Diet Revenue (USD Million) By Country (2021-2032)
Figure 21. Rest of Asia Pacific Low fat and Low Protein Diet Revenue (USD Million) By Country (2021-2032)
Figure 22. Middle East and Africa Low fat and Low Protein Diet Revenue (USD Million) By Region (2021-2032)
Figure 23. Saudi Arabia Low fat and Low Protein Diet Revenue (USD Million) By Region (2021-2032)
Figure 24. The UAE Low fat and Low Protein Diet Revenue (USD Million) By Region (2021-2032)
Figure 25. Rest of Middle East Low fat and Low Protein Diet Revenue (USD Million) By Region (2021-2032)
Figure 26. South Africa Low fat and Low Protein Diet Revenue (USD Million) By Region (2021-2032)
Figure 27. Africa Low fat and Low Protein Diet Revenue (USD Million) By Region (2021-2032)
Figure 28. North America Low fat and Low Protein Diet Revenue (USD Million) By Type (2021-2032)
Figure 29. North America Low fat and Low Protein Diet Revenue (USD Million) By Application (2021-2032)
Figure 30. North America Low fat and Low Protein Diet Revenue (USD Million) By Product (2021-2032)
Figure 31. Europe Low fat and Low Protein Diet Revenue (USD Million) By Type (2021-2032)
Figure 32. Europe Low fat and Low Protein Diet Revenue (USD Million) By Application (2021-2032)
Figure 33. Europe Low fat and Low Protein Diet Revenue (USD Million) By Product (2021-2032)
Figure 34. Asia Pacific Low fat and Low Protein Diet Revenue (USD Million) By Type (2021-2032)
Figure 35. Asia Pacific Low fat and Low Protein Diet Revenue (USD Million) By Application (2021-2032)
Figure 36. Asia Pacific Low fat and Low Protein Diet Revenue (USD Million) By Product (2021-2032)
Figure 37. South America Low fat and Low Protein Diet Revenue (USD Million) By Type (2021-2032)
Figure 38. South America Low fat and Low Protein Diet Revenue (USD Million) By Application (2021-2032)
Figure 39. South America Low fat and Low Protein Diet Revenue (USD Million) By Product (2021-2032)
Figure 40. Middle East and Africa Low fat and Low Protein Diet Revenue (USD Million) By Type (2021-2032)
Figure 41. Middle East and Africa Low fat and Low Protein Diet Revenue (USD Million) By Application (2021-2032)
Figure 42. Middle East and Africa Low fat and Low Protein Diet Revenue (USD Million) By Product (2021-2032)
By Source
Plant-based
-Soy protein
-Pea protein
-Almond milk
-Oat milk
Animal-based
-Lean Chicken
-Lean fish
-Lean Pork and Beef
By Type
Protein Sources
Fruits and Vegetables
Bread and Grains
Sweets
Canned Foods
Dairy Products
Condiments
By Special Diet Needs
Vegan
Paleo
Keto
Organic
By Application
Food and Beverages Industry
-Bakery and Confectionery
-Snacks
-Others
Household Industry
By Distribution Channel
Supermarkets/ Hypermarkets
Convenience Stores
Specialty Stores
Online Retail
Others
Countries Analyzed
North America (US, Canada, Mexico)
Europe (Germany, UK, France, Spain, Italy, Russia, Rest of Europe)
Asia Pacific (China, India, Japan, South Korea, Australia, South East Asia, Rest of Asia)
South America (Brazil, Argentina, Rest of South America)
Middle East and Africa (Saudi Arabia, UAE, Rest of Middle East, South Africa, Egypt, Rest of Africa)
