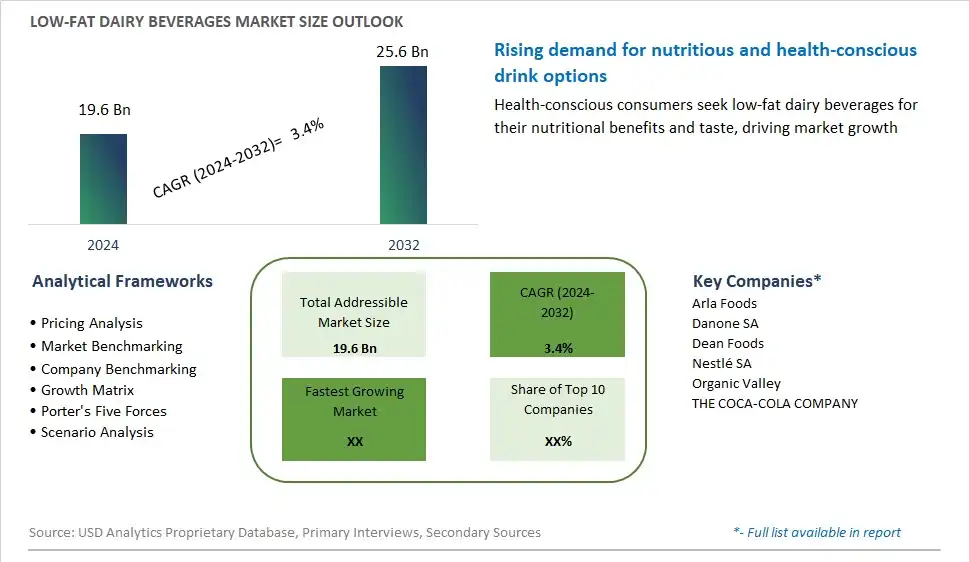
Global Low-fat Dairy Beverages Market Size is valued at $19.6 Billion in 2024 and is forecast to register a growth rate (CAGR) of 3.4% to reach $25.6 Billion by 2032.
The global Low-fat Dairy Beverages Market Comprehensive Study analyzes and forecasts the market size across 6 regions and 24 countries for diverse segments -By Product (Low Fat Milk, Low Fat Yogurt Drinks, Others), By Application (Supermarkets/ Hypermarkets, Convenience Store, Others)
An Introduction to Low-fat Dairy Beverages Market
In 2024, the market for low-fat dairy beverages reflects evolving consumer attitudes towards health, nutrition, and sustainability, driving demand for dairy products with reduced fat content and enhanced nutritional profiles. Low-fat dairy beverages, including milk, yogurt, and cheese, offer the same essential nutrients found in full-fat dairy products, such as calcium, protein, and vitamins, but with lower levels of saturated fat and calories. As consumers become increasingly health-conscious and mindful of their dietary choices, low-fat dairy beverages are gaining popularity as options that support weight management, heart health, and overall well-being. Moreover, the market is witnessing innovation in dairy alternatives, including plant-based options made from soy, almonds, oats, and other ingredients, catering to lactose intolerant individuals and those following vegan or dairy-free diets. With growing awareness of the environmental impact of dairy production, there is also a rising demand for sustainably sourced and ethically produced dairy products. In 2024, the low-fat dairy beverages market is expected to continue expanding as consumers prioritize health, taste, and sustainability in their food and beverage choices, driving demand for innovative products that deliver on all fronts.
Low fat Dairy Beverages Competitive Landscape
The market report analyses the leading companies in the industry including Arla Foods, Danone SA, Dean Foods, Nestlé SA, Organic Valley, THE COCA-COLA COMPANY, and Others.
Low fat Dairy Beverages Market Dynamics
Market Trend: Shift Towards Healthier Beverage Options
The most prominent trend in the Low-Fat Dairy Beverages Market is the shift towards healthier beverage options. As consumers become more health-conscious, there is an increasing demand for low-fat dairy beverages that offer the nutritional benefits of dairy without the added calories and fat. This trend is driven by the growing awareness of the health risks associated with high-fat diets and the desire to maintain a balanced and healthy lifestyle
Market Driver: Increasing Focus on Weight Management
The increasing focus on weight management is a major driver of the Low-Fat Dairy Beverages Market. Consumers are actively seeking low-fat dairy options to support their weight loss and maintenance goals. The perceived benefits of low-fat dairy beverages, such as reduced calorie intake and improved digestion, are driving their popularity among health-conscious individuals and those looking to manage their weight effectively
Market Opportunity: Development of Functional Beverages
A significant opportunity in the Low-Fat Dairy Beverages Market lies in the development of functional beverages. By incorporating additional health benefits, such as added vitamins, minerals, and probiotics, manufacturers can create low-fat dairy beverages that cater to specific health needs and preferences. This innovation can attract consumers looking for multifunctional products that provide both nutrition and wellness benefits, thereby expanding the market reach
Low-Fat Dairy Beverages Market Share Analysis: Product (Low Fat Milk, Low Fat Yogurt Drinks, Others)
The low-fat yogurt drinks segment is expected to be the fastest-growing in the Low-Fat Dairy Beverages Market by product to 2032. The demand for low-fat yogurt drinks is driven by the increasing awareness of the health benefits of yogurt, including its probiotic content and nutritional value. Low-fat yogurt drinks appeal to a wide range of consumers seeking convenient, nutritious, and low-calorie beverage options. Additionally, advancements in yogurt drink formulations and the development of high-quality, low-fat ingredients contribute to the segment's rapid growth. The expansion of product offerings and the increasing availability of low-fat yogurt drinks in various retail channels support the growth of this segment.
Low-Fat Dairy Beverages Market Share Analysis: Application (Supermarkets/ Hypermarkets, Convenience Store, Others)
The supermarkets/hypermarkets segment is anticipated to be the fastest-growing in the Low-Fat Dairy Beverages Market by application to 2032. The demand for low-fat dairy beverages in supermarkets and hypermarkets is driven by the convenience of one-stop shopping and the wide variety of product options available. Consumers prefer purchasing low-fat dairy beverages during their regular grocery shopping trips, benefiting from competitive pricing and promotional offers. Additionally, the expansion of the health and wellness aisles in supermarkets and hypermarkets contributes to the segment's rapid growth. The increasing focus on promoting healthy lifestyle choices and the availability of low-fat dairy beverages in various retail channels support the growth of this segment.
Low fat Dairy Beverages Market Segmentation
By Product
Low Fat Milk
Low Fat Yogurt Drinks
Others
By Application
Supermarkets/ Hypermarkets
Convenience Store
Others
Countries Analyzed
North America (US, Canada, Mexico)
Europe (Germany, UK, France, Spain, Italy, Russia, Rest of Europe)
Asia Pacific (China, India, Japan, South Korea, Australia, South East Asia, Rest of Asia)
South America (Brazil, Argentina, Rest of South America)
Middle East and Africa (Saudi Arabia, UAE, Rest of Middle East, South Africa, Egypt, Rest of Africa)
Low fat Dairy Beverages Companies Profiled in the Study
Arla Foods
Danone SA
Dean Foods
Nestlé SA
Organic Valley
THE COCA-COLA COMPANY
*- List Not Exhaustive
Chapter 1. TABLE OF CONTENTS
Chapter 2. Introduction to Low fat Dairy Beverages Market
2.1. Market Overview
2.2. Key Statistics and Report Highlights
2.3. Scope of the Comprehensive Study
2.3.1. Market Definition
2.3.2 Countries and Regions Covered
2.3.3 Research Objective
2.3.4 Units, Currency, and Conversions
2.3.5 Industry Value Chain
2.4. Key Market Segments
2.5. Key Companies
2.6. Study Period
Chapter 3. Strategic Analysis Review
3.1. Low fat Dairy Beverages Pricing Analysis and Forecast
3.2. Porter’s Five Forces
3.3. Market Ecosystem
3.4. SWOT Analysis
3.5. Regulatory Scenario
3.3. Effects of Inflation, Russia-Ukraine War, moderating economic growth, and other macroeconomic factors
Chapter 4. Competitive Landscape
4.1. Market Share Analysis
4.1.1. Global Low fat Dairy Beverages Market Share by Company, 2023
4.1.2. Product Offerings of Leading Low fat Dairy Beverages Companies
4.2. Market Entropy
4.2.1. New Product Launches in the Industry
4.2.2. Mergers, Acquisitions, Joint ventures, and Partnerships
4.3. Key Strategies and Best Practices
Chapter 5. Global Market Projections: Best, Reference, and Low Case Scenarios
5.1. Growth Analysis- Case Scenario Definitions
5.2. Low Growth Case Scenario Forecasts
5.3. Reference Growth Case Scenario Forecasts
5.4. High Growth Case Scenario Forecasts
Chapter 6. Market Dynamics
6.1. Low fat Dairy Beverages Market Drivers
6.2. Low fat Dairy Beverages Market Challenges
6.6. Low fat Dairy Beverages Market Opportunities
6.4. Low fat Dairy Beverages Market Trends
Chapter 7. Global Low fat Dairy Beverages Market Outlook Trends
7.1. Global Low fat Dairy Beverages Revenue (USD Million) and CAGR (%) by Type (2021-2032)
7.2. Global Low fat Dairy Beverages Revenue (USD Million) and CAGR (%) by Application (2021-2032)
7.3. Global Low fat Dairy Beverages Revenue (USD Million) and CAGR (%) by Product (2021-2032)
By Product
Low Fat Milk
Low Fat Yogurt Drinks
Others
By Application
Supermarkets/ Hypermarkets
Convenience Store
Others
Chapter 8. Global Low fat Dairy Beverages Regional Analysis and Outlook
8.1. Global Low fat Dairy Beverages Revenue (USD Million) By Regions (2021- 2032)
8.2. North America Low fat Dairy Beverages Revenue (USD Million) by Country (2021-2032)
8.2.1. United States Low fat Dairy Beverages Regional Analysis and Outlook
8.2.2. Canada Low fat Dairy Beverages Regional Analysis and Outlook
8.2.3. Mexico Low fat Dairy Beverages Regional Analysis and Outlook
8.3. Europe Low fat Dairy Beverages Revenue (USD Million), by Country (2021-2032)
8.3.1. Germany Low fat Dairy Beverages Regional Analysis and Outlook
8.3.2. France Low fat Dairy Beverages Regional Analysis and Outlook
8.3.3. United Kingdom Low fat Dairy Beverages Regional Analysis and Outlook
8.3.4. Spain Low fat Dairy Beverages Regional Analysis and Outlook
8.3.5. Italy Low fat Dairy Beverages Regional Analysis and Outlook
8.3.6. Russia Low fat Dairy Beverages Regional Analysis and Outlook
8.3.7. Rest of Europe Low fat Dairy Beverages Regional Analysis and Outlook
8.4. Asia Pacific Low fat Dairy Beverages Revenue (USD Million) by Country (2021-2032)
8.4.1. China Low fat Dairy Beverages Regional Analysis and Outlook
8.4.2. Japan Low fat Dairy Beverages Regional Analysis and Outlook
8.4.3. India Low fat Dairy Beverages Regional Analysis and Outlook
8.4.4. South Korea Low fat Dairy Beverages Regional Analysis and Outlook
8.4.5. Australia Low fat Dairy Beverages Regional Analysis and Outlook
8.4.6. South East Asia Low fat Dairy Beverages Regional Analysis and Outlook
8.4.7. Rest of Asia Pacific Low fat Dairy Beverages Regional Analysis and Outlook
8.5. South America Low fat Dairy Beverages Revenue (USD Million), by Country (2021-2032)
8.5.1. Brazil Low fat Dairy Beverages Regional Analysis and Outlook
8.5.2. Argentina Low fat Dairy Beverages Regional Analysis and Outlook
8.5.3. Rest of South America Low fat Dairy Beverages Regional Analysis and Outlook
8.6. Middle East and Africa Low fat Dairy Beverages Revenue (USD Million) by Country (2021-2032)
8.6.1. Middle East Low fat Dairy Beverages Regional Analysis and Outlook
8.6.2. Africa Low fat Dairy Beverages Regional Analysis and Outlook
Chapter 9. North America Low fat Dairy Beverages Analysis and Outlook
9.1. North America Low fat Dairy Beverages Revenue (USD Million) by Segments (2021-2032)
9.1.1. North America Low fat Dairy Beverages Revenue (USD Million) by Type (2021-2032)
9.1.2. North America Low fat Dairy Beverages Revenue (USD Million) by Application (2021-2032)
9.1.3. North America Low fat Dairy Beverages Revenue (USD Million) by Product (2021-2032)
By Product
Low Fat Milk
Low Fat Yogurt Drinks
Others
By Application
Supermarkets/ Hypermarkets
Convenience Store
Others
Chapter 10. Europe Low fat Dairy Beverages Analysis and Outlook
10.1. Europe Low fat Dairy Beverages Revenue (USD Million), by Segments (USD Million) (2021-2032)
10.1.1. Europe Low fat Dairy Beverages Revenue (USD Million) by Type (2021-2032)
10.1.2. Europe Low fat Dairy Beverages Revenue (USD Million) by Application (2021-2032)
10.1.3. Europe Low fat Dairy Beverages Revenue (USD Million) by Product (2021-2032)
By Product
Low Fat Milk
Low Fat Yogurt Drinks
Others
By Application
Supermarkets/ Hypermarkets
Convenience Store
Others
Chapter 11. Asia Pacific Low fat Dairy Beverages Analysis and Outlook
11.1. Asia Pacific Low fat Dairy Beverages Revenue (USD Million), and Revenue (USD Million) by Segments (2021-2032)
11.1.1. Asia Pacific Low fat Dairy Beverages Revenue (USD Million) by Type (2021-2032)
11.1.2. Asia Pacific Low fat Dairy Beverages Revenue (USD Million) by Application (2021-2032)
11.1.3. Asia Pacific Low fat Dairy Beverages Revenue (USD Million) by Product (2021-2032)
By Product
Low Fat Milk
Low Fat Yogurt Drinks
Others
By Application
Supermarkets/ Hypermarkets
Convenience Store
Others
Chapter 12. South America Low fat Dairy Beverages Analysis and Outlook
12.1. South America Low fat Dairy Beverages Revenue (USD Million), by Segments (2021-2032)
12.1.1. South America Low fat Dairy Beverages Revenue (USD Million) by Type (2021-2032)
12.1.2. South America Low fat Dairy Beverages Revenue (USD Million) by Application (2021-2032)
12.1.3. South America Low fat Dairy Beverages Revenue (USD Million) by Product (2021-2032)
By Product
Low Fat Milk
Low Fat Yogurt Drinks
Others
By Application
Supermarkets/ Hypermarkets
Convenience Store
Others
Chapter 13. Middle East and Africa Low fat Dairy Beverages Analysis and Outlook
13.1. Middle East and Africa Low fat Dairy Beverages Revenue (USD Million), by Segments (2021-2032)
13.1.1. Middle East and Africa Low fat Dairy Beverages Revenue (USD Million) by Type (2021-2032)
13.1.2. Middle East and Africa Low fat Dairy Beverages Revenue (USD Million) by Application (2021-2032)
13.1.3. Middle East and Africa Low fat Dairy Beverages Revenue (USD Million) by Product (2021-2032)
By Product
Low Fat Milk
Low Fat Yogurt Drinks
Others
By Application
Supermarkets/ Hypermarkets
Convenience Store
Others
Chapter 14. Low fat Dairy Beverages Company Profiles
14.1 Business Overview
14.2 Product Profiles
14.3 SWOT Profiles
14.5 Recent Developments
14.6 Financial Profile
List of Companies
Arla Foods
Danone SA
Dean Foods
Nestlé SA
Organic Valley
THE COCA-COLA COMPANY
15. Methodology and Data Sources
15.1 Customization Offerings
15.2 Subscription Services
15.3 Related Reports
15.4 Publisher Expertise
LIST OF TABLES
Table 1 Market Segmentation Analysis
Table 2 Global Low fat Dairy Beverages Market Share of Leading Companies, 2023
Table 3 Product Offerings of Leading Companies
Table 4 Low Growth Scenario Forecasts
Table 5 Reference Case Growth Scenario
Table 6 High Growth Case Scenario
Table 7 Global Low fat Dairy Beverages Revenue (USD Million) And CAGR (%) By Type (2021-2032)
Table 8 Global Low fat Dairy Beverages Revenue (USD Million) And CAGR (%) By Application (2021-2032)
Table 9 Global Low fat Dairy Beverages Revenue (USD Million) And CAGR (%) By Product (2021-2032)
Table 10 Global Low fat Dairy Beverages Market Revenue (USD Million) By Regions (2021-2032)
Table 11 Global Low fat Dairy Beverages Market Share (%) By Regions (2021-2032)
Table 12 North America Low fat Dairy Beverages Revenue (USD Million) By Country (2021-2032)
Table 13 Europe Low fat Dairy Beverages Revenue (USD Million) By Country (2021-2032)
Table 14 Asia Pacific Low fat Dairy Beverages Revenue (USD Million) By Country (2021-2032)
Table 15 South America Low fat Dairy Beverages Revenue (USD Million) By Country (2021-2032)
Table 16 Middle East and Africa Low fat Dairy Beverages Revenue (USD Million) By Region (2021-2032)
Table 17 North America Low fat Dairy Beverages Revenue (USD Million) By Type (2021-2032)
Table 18 North America Low fat Dairy Beverages Revenue (USD Million) By Application (2021-2032)
Table 19 North America Low fat Dairy Beverages Revenue (USD Million) By Product (2021-2032)
Table 20 Europe Low fat Dairy Beverages Revenue (USD Million) By Type (2021-2032)
Table 21 Europe Low fat Dairy Beverages Revenue (USD Million) By Application (2021-2032)
Table 22 Europe Low fat Dairy Beverages Revenue (USD Million) By Product (2021-2032)
Table 23 Asia Pacific Low fat Dairy Beverages Revenue (USD Million) By Type (2021-2032)
Table 24 Asia Pacific Low fat Dairy Beverages Revenue (USD Million) By Application (2021-2032)
Table 25 Asia Pacific Low fat Dairy Beverages Revenue (USD Million) By Product (2021-2032)
Table 26 South America Low fat Dairy Beverages Revenue (USD Million) By Type (2021-2032)
Table 27 South America Low fat Dairy Beverages Revenue (USD Million) By Application (2021-2032)
Table 28 South America Low fat Dairy Beverages Revenue (USD Million) By Product (2021-2032)
Table 29 Middle East and Africa Low fat Dairy Beverages Revenue (USD Million) By Type (2021-2032)
Table 30 Middle East and Africa Low fat Dairy Beverages Revenue (USD Million) By Application (2021-2032)
Table 31 Middle East and Africa Low fat Dairy Beverages Revenue (USD Million) By Product (2021-2032)
LIST OF FIGURES
Figure 1. Market Scope
Figure 2. Pricing Forecasts Per Unit, 2023- 2032
Figure 3. Porter’s Five Forces
Figure 4. Global Low fat Dairy Beverages Market Revenue (USD Million) By Regions (2021-2032)
Figure 5. Global Low fat Dairy Beverages Market Share (%) By Regions (2023)
Figure 6. North America Low fat Dairy Beverages Revenue (USD Million) By Country (2021-2032)
Figure 7. United States Low fat Dairy Beverages Revenue (USD Million) By Country (2021-2032)
Figure 8. Canada Low fat Dairy Beverages Revenue (USD Million) By Country (2021-2032)
Figure 9. Mexico Low fat Dairy Beverages Revenue (USD Million) By Country (2021-2032)
Figure 10. Europe Low fat Dairy Beverages Revenue (USD Million) By Country (2021-2032)
Figure 11. Germany Low fat Dairy Beverages Revenue (USD Million) By Country (2021-2032)
Figure 12. France Low fat Dairy Beverages Revenue (USD Million) By Country (2021-2032)
Figure 13. United Kingdom Low fat Dairy Beverages Revenue (USD Million) By Country (2021-2032)
Figure 14. Spain Low fat Dairy Beverages Revenue (USD Million) By Country (2021-2032)
Figure 15. Italy Low fat Dairy Beverages Revenue (USD Million) By Country (2021-2032)
Figure 16. Russia Low fat Dairy Beverages Revenue (USD Million) By Country (2021-2032)
Figure 17. Rest of Europe Low fat Dairy Beverages Revenue (USD Million) By Country (2021-2032)
Figure 11. Asia Pacific Low fat Dairy Beverages Revenue (USD Million) By Country (2021-2032)
Figure 12. China Low fat Dairy Beverages Revenue (USD Million) By Country (2021-2032)
Figure 13. Japan Low fat Dairy Beverages Revenue (USD Million) By Country (2021-2032)
Figure 14. India Low fat Dairy Beverages Revenue (USD Million) By Country (2021-2032)
Figure 15. South Korea Low fat Dairy Beverages Revenue (USD Million) By Country (2021-2032)
Figure 16. Australia Low fat Dairy Beverages Revenue (USD Million) By Country (2021-2032)
Figure 17. South East Asia Low fat Dairy Beverages Revenue (USD Million) By Country (2021-2032)
Figure 18. South America Low fat Dairy Beverages Revenue (USD Million) By Country (2021-2032)
Figure 19. Brazil Low fat Dairy Beverages Revenue (USD Million) By Country (2021-2032)
Figure 20. Argentina Low fat Dairy Beverages Revenue (USD Million) By Country (2021-2032)
Figure 21. Rest of Asia Pacific Low fat Dairy Beverages Revenue (USD Million) By Country (2021-2032)
Figure 22. Middle East and Africa Low fat Dairy Beverages Revenue (USD Million) By Region (2021-2032)
Figure 23. Saudi Arabia Low fat Dairy Beverages Revenue (USD Million) By Region (2021-2032)
Figure 24. The UAE Low fat Dairy Beverages Revenue (USD Million) By Region (2021-2032)
Figure 25. Rest of Middle East Low fat Dairy Beverages Revenue (USD Million) By Region (2021-2032)
Figure 26. South Africa Low fat Dairy Beverages Revenue (USD Million) By Region (2021-2032)
Figure 27. Africa Low fat Dairy Beverages Revenue (USD Million) By Region (2021-2032)
Figure 28. North America Low fat Dairy Beverages Revenue (USD Million) By Type (2021-2032)
Figure 29. North America Low fat Dairy Beverages Revenue (USD Million) By Application (2021-2032)
Figure 30. North America Low fat Dairy Beverages Revenue (USD Million) By Product (2021-2032)
Figure 31. Europe Low fat Dairy Beverages Revenue (USD Million) By Type (2021-2032)
Figure 32. Europe Low fat Dairy Beverages Revenue (USD Million) By Application (2021-2032)
Figure 33. Europe Low fat Dairy Beverages Revenue (USD Million) By Product (2021-2032)
Figure 34. Asia Pacific Low fat Dairy Beverages Revenue (USD Million) By Type (2021-2032)
Figure 35. Asia Pacific Low fat Dairy Beverages Revenue (USD Million) By Application (2021-2032)
Figure 36. Asia Pacific Low fat Dairy Beverages Revenue (USD Million) By Product (2021-2032)
Figure 37. South America Low fat Dairy Beverages Revenue (USD Million) By Type (2021-2032)
Figure 38. South America Low fat Dairy Beverages Revenue (USD Million) By Application (2021-2032)
Figure 39. South America Low fat Dairy Beverages Revenue (USD Million) By Product (2021-2032)
Figure 40. Middle East and Africa Low fat Dairy Beverages Revenue (USD Million) By Type (2021-2032)
Figure 41. Middle East and Africa Low fat Dairy Beverages Revenue (USD Million) By Application (2021-2032)
Figure 42. Middle East and Africa Low fat Dairy Beverages Revenue (USD Million) By Product (2021-2032)
By Product
Low Fat Milk
Low Fat Yogurt Drinks
Others
By Application
Supermarkets/ Hypermarkets
Convenience Store
Others
Countries Analyzed
North America (US, Canada, Mexico)
Europe (Germany, UK, France, Spain, Italy, Russia, Rest of Europe)
Asia Pacific (China, India, Japan, South Korea, Australia, South East Asia, Rest of Asia)
South America (Brazil, Argentina, Rest of South America)
Middle East and Africa (Saudi Arabia, UAE, Rest of Middle East, South Africa, Egypt, Rest of Africa)
