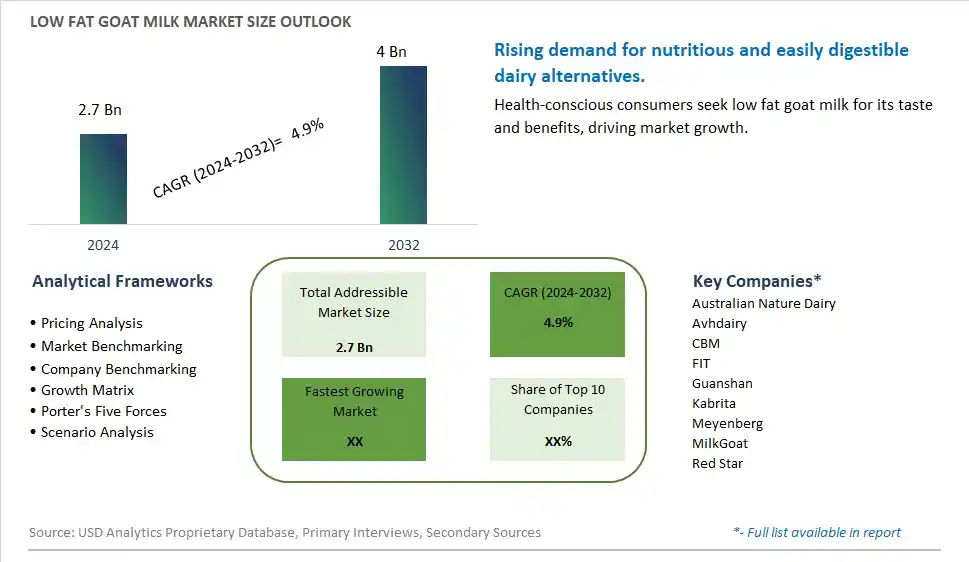
Global Low Fat Goat Milk Market Size is valued at $2.7 Billion in 2024 and is forecast to register a growth rate (CAGR) of 4.9% to reach $4 Billion by 2032.
The global Low Fat Goat Milk Market Comprehensive Study analyzes and forecasts the market size across 6 regions and 24 countries for diverse segments -By Product (Milk, Cheese, Milk Powder, Others), By Distribution Channel (Supermarkets/ Hypermarkets, Convenience Stores, Specialty Stores, Online Retail, Others)
An Introduction to Low Fat Goat Milk Market
In 2024, the low fat goat milk market is expanding, driven by the increasing demand for healthier dairy alternatives. Low fat goat milk offers the nutritional benefits of goat milk, including easier digestibility and a rich nutrient profile, with reduced fat content. The market benefits from advancements in dairy processing techniques that enhance product quality and taste. The trend towards clean label and natural ingredients is influencing product development. Increasing consumer awareness of digestive health and the popularity of goat milk for its hypoallergenic properties are further supporting market growth.
Low Fat Goat Milk Competitive Landscape
The market report analyses the leading companies in the industry including Australian Nature Dairy, Avhdairy, CBM, FIT, Guanshan, Kabrita, Meyenberg, MilkGoat, Red Star, and Others.
Low Fat Goat Milk Market Dynamics
Low Fat Goat Milk Market Trend: Growing Interest in Alternative Dairy Products
The most prominent trend in the Low Fat Goat Milk Market is the growing interest in alternative dairy products. Consumers are seeking dairy options that offer unique nutritional benefits and cater to specific dietary needs. This trend is driven by the increasing awareness of the health benefits of goat milk, such as its easier digestibility and lower allergenicity compared to cow's milk.
Low Fat Goat Milk Market Driver: Health Consciousness and Demand for Nutrient-Rich Foods
A key driver in the Low Fat Goat Milk Market is health consciousness and the demand for nutrient-rich foods. As more individuals focus on improving their diet and overall health, there is a growing preference for dairy products that provide essential nutrients without the high fat content. Low fat goat milk, which offers a balanced nutritional profile, caters to this demand and supports market growth.
Low Fat Goat Milk Market Opportunity: Expansion into Value-Added Dairy Products
One significant opportunity in the Low Fat Goat Milk Market lies in the expansion into value-added dairy products. Companies can innovate by creating new goat milk-based products, such as yogurt, cheese, and ice cream, that cater to health-conscious consumers. By offering diverse and nutritious options, manufacturers can attract a broader audience and drive market growth.
Low Fat Goat Milk Market Share Analysis: Milk segment generated the highest revenue share in the industry
The largest segment in the Low Fat Goat Milk Market by product is the Milk segment. Low fat goat milk has gained popularity due to its nutritional benefits and easier digestibility compared to cow's milk. Goat milk is rich in essential nutrients such as calcium, protein, and vitamins, but it is also lower in fat, making it an attractive option for health-conscious consumers. This segment dominates the market because of its versatility and wide application in daily diets. Consumers use low fat goat milk in beverages, cooking, and baking, making it a staple in many households. The growing awareness of lactose intolerance and the demand for dairy alternatives have further boosted the popularity of low fat goat milk. Its presence in supermarkets, specialty stores, and online platforms ensures easy accessibility, contributing to its dominance as the largest segment in the low fat goat milk market.
Low Fat Goat Milk Market Share Analysis: Online Retail is the fastest growing segment over the forecast period to 2032
The fastest-growing segment in the Low Fat Goat Milk Market by distribution channel is the Online Retail segment. The rise of e-commerce has revolutionized the way consumers shop for groceries, including dairy products like low fat goat milk. Online retail offers unmatched convenience, allowing consumers to browse and purchase a variety of low fat goat milk products from the comfort of their homes. This segment benefits from the ability to provide detailed product descriptions, customer reviews, and the option to compare different brands and prices easily. The Past few yearshas further accelerated the shift towards online shopping, as more consumers turned to digital platforms for their dairy needs. Online retailers often offer competitive pricing, subscription services, and promotional offers, making them an attractive option for cost-conscious shoppers. As digital infrastructure and logistics continue to improve, the online retail segment is expected to witness substantial growth, making it the fastest-growing distribution channel in the low fat goat milk market leading up to 2032.
Low Fat Goat Milk Market Segmentation
By Product
Milk
Cheese
Milk Powder
Others
By Distribution Channel
Supermarkets/ Hypermarkets
Convenience Stores
Specialty Stores
Online Retail
Others
Countries Analyzed
North America (US, Canada, Mexico)
Europe (Germany, UK, France, Spain, Italy, Russia, Rest of Europe)
Asia Pacific (China, India, Japan, South Korea, Australia, South East Asia, Rest of Asia)
South America (Brazil, Argentina, Rest of South America)
Middle East and Africa (Saudi Arabia, UAE, Rest of Middle East, South Africa, Egypt, Rest of Africa)
Low Fat Goat Milk Companies Profiled in the Study
Australian Nature Dairy
Avhdairy
CBM
FIT
Guanshan
Kabrita
Meyenberg
MilkGoat
Red Star
*- List Not Exhaustive
Chapter 1. TABLE OF CONTENTS
Chapter 2. Introduction to Low Fat Goat Milk Market
2.1. Market Overview
2.2. Key Statistics and Report Highlights
2.3. Scope of the Comprehensive Study
2.3.1. Market Definition
2.3.2 Countries and Regions Covered
2.3.3 Research Objective
2.3.4 Units, Currency, and Conversions
2.3.5 Industry Value Chain
2.4. Key Market Segments
2.5. Key Companies
2.6. Study Period
Chapter 3. Strategic Analysis Review
3.1. Low Fat Goat Milk Pricing Analysis and Forecast
3.2. Porter’s Five Forces
3.3. Market Ecosystem
3.4. SWOT Analysis
3.5. Regulatory Scenario
3.3. Effects of Inflation, Russia-Ukraine War, moderating economic growth, and other macroeconomic factors
Chapter 4. Competitive Landscape
4.1. Market Share Analysis
4.1.1. Global Low Fat Goat Milk Market Share by Company, 2023
4.1.2. Product Offerings of Leading Low Fat Goat Milk Companies
4.2. Market Entropy
4.2.1. New Product Launches in the Industry
4.2.2. Mergers, Acquisitions, Joint ventures, and Partnerships
4.3. Key Strategies and Best Practices
Chapter 5. Global Market Projections: Best, Reference, and Low Case Scenarios
5.1. Growth Analysis- Case Scenario Definitions
5.2. Low Growth Case Scenario Forecasts
5.3. Reference Growth Case Scenario Forecasts
5.4. High Growth Case Scenario Forecasts
Chapter 6. Market Dynamics
6.1. Low Fat Goat Milk Market Drivers
6.2. Low Fat Goat Milk Market Challenges
6.6. Low Fat Goat Milk Market Opportunities
6.4. Low Fat Goat Milk Market Trends
Chapter 7. Global Low Fat Goat Milk Market Outlook Trends
7.1. Global Low Fat Goat Milk Revenue (USD Million) and CAGR (%) by Type (2021-2032)
7.2. Global Low Fat Goat Milk Revenue (USD Million) and CAGR (%) by Application (2021-2032)
7.3. Global Low Fat Goat Milk Revenue (USD Million) and CAGR (%) by Product (2021-2032)
By Product
Milk
Cheese
Milk Powder
Others
By Distribution Channel
Supermarkets/ Hypermarkets
Convenience Stores
Specialty Stores
Online Retail
Others
Chapter 8. Global Low Fat Goat Milk Regional Analysis and Outlook
8.1. Global Low Fat Goat Milk Revenue (USD Million) By Regions (2021- 2032)
8.2. North America Low Fat Goat Milk Revenue (USD Million) by Country (2021-2032)
8.2.1. United States Low Fat Goat Milk Regional Analysis and Outlook
8.2.2. Canada Low Fat Goat Milk Regional Analysis and Outlook
8.2.3. Mexico Low Fat Goat Milk Regional Analysis and Outlook
8.3. Europe Low Fat Goat Milk Revenue (USD Million), by Country (2021-2032)
8.3.1. Germany Low Fat Goat Milk Regional Analysis and Outlook
8.3.2. France Low Fat Goat Milk Regional Analysis and Outlook
8.3.3. United Kingdom Low Fat Goat Milk Regional Analysis and Outlook
8.3.4. Spain Low Fat Goat Milk Regional Analysis and Outlook
8.3.5. Italy Low Fat Goat Milk Regional Analysis and Outlook
8.3.6. Russia Low Fat Goat Milk Regional Analysis and Outlook
8.3.7. Rest of Europe Low Fat Goat Milk Regional Analysis and Outlook
8.4. Asia Pacific Low Fat Goat Milk Revenue (USD Million) by Country (2021-2032)
8.4.1. China Low Fat Goat Milk Regional Analysis and Outlook
8.4.2. Japan Low Fat Goat Milk Regional Analysis and Outlook
8.4.3. India Low Fat Goat Milk Regional Analysis and Outlook
8.4.4. South Korea Low Fat Goat Milk Regional Analysis and Outlook
8.4.5. Australia Low Fat Goat Milk Regional Analysis and Outlook
8.4.6. South East Asia Low Fat Goat Milk Regional Analysis and Outlook
8.4.7. Rest of Asia Pacific Low Fat Goat Milk Regional Analysis and Outlook
8.5. South America Low Fat Goat Milk Revenue (USD Million), by Country (2021-2032)
8.5.1. Brazil Low Fat Goat Milk Regional Analysis and Outlook
8.5.2. Argentina Low Fat Goat Milk Regional Analysis and Outlook
8.5.3. Rest of South America Low Fat Goat Milk Regional Analysis and Outlook
8.6. Middle East and Africa Low Fat Goat Milk Revenue (USD Million) by Country (2021-2032)
8.6.1. Middle East Low Fat Goat Milk Regional Analysis and Outlook
8.6.2. Africa Low Fat Goat Milk Regional Analysis and Outlook
Chapter 9. North America Low Fat Goat Milk Analysis and Outlook
9.1. North America Low Fat Goat Milk Revenue (USD Million) by Segments (2021-2032)
9.1.1. North America Low Fat Goat Milk Revenue (USD Million) by Type (2021-2032)
9.1.2. North America Low Fat Goat Milk Revenue (USD Million) by Application (2021-2032)
9.1.3. North America Low Fat Goat Milk Revenue (USD Million) by Product (2021-2032)
By Product
Milk
Cheese
Milk Powder
Others
By Distribution Channel
Supermarkets/ Hypermarkets
Convenience Stores
Specialty Stores
Online Retail
Others
Chapter 10. Europe Low Fat Goat Milk Analysis and Outlook
10.1. Europe Low Fat Goat Milk Revenue (USD Million), by Segments (USD Million) (2021-2032)
10.1.1. Europe Low Fat Goat Milk Revenue (USD Million) by Type (2021-2032)
10.1.2. Europe Low Fat Goat Milk Revenue (USD Million) by Application (2021-2032)
10.1.3. Europe Low Fat Goat Milk Revenue (USD Million) by Product (2021-2032)
By Product
Milk
Cheese
Milk Powder
Others
By Distribution Channel
Supermarkets/ Hypermarkets
Convenience Stores
Specialty Stores
Online Retail
Others
Chapter 11. Asia Pacific Low Fat Goat Milk Analysis and Outlook
11.1. Asia Pacific Low Fat Goat Milk Revenue (USD Million), and Revenue (USD Million) by Segments (2021-2032)
11.1.1. Asia Pacific Low Fat Goat Milk Revenue (USD Million) by Type (2021-2032)
11.1.2. Asia Pacific Low Fat Goat Milk Revenue (USD Million) by Application (2021-2032)
11.1.3. Asia Pacific Low Fat Goat Milk Revenue (USD Million) by Product (2021-2032)
By Product
Milk
Cheese
Milk Powder
Others
By Distribution Channel
Supermarkets/ Hypermarkets
Convenience Stores
Specialty Stores
Online Retail
Others
Chapter 12. South America Low Fat Goat Milk Analysis and Outlook
12.1. South America Low Fat Goat Milk Revenue (USD Million), by Segments (2021-2032)
12.1.1. South America Low Fat Goat Milk Revenue (USD Million) by Type (2021-2032)
12.1.2. South America Low Fat Goat Milk Revenue (USD Million) by Application (2021-2032)
12.1.3. South America Low Fat Goat Milk Revenue (USD Million) by Product (2021-2032)
By Product
Milk
Cheese
Milk Powder
Others
By Distribution Channel
Supermarkets/ Hypermarkets
Convenience Stores
Specialty Stores
Online Retail
Others
Chapter 13. Middle East and Africa Low Fat Goat Milk Analysis and Outlook
13.1. Middle East and Africa Low Fat Goat Milk Revenue (USD Million), by Segments (2021-2032)
13.1.1. Middle East and Africa Low Fat Goat Milk Revenue (USD Million) by Type (2021-2032)
13.1.2. Middle East and Africa Low Fat Goat Milk Revenue (USD Million) by Application (2021-2032)
13.1.3. Middle East and Africa Low Fat Goat Milk Revenue (USD Million) by Product (2021-2032)
By Product
Milk
Cheese
Milk Powder
Others
By Distribution Channel
Supermarkets/ Hypermarkets
Convenience Stores
Specialty Stores
Online Retail
Others
Chapter 14. Low Fat Goat Milk Company Profiles
14.1 Business Overview
14.2 Product Profiles
14.3 SWOT Profiles
14.5 Recent Developments
14.6 Financial Profile
List of Companies
Australian Nature Dairy
Avhdairy
CBM
FIT
Guanshan
Kabrita
Meyenberg
MilkGoat
Red Star
15. Methodology and Data Sources
15.1 Customization Offerings
15.2 Subscription Services
15.3 Related Reports
15.4 Publisher Expertise
LIST OF TABLES
Table 1 Market Segmentation Analysis
Table 2 Global Low Fat Goat Milk Market Share of Leading Companies, 2023
Table 3 Product Offerings of Leading Companies
Table 4 Low Growth Scenario Forecasts
Table 5 Reference Case Growth Scenario
Table 6 High Growth Case Scenario
Table 7 Global Low Fat Goat Milk Revenue (USD Million) And CAGR (%) By Type (2021-2032)
Table 8 Global Low Fat Goat Milk Revenue (USD Million) And CAGR (%) By Application (2021-2032)
Table 9 Global Low Fat Goat Milk Revenue (USD Million) And CAGR (%) By Product (2021-2032)
Table 10 Global Low Fat Goat Milk Market Revenue (USD Million) By Regions (2021-2032)
Table 11 Global Low Fat Goat Milk Market Share (%) By Regions (2021-2032)
Table 12 North America Low Fat Goat Milk Revenue (USD Million) By Country (2021-2032)
Table 13 Europe Low Fat Goat Milk Revenue (USD Million) By Country (2021-2032)
Table 14 Asia Pacific Low Fat Goat Milk Revenue (USD Million) By Country (2021-2032)
Table 15 South America Low Fat Goat Milk Revenue (USD Million) By Country (2021-2032)
Table 16 Middle East and Africa Low Fat Goat Milk Revenue (USD Million) By Region (2021-2032)
Table 17 North America Low Fat Goat Milk Revenue (USD Million) By Type (2021-2032)
Table 18 North America Low Fat Goat Milk Revenue (USD Million) By Application (2021-2032)
Table 19 North America Low Fat Goat Milk Revenue (USD Million) By Product (2021-2032)
Table 20 Europe Low Fat Goat Milk Revenue (USD Million) By Type (2021-2032)
Table 21 Europe Low Fat Goat Milk Revenue (USD Million) By Application (2021-2032)
Table 22 Europe Low Fat Goat Milk Revenue (USD Million) By Product (2021-2032)
Table 23 Asia Pacific Low Fat Goat Milk Revenue (USD Million) By Type (2021-2032)
Table 24 Asia Pacific Low Fat Goat Milk Revenue (USD Million) By Application (2021-2032)
Table 25 Asia Pacific Low Fat Goat Milk Revenue (USD Million) By Product (2021-2032)
Table 26 South America Low Fat Goat Milk Revenue (USD Million) By Type (2021-2032)
Table 27 South America Low Fat Goat Milk Revenue (USD Million) By Application (2021-2032)
Table 28 South America Low Fat Goat Milk Revenue (USD Million) By Product (2021-2032)
Table 29 Middle East and Africa Low Fat Goat Milk Revenue (USD Million) By Type (2021-2032)
Table 30 Middle East and Africa Low Fat Goat Milk Revenue (USD Million) By Application (2021-2032)
Table 31 Middle East and Africa Low Fat Goat Milk Revenue (USD Million) By Product (2021-2032)
LIST OF FIGURES
Figure 1. Market Scope
Figure 2. Pricing Forecasts Per Unit, 2023- 2032
Figure 3. Porter’s Five Forces
Figure 4. Global Low Fat Goat Milk Market Revenue (USD Million) By Regions (2021-2032)
Figure 5. Global Low Fat Goat Milk Market Share (%) By Regions (2023)
Figure 6. North America Low Fat Goat Milk Revenue (USD Million) By Country (2021-2032)
Figure 7. United States Low Fat Goat Milk Revenue (USD Million) By Country (2021-2032)
Figure 8. Canada Low Fat Goat Milk Revenue (USD Million) By Country (2021-2032)
Figure 9. Mexico Low Fat Goat Milk Revenue (USD Million) By Country (2021-2032)
Figure 10. Europe Low Fat Goat Milk Revenue (USD Million) By Country (2021-2032)
Figure 11. Germany Low Fat Goat Milk Revenue (USD Million) By Country (2021-2032)
Figure 12. France Low Fat Goat Milk Revenue (USD Million) By Country (2021-2032)
Figure 13. United Kingdom Low Fat Goat Milk Revenue (USD Million) By Country (2021-2032)
Figure 14. Spain Low Fat Goat Milk Revenue (USD Million) By Country (2021-2032)
Figure 15. Italy Low Fat Goat Milk Revenue (USD Million) By Country (2021-2032)
Figure 16. Russia Low Fat Goat Milk Revenue (USD Million) By Country (2021-2032)
Figure 17. Rest of Europe Low Fat Goat Milk Revenue (USD Million) By Country (2021-2032)
Figure 11. Asia Pacific Low Fat Goat Milk Revenue (USD Million) By Country (2021-2032)
Figure 12. China Low Fat Goat Milk Revenue (USD Million) By Country (2021-2032)
Figure 13. Japan Low Fat Goat Milk Revenue (USD Million) By Country (2021-2032)
Figure 14. India Low Fat Goat Milk Revenue (USD Million) By Country (2021-2032)
Figure 15. South Korea Low Fat Goat Milk Revenue (USD Million) By Country (2021-2032)
Figure 16. Australia Low Fat Goat Milk Revenue (USD Million) By Country (2021-2032)
Figure 17. South East Asia Low Fat Goat Milk Revenue (USD Million) By Country (2021-2032)
Figure 18. South America Low Fat Goat Milk Revenue (USD Million) By Country (2021-2032)
Figure 19. Brazil Low Fat Goat Milk Revenue (USD Million) By Country (2021-2032)
Figure 20. Argentina Low Fat Goat Milk Revenue (USD Million) By Country (2021-2032)
Figure 21. Rest of Asia Pacific Low Fat Goat Milk Revenue (USD Million) By Country (2021-2032)
Figure 22. Middle East and Africa Low Fat Goat Milk Revenue (USD Million) By Region (2021-2032)
Figure 23. Saudi Arabia Low Fat Goat Milk Revenue (USD Million) By Region (2021-2032)
Figure 24. The UAE Low Fat Goat Milk Revenue (USD Million) By Region (2021-2032)
Figure 25. Rest of Middle East Low Fat Goat Milk Revenue (USD Million) By Region (2021-2032)
Figure 26. South Africa Low Fat Goat Milk Revenue (USD Million) By Region (2021-2032)
Figure 27. Africa Low Fat Goat Milk Revenue (USD Million) By Region (2021-2032)
Figure 28. North America Low Fat Goat Milk Revenue (USD Million) By Type (2021-2032)
Figure 29. North America Low Fat Goat Milk Revenue (USD Million) By Application (2021-2032)
Figure 30. North America Low Fat Goat Milk Revenue (USD Million) By Product (2021-2032)
Figure 31. Europe Low Fat Goat Milk Revenue (USD Million) By Type (2021-2032)
Figure 32. Europe Low Fat Goat Milk Revenue (USD Million) By Application (2021-2032)
Figure 33. Europe Low Fat Goat Milk Revenue (USD Million) By Product (2021-2032)
Figure 34. Asia Pacific Low Fat Goat Milk Revenue (USD Million) By Type (2021-2032)
Figure 35. Asia Pacific Low Fat Goat Milk Revenue (USD Million) By Application (2021-2032)
Figure 36. Asia Pacific Low Fat Goat Milk Revenue (USD Million) By Product (2021-2032)
Figure 37. South America Low Fat Goat Milk Revenue (USD Million) By Type (2021-2032)
Figure 38. South America Low Fat Goat Milk Revenue (USD Million) By Application (2021-2032)
Figure 39. South America Low Fat Goat Milk Revenue (USD Million) By Product (2021-2032)
Figure 40. Middle East and Africa Low Fat Goat Milk Revenue (USD Million) By Type (2021-2032)
Figure 41. Middle East and Africa Low Fat Goat Milk Revenue (USD Million) By Application (2021-2032)
Figure 42. Middle East and Africa Low Fat Goat Milk Revenue (USD Million) By Product (2021-2032)
By Product
Milk
Cheese
Milk Powder
Others
By Distribution Channel
Supermarkets/ Hypermarkets
Convenience Stores
Specialty Stores
Online Retail
Others
Countries Analyzed
North America (US, Canada, Mexico)
Europe (Germany, UK, France, Spain, Italy, Russia, Rest of Europe)
Asia Pacific (China, India, Japan, South Korea, Australia, South East Asia, Rest of Asia)
South America (Brazil, Argentina, Rest of South America)
Middle East and Africa (Saudi Arabia, UAE, Rest of Middle East, South Africa, Egypt, Rest of Africa)
