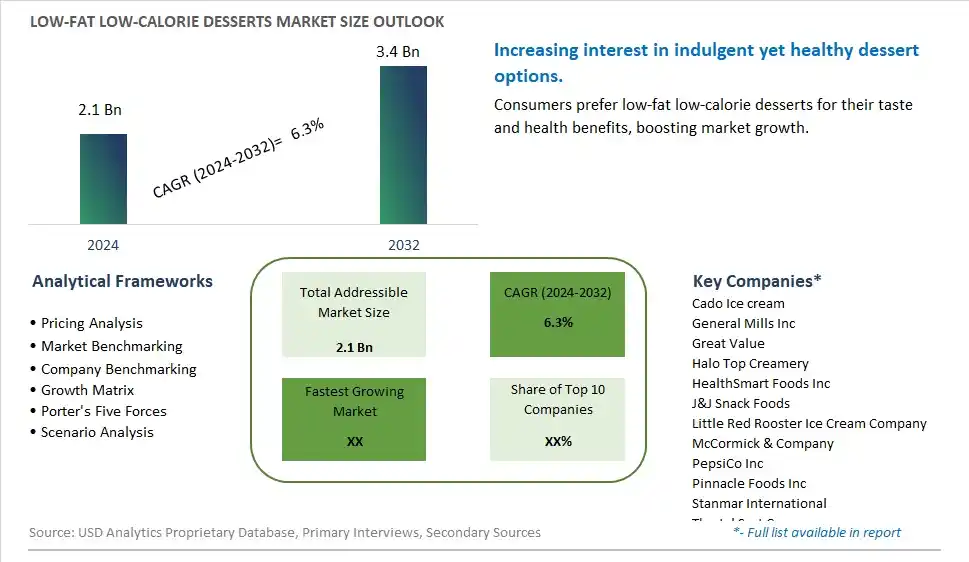
Global Low-Fat Low-Calorie Desserts Market Size is valued at $2.1 Billion in 2024 and is forecast to register a growth rate (CAGR) of 6.3% to reach $3.4 Billion by 2032.
The global Low-Fat Low-Calorie Desserts Market Comprehensive Study analyzes and forecasts the market size across 6 regions and 24 countries for diverse segments -By Type (Brownie, Cake, Cheesecake, Chocolate, Cookies, Cupcake, Ice-cream, Frozen dessert), By Flavor (Vanilla, Cranberry, Chocolate, Strawberry, Orange, Lemon, Blueberry, Others), By Nature (Vegan, Non-GMO, Gluten-free, Organic, Conventional)
An Introduction to Low-Fat Low-Calorie Desserts Market
The Low-Fat Low-Calorie Desserts Market involves the production and sale of desserts formulated with reduced fat and calories, catering to health-conscious consumers seeking indulgent yet nutritious options. The market is driven by increasing health consciousness, rising prevalence of obesity and related health conditions, and growing demand for low-fat and low-calorie foods. Additionally, advancements in dessert formulations and the expansion of product offerings support market growth.
Low fat Low calorie Desserts Competitive Landscape
The market report analyses the leading companies in the industry including Cado Ice cream, General Mills Inc, Great Value, Halo Top Creamery, HealthSmart Foods Inc, J&J Snack Foods, Little Red Rooster Ice Cream Company, McCormick & Company, PepsiCo Inc, Pinnacle Foods Inc, Stanmar International, The Jel Sert Company, The Kraft Heinz Company, Unilever Plc, Wilton, and Others.
Low fat Low calorie Desserts Market Dynamics
Low-Fat Low-Calorie Desserts Market Trend: Increasing Demand for Healthier Dessert Alternatives
The most prominent trend in the Low-Fat Low-Calorie Desserts Market is the increasing demand for healthier dessert alternatives. Consumers are seeking desserts that offer indulgence without the high calorie and fat content. This trend is driven by the growing awareness of the health impacts of high-fat and high-calorie desserts and the desire for better-for-you options.
Low-Fat Low-Calorie Desserts Market Driver: Health Consciousness and Focus on Weight Management
A key driver in the Low-Fat Low-Calorie Desserts Market is health consciousness and a focus on weight management. As more individuals adopt healthier eating habits and focus on maintaining a balanced diet, there is a rising demand for desserts that align with these health goals. Low-fat low-calorie desserts, which provide a satisfying treat with fewer calories, cater to this demand and support market growth.
Low-Fat Low-Calorie Desserts Market Opportunity: Innovation in Ingredients and Flavors
One significant opportunity in the Low-Fat Low-Calorie Desserts Market lies in innovation in ingredients and flavors. Companies can develop new low-fat low-calorie dessert recipes using alternative sweeteners, high-fiber ingredients, and natural flavors. By offering a variety of flavors and health-conscious formulations, manufacturers can attract health-conscious consumers and expand their product offerings.
Low-Fat Low-Calorie Desserts Market Share Analysis- Largest Segment by Type
The Ice-Cream segment is the largest in the Low-Fat Low-Calorie Desserts Market by type. This dominance is driven by the high consumer demand for indulgent yet healthier frozen treats that offer the satisfaction of traditional ice cream with reduced fat and calorie content. Low-fat, low-calorie ice cream provides a guilt-free dessert option for health-conscious consumers, making it a popular choice. The continuous innovation in ice cream formulations, including the use of alternative sweeteners, fat replacers, and added nutritional benefits, enhances their appeal. Additionally, the extensive availability of low-fat, low-calorie ice cream in supermarkets, convenience stores, and online platforms further boosts its accessibility to a broad consumer base. The strong consumer preference for delicious yet healthier dessert options reinforces the dominant position of the ice cream segment in the market.
Low-Fat Low-Calorie Desserts Market Share Analysis- Fastest Growing Segment by Flavor
The Chocolate flavor segment is poised to grow the fastest in the Low-Fat Low-Calorie Desserts Market by flavor over the next five years. This rapid growth is driven by the enduring popularity of chocolate as a preferred flavor for desserts. Chocolate-flavored low-fat, low-calorie desserts offer the rich, indulgent taste that consumers love while adhering to their dietary preferences. The continuous innovation in chocolate dessert formulations, including the use of high-quality cocoa, natural sweeteners, and added health benefits like antioxidants, enhances their appeal. Additionally, the growing trend of premium and gourmet chocolate desserts supports the fast growth of the chocolate flavor segment, as consumers seek indulgent yet healthier dessert options. The influence of consumer preferences for classic and comforting flavors further contributes to the rapid growth of the chocolate flavor segment.
Low-Fat Low-Calorie Desserts Market Share Analysis- Largest Segment by Nature
The Conventional segment is the largest in the Low-Fat Low-Calorie Desserts Market by nature. This dominance is driven by the high consumer demand for widely available and affordable low-fat, low-calorie dessert options. Conventional low-fat, low-calorie desserts provide the same indulgence as traditional desserts but with reduced fat and calorie content, making them a popular choice among health-conscious consumers. The continuous innovation in conventional dessert formulations, including the use of alternative sweeteners, fat replacers, and added nutritional benefits, enhances their appeal. Additionally, the extensive availability of conventional low-fat, low-calorie desserts in supermarkets, bakeries, and online platforms further boosts their accessibility to a broad consumer base. The strong consumer preference for delicious yet healthier dessert options reinforces the dominant position of the conventional segment in the market.
Low fat Low calorie Desserts Market Segmentation
By Type
Brownie
Cake
Cheesecake
Chocolate
Cookies
Cupcake
Ice-cream
Frozen dessert
By Flavor
Vanilla
Cranberry
Chocolate
Strawberry
Orange
Lemon
Blueberry
Others
By Nature
Vegan
Non-GMO
Gluten-free
Organic
Conventional
Countries Analyzed
North America (US, Canada, Mexico)
Europe (Germany, UK, France, Spain, Italy, Russia, Rest of Europe)
Asia Pacific (China, India, Japan, South Korea, Australia, South East Asia, Rest of Asia)
South America (Brazil, Argentina, Rest of South America)
Middle East and Africa (Saudi Arabia, UAE, Rest of Middle East, South Africa, Egypt, Rest of Africa)
Low fat Low calorie Desserts Companies Profiled in the Study
Cado Ice cream
General Mills Inc
Great Value
Halo Top Creamery
HealthSmart Foods Inc
J&J Snack Foods
Little Red Rooster Ice Cream Company
McCormick & Company
PepsiCo Inc
Pinnacle Foods Inc
Stanmar International
The Jel Sert Company
The Kraft Heinz Company
Unilever Plc
Wilton
*- List Not Exhaustive
Chapter 1. TABLE OF CONTENTS
Chapter 2. Introduction to Low fat Low calorie Desserts Market
2.1. Market Overview
2.2. Key Statistics and Report Highlights
2.3. Scope of the Comprehensive Study
2.3.1. Market Definition
2.3.2 Countries and Regions Covered
2.3.3 Research Objective
2.3.4 Units, Currency, and Conversions
2.3.5 Industry Value Chain
2.4. Key Market Segments
2.5. Key Companies
2.6. Study Period
Chapter 3. Strategic Analysis Review
3.1. Low fat Low calorie Desserts Pricing Analysis and Forecast
3.2. Porter’s Five Forces
3.3. Market Ecosystem
3.4. SWOT Analysis
3.5. Regulatory Scenario
3.3. Effects of Inflation, Russia-Ukraine War, moderating economic growth, and other macroeconomic factors
Chapter 4. Competitive Landscape
4.1. Market Share Analysis
4.1.1. Global Low fat Low calorie Desserts Market Share by Company, 2023
4.1.2. Product Offerings of Leading Low fat Low calorie Desserts Companies
4.2. Market Entropy
4.2.1. New Product Launches in the Industry
4.2.2. Mergers, Acquisitions, Joint ventures, and Partnerships
4.3. Key Strategies and Best Practices
Chapter 5. Global Market Projections: Best, Reference, and Low Case Scenarios
5.1. Growth Analysis- Case Scenario Definitions
5.2. Low Growth Case Scenario Forecasts
5.3. Reference Growth Case Scenario Forecasts
5.4. High Growth Case Scenario Forecasts
Chapter 6. Market Dynamics
6.1. Low fat Low calorie Desserts Market Drivers
6.2. Low fat Low calorie Desserts Market Challenges
6.6. Low fat Low calorie Desserts Market Opportunities
6.4. Low fat Low calorie Desserts Market Trends
Chapter 7. Global Low fat Low calorie Desserts Market Outlook Trends
7.1. Global Low fat Low calorie Desserts Revenue (USD Million) and CAGR (%) by Type (2021-2032)
7.2. Global Low fat Low calorie Desserts Revenue (USD Million) and CAGR (%) by Application (2021-2032)
7.3. Global Low fat Low calorie Desserts Revenue (USD Million) and CAGR (%) by Product (2021-2032)
By Type
Brownie
Cake
Cheesecake
Chocolate
Cookies
Cupcake
Ice-cream
Frozen dessert
By Flavor
Vanilla
Cranberry
Chocolate
Strawberry
Orange
Lemon
Blueberry
Others
By Nature
Vegan
Non-GMO
Gluten-free
Organic
Conventional
Chapter 8. Global Low fat Low calorie Desserts Regional Analysis and Outlook
8.1. Global Low fat Low calorie Desserts Revenue (USD Million) By Regions (2021- 2032)
8.2. North America Low fat Low calorie Desserts Revenue (USD Million) by Country (2021-2032)
8.2.1. United States Low fat Low calorie Desserts Regional Analysis and Outlook
8.2.2. Canada Low fat Low calorie Desserts Regional Analysis and Outlook
8.2.3. Mexico Low fat Low calorie Desserts Regional Analysis and Outlook
8.3. Europe Low fat Low calorie Desserts Revenue (USD Million), by Country (2021-2032)
8.3.1. Germany Low fat Low calorie Desserts Regional Analysis and Outlook
8.3.2. France Low fat Low calorie Desserts Regional Analysis and Outlook
8.3.3. United Kingdom Low fat Low calorie Desserts Regional Analysis and Outlook
8.3.4. Spain Low fat Low calorie Desserts Regional Analysis and Outlook
8.3.5. Italy Low fat Low calorie Desserts Regional Analysis and Outlook
8.3.6. Russia Low fat Low calorie Desserts Regional Analysis and Outlook
8.3.7. Rest of Europe Low fat Low calorie Desserts Regional Analysis and Outlook
8.4. Asia Pacific Low fat Low calorie Desserts Revenue (USD Million) by Country (2021-2032)
8.4.1. China Low fat Low calorie Desserts Regional Analysis and Outlook
8.4.2. Japan Low fat Low calorie Desserts Regional Analysis and Outlook
8.4.3. India Low fat Low calorie Desserts Regional Analysis and Outlook
8.4.4. South Korea Low fat Low calorie Desserts Regional Analysis and Outlook
8.4.5. Australia Low fat Low calorie Desserts Regional Analysis and Outlook
8.4.6. South East Asia Low fat Low calorie Desserts Regional Analysis and Outlook
8.4.7. Rest of Asia Pacific Low fat Low calorie Desserts Regional Analysis and Outlook
8.5. South America Low fat Low calorie Desserts Revenue (USD Million), by Country (2021-2032)
8.5.1. Brazil Low fat Low calorie Desserts Regional Analysis and Outlook
8.5.2. Argentina Low fat Low calorie Desserts Regional Analysis and Outlook
8.5.3. Rest of South America Low fat Low calorie Desserts Regional Analysis and Outlook
8.6. Middle East and Africa Low fat Low calorie Desserts Revenue (USD Million) by Country (2021-2032)
8.6.1. Middle East Low fat Low calorie Desserts Regional Analysis and Outlook
8.6.2. Africa Low fat Low calorie Desserts Regional Analysis and Outlook
Chapter 9. North America Low fat Low calorie Desserts Analysis and Outlook
9.1. North America Low fat Low calorie Desserts Revenue (USD Million) by Segments (2021-2032)
9.1.1. North America Low fat Low calorie Desserts Revenue (USD Million) by Type (2021-2032)
9.1.2. North America Low fat Low calorie Desserts Revenue (USD Million) by Application (2021-2032)
9.1.3. North America Low fat Low calorie Desserts Revenue (USD Million) by Product (2021-2032)
By Type
Brownie
Cake
Cheesecake
Chocolate
Cookies
Cupcake
Ice-cream
Frozen dessert
By Flavor
Vanilla
Cranberry
Chocolate
Strawberry
Orange
Lemon
Blueberry
Others
By Nature
Vegan
Non-GMO
Gluten-free
Organic
Conventional
Chapter 10. Europe Low fat Low calorie Desserts Analysis and Outlook
10.1. Europe Low fat Low calorie Desserts Revenue (USD Million), by Segments (USD Million) (2021-2032)
10.1.1. Europe Low fat Low calorie Desserts Revenue (USD Million) by Type (2021-2032)
10.1.2. Europe Low fat Low calorie Desserts Revenue (USD Million) by Application (2021-2032)
10.1.3. Europe Low fat Low calorie Desserts Revenue (USD Million) by Product (2021-2032)
By Type
Brownie
Cake
Cheesecake
Chocolate
Cookies
Cupcake
Ice-cream
Frozen dessert
By Flavor
Vanilla
Cranberry
Chocolate
Strawberry
Orange
Lemon
Blueberry
Others
By Nature
Vegan
Non-GMO
Gluten-free
Organic
Conventional
Chapter 11. Asia Pacific Low fat Low calorie Desserts Analysis and Outlook
11.1. Asia Pacific Low fat Low calorie Desserts Revenue (USD Million), and Revenue (USD Million) by Segments (2021-2032)
11.1.1. Asia Pacific Low fat Low calorie Desserts Revenue (USD Million) by Type (2021-2032)
11.1.2. Asia Pacific Low fat Low calorie Desserts Revenue (USD Million) by Application (2021-2032)
11.1.3. Asia Pacific Low fat Low calorie Desserts Revenue (USD Million) by Product (2021-2032)
By Type
Brownie
Cake
Cheesecake
Chocolate
Cookies
Cupcake
Ice-cream
Frozen dessert
By Flavor
Vanilla
Cranberry
Chocolate
Strawberry
Orange
Lemon
Blueberry
Others
By Nature
Vegan
Non-GMO
Gluten-free
Organic
Conventional
Chapter 12. South America Low fat Low calorie Desserts Analysis and Outlook
12.1. South America Low fat Low calorie Desserts Revenue (USD Million), by Segments (2021-2032)
12.1.1. South America Low fat Low calorie Desserts Revenue (USD Million) by Type (2021-2032)
12.1.2. South America Low fat Low calorie Desserts Revenue (USD Million) by Application (2021-2032)
12.1.3. South America Low fat Low calorie Desserts Revenue (USD Million) by Product (2021-2032)
By Type
Brownie
Cake
Cheesecake
Chocolate
Cookies
Cupcake
Ice-cream
Frozen dessert
By Flavor
Vanilla
Cranberry
Chocolate
Strawberry
Orange
Lemon
Blueberry
Others
By Nature
Vegan
Non-GMO
Gluten-free
Organic
Conventional
Chapter 13. Middle East and Africa Low fat Low calorie Desserts Analysis and Outlook
13.1. Middle East and Africa Low fat Low calorie Desserts Revenue (USD Million), by Segments (2021-2032)
13.1.1. Middle East and Africa Low fat Low calorie Desserts Revenue (USD Million) by Type (2021-2032)
13.1.2. Middle East and Africa Low fat Low calorie Desserts Revenue (USD Million) by Application (2021-2032)
13.1.3. Middle East and Africa Low fat Low calorie Desserts Revenue (USD Million) by Product (2021-2032)
By Type
Brownie
Cake
Cheesecake
Chocolate
Cookies
Cupcake
Ice-cream
Frozen dessert
By Flavor
Vanilla
Cranberry
Chocolate
Strawberry
Orange
Lemon
Blueberry
Others
By Nature
Vegan
Non-GMO
Gluten-free
Organic
Conventional
Chapter 14. Low fat Low calorie Desserts Company Profiles
14.1 Business Overview
14.2 Product Profiles
14.3 SWOT Profiles
14.5 Recent Developments
14.6 Financial Profile
List of Companies
Cado Ice cream
General Mills Inc
Great Value
Halo Top Creamery
HealthSmart Foods Inc
J&J Snack Foods
Little Red Rooster Ice Cream Company
McCormick & Company
PepsiCo Inc
Pinnacle Foods Inc
Stanmar International
The Jel Sert Company
The Kraft Heinz Company
Unilever Plc
Wilton
15. Methodology and Data Sources
15.1 Customization Offerings
15.2 Subscription Services
15.3 Related Reports
15.4 Publisher Expertise
LIST OF TABLES
Table 1 Market Segmentation Analysis
Table 2 Global Low fat Low calorie Desserts Market Share of Leading Companies, 2023
Table 3 Product Offerings of Leading Companies
Table 4 Low Growth Scenario Forecasts
Table 5 Reference Case Growth Scenario
Table 6 High Growth Case Scenario
Table 7 Global Low fat Low calorie Desserts Revenue (USD Million) And CAGR (%) By Type (2021-2032)
Table 8 Global Low fat Low calorie Desserts Revenue (USD Million) And CAGR (%) By Application (2021-2032)
Table 9 Global Low fat Low calorie Desserts Revenue (USD Million) And CAGR (%) By Product (2021-2032)
Table 10 Global Low fat Low calorie Desserts Market Revenue (USD Million) By Regions (2021-2032)
Table 11 Global Low fat Low calorie Desserts Market Share (%) By Regions (2021-2032)
Table 12 North America Low fat Low calorie Desserts Revenue (USD Million) By Country (2021-2032)
Table 13 Europe Low fat Low calorie Desserts Revenue (USD Million) By Country (2021-2032)
Table 14 Asia Pacific Low fat Low calorie Desserts Revenue (USD Million) By Country (2021-2032)
Table 15 South America Low fat Low calorie Desserts Revenue (USD Million) By Country (2021-2032)
Table 16 Middle East and Africa Low fat Low calorie Desserts Revenue (USD Million) By Region (2021-2032)
Table 17 North America Low fat Low calorie Desserts Revenue (USD Million) By Type (2021-2032)
Table 18 North America Low fat Low calorie Desserts Revenue (USD Million) By Application (2021-2032)
Table 19 North America Low fat Low calorie Desserts Revenue (USD Million) By Product (2021-2032)
Table 20 Europe Low fat Low calorie Desserts Revenue (USD Million) By Type (2021-2032)
Table 21 Europe Low fat Low calorie Desserts Revenue (USD Million) By Application (2021-2032)
Table 22 Europe Low fat Low calorie Desserts Revenue (USD Million) By Product (2021-2032)
Table 23 Asia Pacific Low fat Low calorie Desserts Revenue (USD Million) By Type (2021-2032)
Table 24 Asia Pacific Low fat Low calorie Desserts Revenue (USD Million) By Application (2021-2032)
Table 25 Asia Pacific Low fat Low calorie Desserts Revenue (USD Million) By Product (2021-2032)
Table 26 South America Low fat Low calorie Desserts Revenue (USD Million) By Type (2021-2032)
Table 27 South America Low fat Low calorie Desserts Revenue (USD Million) By Application (2021-2032)
Table 28 South America Low fat Low calorie Desserts Revenue (USD Million) By Product (2021-2032)
Table 29 Middle East and Africa Low fat Low calorie Desserts Revenue (USD Million) By Type (2021-2032)
Table 30 Middle East and Africa Low fat Low calorie Desserts Revenue (USD Million) By Application (2021-2032)
Table 31 Middle East and Africa Low fat Low calorie Desserts Revenue (USD Million) By Product (2021-2032)
LIST OF FIGURES
Figure 1. Market Scope
Figure 2. Pricing Forecasts Per Unit, 2023- 2032
Figure 3. Porter’s Five Forces
Figure 4. Global Low fat Low calorie Desserts Market Revenue (USD Million) By Regions (2021-2032)
Figure 5. Global Low fat Low calorie Desserts Market Share (%) By Regions (2023)
Figure 6. North America Low fat Low calorie Desserts Revenue (USD Million) By Country (2021-2032)
Figure 7. United States Low fat Low calorie Desserts Revenue (USD Million) By Country (2021-2032)
Figure 8. Canada Low fat Low calorie Desserts Revenue (USD Million) By Country (2021-2032)
Figure 9. Mexico Low fat Low calorie Desserts Revenue (USD Million) By Country (2021-2032)
Figure 10. Europe Low fat Low calorie Desserts Revenue (USD Million) By Country (2021-2032)
Figure 11. Germany Low fat Low calorie Desserts Revenue (USD Million) By Country (2021-2032)
Figure 12. France Low fat Low calorie Desserts Revenue (USD Million) By Country (2021-2032)
Figure 13. United Kingdom Low fat Low calorie Desserts Revenue (USD Million) By Country (2021-2032)
Figure 14. Spain Low fat Low calorie Desserts Revenue (USD Million) By Country (2021-2032)
Figure 15. Italy Low fat Low calorie Desserts Revenue (USD Million) By Country (2021-2032)
Figure 16. Russia Low fat Low calorie Desserts Revenue (USD Million) By Country (2021-2032)
Figure 17. Rest of Europe Low fat Low calorie Desserts Revenue (USD Million) By Country (2021-2032)
Figure 11. Asia Pacific Low fat Low calorie Desserts Revenue (USD Million) By Country (2021-2032)
Figure 12. China Low fat Low calorie Desserts Revenue (USD Million) By Country (2021-2032)
Figure 13. Japan Low fat Low calorie Desserts Revenue (USD Million) By Country (2021-2032)
Figure 14. India Low fat Low calorie Desserts Revenue (USD Million) By Country (2021-2032)
Figure 15. South Korea Low fat Low calorie Desserts Revenue (USD Million) By Country (2021-2032)
Figure 16. Australia Low fat Low calorie Desserts Revenue (USD Million) By Country (2021-2032)
Figure 17. South East Asia Low fat Low calorie Desserts Revenue (USD Million) By Country (2021-2032)
Figure 18. South America Low fat Low calorie Desserts Revenue (USD Million) By Country (2021-2032)
Figure 19. Brazil Low fat Low calorie Desserts Revenue (USD Million) By Country (2021-2032)
Figure 20. Argentina Low fat Low calorie Desserts Revenue (USD Million) By Country (2021-2032)
Figure 21. Rest of Asia Pacific Low fat Low calorie Desserts Revenue (USD Million) By Country (2021-2032)
Figure 22. Middle East and Africa Low fat Low calorie Desserts Revenue (USD Million) By Region (2021-2032)
Figure 23. Saudi Arabia Low fat Low calorie Desserts Revenue (USD Million) By Region (2021-2032)
Figure 24. The UAE Low fat Low calorie Desserts Revenue (USD Million) By Region (2021-2032)
Figure 25. Rest of Middle East Low fat Low calorie Desserts Revenue (USD Million) By Region (2021-2032)
Figure 26. South Africa Low fat Low calorie Desserts Revenue (USD Million) By Region (2021-2032)
Figure 27. Africa Low fat Low calorie Desserts Revenue (USD Million) By Region (2021-2032)
Figure 28. North America Low fat Low calorie Desserts Revenue (USD Million) By Type (2021-2032)
Figure 29. North America Low fat Low calorie Desserts Revenue (USD Million) By Application (2021-2032)
Figure 30. North America Low fat Low calorie Desserts Revenue (USD Million) By Product (2021-2032)
Figure 31. Europe Low fat Low calorie Desserts Revenue (USD Million) By Type (2021-2032)
Figure 32. Europe Low fat Low calorie Desserts Revenue (USD Million) By Application (2021-2032)
Figure 33. Europe Low fat Low calorie Desserts Revenue (USD Million) By Product (2021-2032)
Figure 34. Asia Pacific Low fat Low calorie Desserts Revenue (USD Million) By Type (2021-2032)
Figure 35. Asia Pacific Low fat Low calorie Desserts Revenue (USD Million) By Application (2021-2032)
Figure 36. Asia Pacific Low fat Low calorie Desserts Revenue (USD Million) By Product (2021-2032)
Figure 37. South America Low fat Low calorie Desserts Revenue (USD Million) By Type (2021-2032)
Figure 38. South America Low fat Low calorie Desserts Revenue (USD Million) By Application (2021-2032)
Figure 39. South America Low fat Low calorie Desserts Revenue (USD Million) By Product (2021-2032)
Figure 40. Middle East and Africa Low fat Low calorie Desserts Revenue (USD Million) By Type (2021-2032)
Figure 41. Middle East and Africa Low fat Low calorie Desserts Revenue (USD Million) By Application (2021-2032)
Figure 42. Middle East and Africa Low fat Low calorie Desserts Revenue (USD Million) By Product (2021-2032)
By Type
Brownie
Cake
Cheesecake
Chocolate
Cookies
Cupcake
Ice-cream
Frozen dessert
By Flavor
Vanilla
Cranberry
Chocolate
Strawberry
Orange
Lemon
Blueberry
Others
By Nature
Vegan
Non-GMO
Gluten-free
Organic
Conventional
Countries Analyzed
North America (US, Canada, Mexico)
Europe (Germany, UK, France, Spain, Italy, Russia, Rest of Europe)
Asia Pacific (China, India, Japan, South Korea, Australia, South East Asia, Rest of Asia)
South America (Brazil, Argentina, Rest of South America)
Middle East and Africa (Saudi Arabia, UAE, Rest of Middle East, South Africa, Egypt, Rest of Africa)
