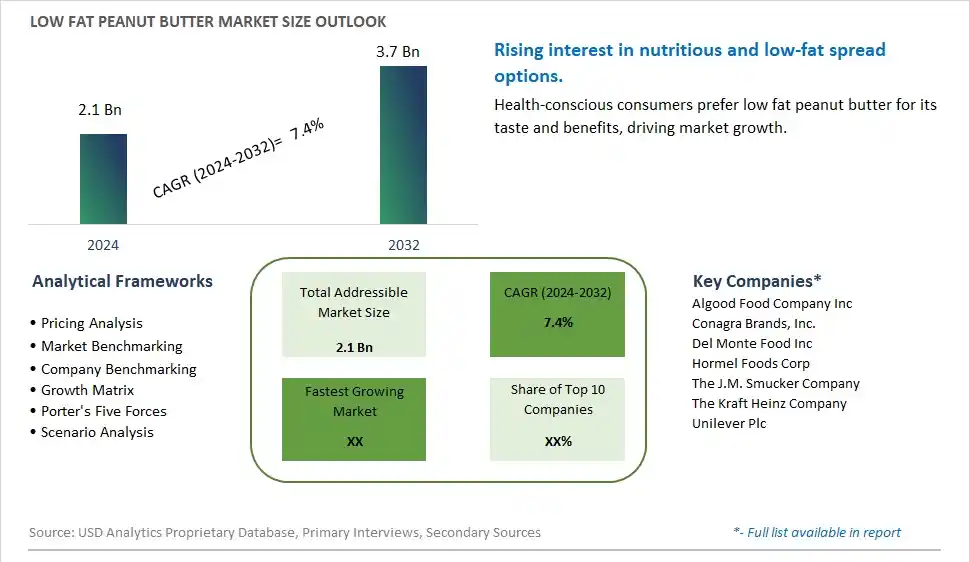
Global Low Fat Peanut Butter Market Size is valued at $2.1 Billion in 2024 and is forecast to register a growth rate (CAGR) of 7.4% to reach $3.7 Billion by 2032.
The global Low Fat Peanut Butter Market Comprehensive Study analyzes and forecasts the market size across 6 regions and 24 countries for diverse segments -By Type (Crunchy, Cream, Others), By Distribution Channel (Online, Offline)
An Introduction to Low Fat Peanut Butter Market
The low fat peanut butter market in 2024 is experiencing robust growth, driven by the demand for healthier spreads that offer the taste and protein benefits of traditional peanut butter with reduced fat content. The market benefits from innovations in peanut processing and ingredient formulation that enhance taste and texture while reducing fat. The trend towards clean label and natural ingredients is influencing product development. Increasing consumer interest in protein-rich snacks and the popularity of fitness and wellness trends are further propelling market demand for low fat peanut butter.
Low Fat Peanut Butter Competitive Landscape
The market report analyses the leading companies in the industry including Algood Food Company Inc, Conagra Brands, Inc., Del Monte Food Inc, Hormel Foods Corp, The J.M. Smucker Company, The Kraft Heinz Company, Unilever Plc, and Others.
Low Fat Peanut Butter Market Dynamics
Low Fat Peanut Butter Market Trend: Increasing Demand for Healthier Nut Butters
The most prominent trend in the Low Fat Peanut Butter Market is the increasing demand for healthier nut butters. Consumers are seeking peanut butter options that offer the rich taste and texture they love with reduced fat content. This trend is driven by the growing awareness of the health impacts of high-fat diets and the desire for better-for-you alternatives.
Low Fat Peanut Butter Market Driver: Health Consciousness and Nutritional Awareness
A key driver in the Low Fat Peanut Butter Market is health consciousness and nutritional awareness. As more individuals focus on maintaining a balanced diet and managing their weight, there is a rising demand for peanut butter that fits into a healthier eating plan. Low fat peanut butter, which provides the protein and flavor of traditional peanut butter with fewer calories, caters to this demand and supports market growth.
Low Fat Peanut Butter Market Opportunity: Expansion into Flavored and Functional Varieties
One significant opportunity in the Low Fat Peanut Butter Market lies in the expansion into flavored and functional varieties. Companies can innovate by creating new low fat peanut butter products with added flavors, such as chocolate or honey, and incorporating functional ingredients, such as added protein or vitamins. By offering diverse and nutritious options, manufacturers can attract health-conscious consumers and drive market growth.
Low Fat Peanut Butter Market Share Analysis: Cream segment generated the highest revenue share in the industry
The largest segment in the Low Fat Peanut Butter Market by type is the Cream segment. Creamy peanut butter is highly favored by consumers due to its smooth texture and versatility in various culinary applications. It spreads easily on bread, making it a popular choice for sandwiches, and it blends seamlessly into recipes such as smoothies, sauces, and baked goods. The appeal of creamy peanut butter extends to both children and adults, contributing to its dominant market position. Additionally, manufacturers often enhance the nutritional profile of creamy peanut butter by adding vitamins and minerals, further increasing its attractiveness to health-conscious consumers. The wide availability of creamy low fat peanut butter in supermarkets, grocery stores, and online platforms ensures that it remains the preferred choice for many consumers, securing its position as the largest segment in the market.
Low Fat Peanut Butter Market Share Analysis: Online Distribution Channel is the fastest growing segment over the forecast period to 2032
The fastest-growing segment in the Low Fat Peanut Butter Market by distribution channel is the Online segment. The growth of e-commerce and the increasing preference for online shopping are key drivers of this segment's expansion. Consumers are turning to online platforms for their grocery needs due to the convenience of home delivery, the ability to compare products and prices, and the extensive selection available. Online retail offers the advantage of detailed product descriptions, customer reviews, and the ability to discover niche and specialty low fat peanut butter brands that may not be readily available in physical stores. The Past few yearshas further accelerated the shift towards online shopping, as more consumers have become accustomed to purchasing their food products online. Additionally, online retailers often provide competitive pricing, subscription services, and promotional offers, making them an attractive option for cost-conscious shoppers. As digital infrastructure and logistics continue to improve, the online distribution channel is expected to witness substantial growth, making it the fastest-growing segment in the low fat peanut butter market leading up to 2032.
Low Fat Peanut Butter Market Segmentation
By Type
Crunchy
Cream
Others
By Distribution Channel
Online
Offline
Countries Analyzed
North America (US, Canada, Mexico)
Europe (Germany, UK, France, Spain, Italy, Russia, Rest of Europe)
Asia Pacific (China, India, Japan, South Korea, Australia, South East Asia, Rest of Asia)
South America (Brazil, Argentina, Rest of South America)
Middle East and Africa (Saudi Arabia, UAE, Rest of Middle East, South Africa, Egypt, Rest of Africa)
Low Fat Peanut Butter Companies Profiled in the Study
Algood Food Company Inc
Conagra Brands, Inc.
Del Monte Food Inc
Hormel Foods Corp
The J.M. Smucker Company
The Kraft Heinz Company
Unilever Plc
*- List Not Exhaustive
Chapter 1. TABLE OF CONTENTS
Chapter 2. Introduction to Low Fat Peanut Butter Market
2.1. Market Overview
2.2. Key Statistics and Report Highlights
2.3. Scope of the Comprehensive Study
2.3.1. Market Definition
2.3.2 Countries and Regions Covered
2.3.3 Research Objective
2.3.4 Units, Currency, and Conversions
2.3.5 Industry Value Chain
2.4. Key Market Segments
2.5. Key Companies
2.6. Study Period
Chapter 3. Strategic Analysis Review
3.1. Low Fat Peanut Butter Pricing Analysis and Forecast
3.2. Porter’s Five Forces
3.3. Market Ecosystem
3.4. SWOT Analysis
3.5. Regulatory Scenario
3.3. Effects of Inflation, Russia-Ukraine War, moderating economic growth, and other macroeconomic factors
Chapter 4. Competitive Landscape
4.1. Market Share Analysis
4.1.1. Global Low Fat Peanut Butter Market Share by Company, 2023
4.1.2. Product Offerings of Leading Low Fat Peanut Butter Companies
4.2. Market Entropy
4.2.1. New Product Launches in the Industry
4.2.2. Mergers, Acquisitions, Joint ventures, and Partnerships
4.3. Key Strategies and Best Practices
Chapter 5. Global Market Projections: Best, Reference, and Low Case Scenarios
5.1. Growth Analysis- Case Scenario Definitions
5.2. Low Growth Case Scenario Forecasts
5.3. Reference Growth Case Scenario Forecasts
5.4. High Growth Case Scenario Forecasts
Chapter 6. Market Dynamics
6.1. Low Fat Peanut Butter Market Drivers
6.2. Low Fat Peanut Butter Market Challenges
6.6. Low Fat Peanut Butter Market Opportunities
6.4. Low Fat Peanut Butter Market Trends
Chapter 7. Global Low Fat Peanut Butter Market Outlook Trends
7.1. Global Low Fat Peanut Butter Revenue (USD Million) and CAGR (%) by Type (2021-2032)
7.2. Global Low Fat Peanut Butter Revenue (USD Million) and CAGR (%) by Application (2021-2032)
7.3. Global Low Fat Peanut Butter Revenue (USD Million) and CAGR (%) by Product (2021-2032)
By Type
Crunchy
Cream
Others
By Distribution Channel
Online
Offline
Chapter 8. Global Low Fat Peanut Butter Regional Analysis and Outlook
8.1. Global Low Fat Peanut Butter Revenue (USD Million) By Regions (2021- 2032)
8.2. North America Low Fat Peanut Butter Revenue (USD Million) by Country (2021-2032)
8.2.1. United States Low Fat Peanut Butter Regional Analysis and Outlook
8.2.2. Canada Low Fat Peanut Butter Regional Analysis and Outlook
8.2.3. Mexico Low Fat Peanut Butter Regional Analysis and Outlook
8.3. Europe Low Fat Peanut Butter Revenue (USD Million), by Country (2021-2032)
8.3.1. Germany Low Fat Peanut Butter Regional Analysis and Outlook
8.3.2. France Low Fat Peanut Butter Regional Analysis and Outlook
8.3.3. United Kingdom Low Fat Peanut Butter Regional Analysis and Outlook
8.3.4. Spain Low Fat Peanut Butter Regional Analysis and Outlook
8.3.5. Italy Low Fat Peanut Butter Regional Analysis and Outlook
8.3.6. Russia Low Fat Peanut Butter Regional Analysis and Outlook
8.3.7. Rest of Europe Low Fat Peanut Butter Regional Analysis and Outlook
8.4. Asia Pacific Low Fat Peanut Butter Revenue (USD Million) by Country (2021-2032)
8.4.1. China Low Fat Peanut Butter Regional Analysis and Outlook
8.4.2. Japan Low Fat Peanut Butter Regional Analysis and Outlook
8.4.3. India Low Fat Peanut Butter Regional Analysis and Outlook
8.4.4. South Korea Low Fat Peanut Butter Regional Analysis and Outlook
8.4.5. Australia Low Fat Peanut Butter Regional Analysis and Outlook
8.4.6. South East Asia Low Fat Peanut Butter Regional Analysis and Outlook
8.4.7. Rest of Asia Pacific Low Fat Peanut Butter Regional Analysis and Outlook
8.5. South America Low Fat Peanut Butter Revenue (USD Million), by Country (2021-2032)
8.5.1. Brazil Low Fat Peanut Butter Regional Analysis and Outlook
8.5.2. Argentina Low Fat Peanut Butter Regional Analysis and Outlook
8.5.3. Rest of South America Low Fat Peanut Butter Regional Analysis and Outlook
8.6. Middle East and Africa Low Fat Peanut Butter Revenue (USD Million) by Country (2021-2032)
8.6.1. Middle East Low Fat Peanut Butter Regional Analysis and Outlook
8.6.2. Africa Low Fat Peanut Butter Regional Analysis and Outlook
Chapter 9. North America Low Fat Peanut Butter Analysis and Outlook
9.1. North America Low Fat Peanut Butter Revenue (USD Million) by Segments (2021-2032)
9.1.1. North America Low Fat Peanut Butter Revenue (USD Million) by Type (2021-2032)
9.1.2. North America Low Fat Peanut Butter Revenue (USD Million) by Application (2021-2032)
9.1.3. North America Low Fat Peanut Butter Revenue (USD Million) by Product (2021-2032)
By Type
Crunchy
Cream
Others
By Distribution Channel
Online
Offline
Chapter 10. Europe Low Fat Peanut Butter Analysis and Outlook
10.1. Europe Low Fat Peanut Butter Revenue (USD Million), by Segments (USD Million) (2021-2032)
10.1.1. Europe Low Fat Peanut Butter Revenue (USD Million) by Type (2021-2032)
10.1.2. Europe Low Fat Peanut Butter Revenue (USD Million) by Application (2021-2032)
10.1.3. Europe Low Fat Peanut Butter Revenue (USD Million) by Product (2021-2032)
By Type
Crunchy
Cream
Others
By Distribution Channel
Online
Offline
Chapter 11. Asia Pacific Low Fat Peanut Butter Analysis and Outlook
11.1. Asia Pacific Low Fat Peanut Butter Revenue (USD Million), and Revenue (USD Million) by Segments (2021-2032)
11.1.1. Asia Pacific Low Fat Peanut Butter Revenue (USD Million) by Type (2021-2032)
11.1.2. Asia Pacific Low Fat Peanut Butter Revenue (USD Million) by Application (2021-2032)
11.1.3. Asia Pacific Low Fat Peanut Butter Revenue (USD Million) by Product (2021-2032)
By Type
Crunchy
Cream
Others
By Distribution Channel
Online
Offline
Chapter 12. South America Low Fat Peanut Butter Analysis and Outlook
12.1. South America Low Fat Peanut Butter Revenue (USD Million), by Segments (2021-2032)
12.1.1. South America Low Fat Peanut Butter Revenue (USD Million) by Type (2021-2032)
12.1.2. South America Low Fat Peanut Butter Revenue (USD Million) by Application (2021-2032)
12.1.3. South America Low Fat Peanut Butter Revenue (USD Million) by Product (2021-2032)
By Type
Crunchy
Cream
Others
By Distribution Channel
Online
Offline
Chapter 13. Middle East and Africa Low Fat Peanut Butter Analysis and Outlook
13.1. Middle East and Africa Low Fat Peanut Butter Revenue (USD Million), by Segments (2021-2032)
13.1.1. Middle East and Africa Low Fat Peanut Butter Revenue (USD Million) by Type (2021-2032)
13.1.2. Middle East and Africa Low Fat Peanut Butter Revenue (USD Million) by Application (2021-2032)
13.1.3. Middle East and Africa Low Fat Peanut Butter Revenue (USD Million) by Product (2021-2032)
By Type
Crunchy
Cream
Others
By Distribution Channel
Online
Offline
Chapter 14. Low Fat Peanut Butter Company Profiles
14.1 Business Overview
14.2 Product Profiles
14.3 SWOT Profiles
14.5 Recent Developments
14.6 Financial Profile
List of Companies
Algood Food Company Inc
Conagra Brands, Inc.
Del Monte Food Inc
Hormel Foods Corp
The J.M. Smucker Company
The Kraft Heinz Company
Unilever Plc
15. Methodology and Data Sources
15.1 Customization Offerings
15.2 Subscription Services
15.3 Related Reports
15.4 Publisher Expertise
LIST OF TABLES
Table 1 Market Segmentation Analysis
Table 2 Global Low Fat Peanut Butter Market Share of Leading Companies, 2023
Table 3 Product Offerings of Leading Companies
Table 4 Low Growth Scenario Forecasts
Table 5 Reference Case Growth Scenario
Table 6 High Growth Case Scenario
Table 7 Global Low Fat Peanut Butter Revenue (USD Million) And CAGR (%) By Type (2021-2032)
Table 8 Global Low Fat Peanut Butter Revenue (USD Million) And CAGR (%) By Application (2021-2032)
Table 9 Global Low Fat Peanut Butter Revenue (USD Million) And CAGR (%) By Product (2021-2032)
Table 10 Global Low Fat Peanut Butter Market Revenue (USD Million) By Regions (2021-2032)
Table 11 Global Low Fat Peanut Butter Market Share (%) By Regions (2021-2032)
Table 12 North America Low Fat Peanut Butter Revenue (USD Million) By Country (2021-2032)
Table 13 Europe Low Fat Peanut Butter Revenue (USD Million) By Country (2021-2032)
Table 14 Asia Pacific Low Fat Peanut Butter Revenue (USD Million) By Country (2021-2032)
Table 15 South America Low Fat Peanut Butter Revenue (USD Million) By Country (2021-2032)
Table 16 Middle East and Africa Low Fat Peanut Butter Revenue (USD Million) By Region (2021-2032)
Table 17 North America Low Fat Peanut Butter Revenue (USD Million) By Type (2021-2032)
Table 18 North America Low Fat Peanut Butter Revenue (USD Million) By Application (2021-2032)
Table 19 North America Low Fat Peanut Butter Revenue (USD Million) By Product (2021-2032)
Table 20 Europe Low Fat Peanut Butter Revenue (USD Million) By Type (2021-2032)
Table 21 Europe Low Fat Peanut Butter Revenue (USD Million) By Application (2021-2032)
Table 22 Europe Low Fat Peanut Butter Revenue (USD Million) By Product (2021-2032)
Table 23 Asia Pacific Low Fat Peanut Butter Revenue (USD Million) By Type (2021-2032)
Table 24 Asia Pacific Low Fat Peanut Butter Revenue (USD Million) By Application (2021-2032)
Table 25 Asia Pacific Low Fat Peanut Butter Revenue (USD Million) By Product (2021-2032)
Table 26 South America Low Fat Peanut Butter Revenue (USD Million) By Type (2021-2032)
Table 27 South America Low Fat Peanut Butter Revenue (USD Million) By Application (2021-2032)
Table 28 South America Low Fat Peanut Butter Revenue (USD Million) By Product (2021-2032)
Table 29 Middle East and Africa Low Fat Peanut Butter Revenue (USD Million) By Type (2021-2032)
Table 30 Middle East and Africa Low Fat Peanut Butter Revenue (USD Million) By Application (2021-2032)
Table 31 Middle East and Africa Low Fat Peanut Butter Revenue (USD Million) By Product (2021-2032)
LIST OF FIGURES
Figure 1. Market Scope
Figure 2. Pricing Forecasts Per Unit, 2023- 2032
Figure 3. Porter’s Five Forces
Figure 4. Global Low Fat Peanut Butter Market Revenue (USD Million) By Regions (2021-2032)
Figure 5. Global Low Fat Peanut Butter Market Share (%) By Regions (2023)
Figure 6. North America Low Fat Peanut Butter Revenue (USD Million) By Country (2021-2032)
Figure 7. United States Low Fat Peanut Butter Revenue (USD Million) By Country (2021-2032)
Figure 8. Canada Low Fat Peanut Butter Revenue (USD Million) By Country (2021-2032)
Figure 9. Mexico Low Fat Peanut Butter Revenue (USD Million) By Country (2021-2032)
Figure 10. Europe Low Fat Peanut Butter Revenue (USD Million) By Country (2021-2032)
Figure 11. Germany Low Fat Peanut Butter Revenue (USD Million) By Country (2021-2032)
Figure 12. France Low Fat Peanut Butter Revenue (USD Million) By Country (2021-2032)
Figure 13. United Kingdom Low Fat Peanut Butter Revenue (USD Million) By Country (2021-2032)
Figure 14. Spain Low Fat Peanut Butter Revenue (USD Million) By Country (2021-2032)
Figure 15. Italy Low Fat Peanut Butter Revenue (USD Million) By Country (2021-2032)
Figure 16. Russia Low Fat Peanut Butter Revenue (USD Million) By Country (2021-2032)
Figure 17. Rest of Europe Low Fat Peanut Butter Revenue (USD Million) By Country (2021-2032)
Figure 11. Asia Pacific Low Fat Peanut Butter Revenue (USD Million) By Country (2021-2032)
Figure 12. China Low Fat Peanut Butter Revenue (USD Million) By Country (2021-2032)
Figure 13. Japan Low Fat Peanut Butter Revenue (USD Million) By Country (2021-2032)
Figure 14. India Low Fat Peanut Butter Revenue (USD Million) By Country (2021-2032)
Figure 15. South Korea Low Fat Peanut Butter Revenue (USD Million) By Country (2021-2032)
Figure 16. Australia Low Fat Peanut Butter Revenue (USD Million) By Country (2021-2032)
Figure 17. South East Asia Low Fat Peanut Butter Revenue (USD Million) By Country (2021-2032)
Figure 18. South America Low Fat Peanut Butter Revenue (USD Million) By Country (2021-2032)
Figure 19. Brazil Low Fat Peanut Butter Revenue (USD Million) By Country (2021-2032)
Figure 20. Argentina Low Fat Peanut Butter Revenue (USD Million) By Country (2021-2032)
Figure 21. Rest of Asia Pacific Low Fat Peanut Butter Revenue (USD Million) By Country (2021-2032)
Figure 22. Middle East and Africa Low Fat Peanut Butter Revenue (USD Million) By Region (2021-2032)
Figure 23. Saudi Arabia Low Fat Peanut Butter Revenue (USD Million) By Region (2021-2032)
Figure 24. The UAE Low Fat Peanut Butter Revenue (USD Million) By Region (2021-2032)
Figure 25. Rest of Middle East Low Fat Peanut Butter Revenue (USD Million) By Region (2021-2032)
Figure 26. South Africa Low Fat Peanut Butter Revenue (USD Million) By Region (2021-2032)
Figure 27. Africa Low Fat Peanut Butter Revenue (USD Million) By Region (2021-2032)
Figure 28. North America Low Fat Peanut Butter Revenue (USD Million) By Type (2021-2032)
Figure 29. North America Low Fat Peanut Butter Revenue (USD Million) By Application (2021-2032)
Figure 30. North America Low Fat Peanut Butter Revenue (USD Million) By Product (2021-2032)
Figure 31. Europe Low Fat Peanut Butter Revenue (USD Million) By Type (2021-2032)
Figure 32. Europe Low Fat Peanut Butter Revenue (USD Million) By Application (2021-2032)
Figure 33. Europe Low Fat Peanut Butter Revenue (USD Million) By Product (2021-2032)
Figure 34. Asia Pacific Low Fat Peanut Butter Revenue (USD Million) By Type (2021-2032)
Figure 35. Asia Pacific Low Fat Peanut Butter Revenue (USD Million) By Application (2021-2032)
Figure 36. Asia Pacific Low Fat Peanut Butter Revenue (USD Million) By Product (2021-2032)
Figure 37. South America Low Fat Peanut Butter Revenue (USD Million) By Type (2021-2032)
Figure 38. South America Low Fat Peanut Butter Revenue (USD Million) By Application (2021-2032)
Figure 39. South America Low Fat Peanut Butter Revenue (USD Million) By Product (2021-2032)
Figure 40. Middle East and Africa Low Fat Peanut Butter Revenue (USD Million) By Type (2021-2032)
Figure 41. Middle East and Africa Low Fat Peanut Butter Revenue (USD Million) By Application (2021-2032)
Figure 42. Middle East and Africa Low Fat Peanut Butter Revenue (USD Million) By Product (2021-2032)
By Type
Crunchy
Cream
Others
By Distribution Channel
Online
Offline
Countries Analyzed
North America (US, Canada, Mexico)
Europe (Germany, UK, France, Spain, Italy, Russia, Rest of Europe)
Asia Pacific (China, India, Japan, South Korea, Australia, South East Asia, Rest of Asia)
South America (Brazil, Argentina, Rest of South America)
Middle East and Africa (Saudi Arabia, UAE, Rest of Middle East, South Africa, Egypt, Rest of Africa)
