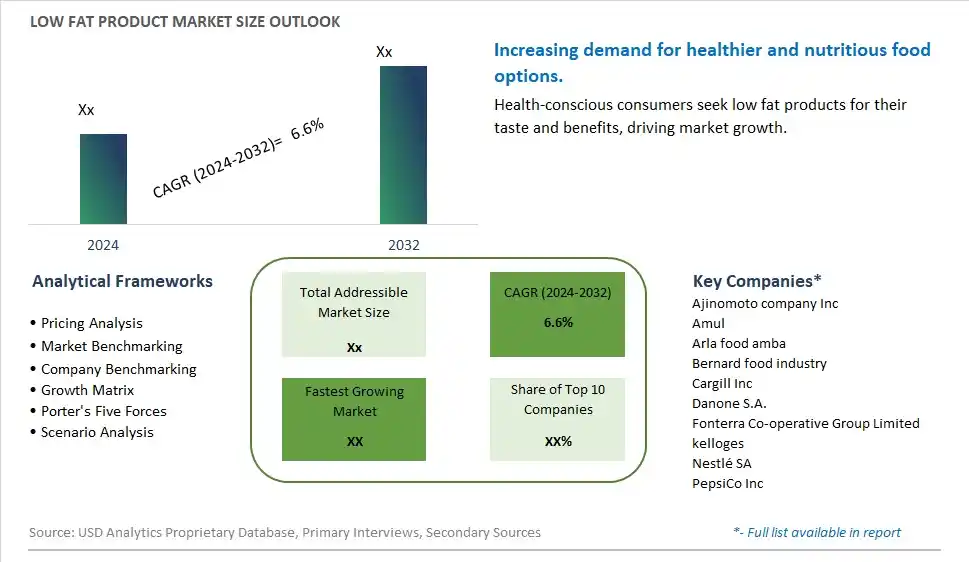
Global Low Fat Product Market Size is valued at $XX Million in 2024 and is forecast to register a growth rate (CAGR) of 6.6% to reach $XX Million by 2032.
The global Low Fat Product Market Comprehensive Study analyzes and forecasts the market size across 6 regions and 24 countries for diverse segments -By Type (Conventional, Organic), By Product (Low fat dairy, Low fat cereals, Low fat drinks, Low fat snacks, Others), By Distribution Channel (Hypermarkets/supermarkets, Convenience store, Specialty store, Online retail, Others)
An Introduction to Low Fat Product Market
In 2024, the low fat product market is thriving, fueled by the growing consumer interest in healthier eating habits and the demand for reduced-fat versions of traditional foods. The market encompasses a wide range of products, including dairy, snacks, and ready meals, formulated to offer lower fat content without compromising on taste. The market benefits from advancements in food science and ingredient innovation, which enhance product quality and appeal. The trend towards clean label and natural ingredients is influencing market dynamics. Increasing awareness of diet-related health issues and the popularity of weight management programs are further supporting market growth.
Low Fat Product Competitive Landscape
The market report analyses the leading companies in the industry including Ajinomoto company Inc, Amul, Arla food amba, Bernard food industry, Cargill Inc, Danone S.A., Fonterra Co-operative Group Limited, kelloges, Nestlé SA, PepsiCo Inc, and Others.
Low Fat Product Market Dynamics
Low Fat Product Market Trend: Growing Demand for Low-Fat Foods Across Categories
The most prominent trend in the Low Fat Product Market is the growing demand for low-fat foods across various categories. Consumers are increasingly seeking products that offer the taste and satisfaction of traditional foods with reduced fat content. This trend is driven by the desire to balance indulgence with health and wellness goals, leading to a rise in low-fat product offerings.
Low Fat Product Market Driver: Health Consciousness and Focus on Weight Management
A key driver in the Low Fat Product Market is health consciousness and a focus on weight management. As more individuals adopt healthier eating habits and focus on reducing their fat intake, there is a rising demand for low-fat foods that align with these health goals. Low-fat products, which provide lighter and more nutritious options, cater to this demand and support market growth.
Low Fat Product Market Opportunity: Innovation in Ingredients and Formulations
One significant opportunity in the Low Fat Product Market lies in innovation in ingredients and formulations. Companies can develop new low-fat products using alternative ingredients, such as high-fiber flours, natural sweeteners, and plant-based proteins, to create healthier versions of traditional foods. By offering diverse and nutritious options, manufacturers can attract health-conscious consumers and expand their product offerings.
Low Fat Product Market Share Analysis: Conventional segment generated the highest revenue share in the industry
The largest segment in the Low Fat Product Market by type is the Conventional segment. Conventional low fat products dominate the market due to their widespread availability and affordability. These products are produced using traditional farming and manufacturing practices, making them accessible to a broad range of consumers. Conventional low fat products are commonly found in supermarkets, convenience stores, and other retail outlets, providing easy access for consumers seeking to reduce their fat intake. The familiarity and trust associated with conventional products contribute to their strong market presence. Additionally, the cost-effectiveness of conventional low fat products compared to organic alternatives makes them an attractive option for budget-conscious consumers. The extensive distribution network and consumer acceptance ensure that conventional low fat products remain the largest segment in the market.
Low Fat Product Market Share Analysis: Low Fat Snacks is the fastest growing segment over the forecast period to 2032
The fastest-growing segment in the Low Fat Product Market by product is the Low Fat Snacks segment. The increasing consumer demand for convenient and healthy snacking options is driving the growth of this segment. Low fat snacks, such as baked chips, low-calorie popcorn, and vegetable crisps, provide a healthier alternative to traditional high-fat snacks, catering to the rising health consciousness among consumers. The appeal of low fat snacks lies in their ability to offer satisfying taste and texture while reducing fat and calorie content, making them ideal for weight management and healthy eating. The snack industry's continuous innovation in flavor and product variety further boosts the popularity of low fat snacks. As consumers continue to prioritize health and wellness, the demand for low fat snacks is expected to grow significantly, making this segment the fastest-growing in the low fat product market leading up to 2032.
Low Fat Product Market Share Analysis: Hypermarkets/Supermarkets segment generated the highest revenue share in the industry
The largest segment in the Low Fat Product Market by distribution channel is the Hypermarkets/Supermarkets segment. Hypermarkets and supermarkets are the primary retail channels for low fat products due to their extensive reach, wide product range, and convenience. These large retail outlets offer consumers a one-stop shopping experience where they can find a variety of low fat products, including dairy, snacks, drinks, and cereals, all in one place. The ability to physically inspect products, read nutritional labels, and compare different brands in-store adds to their appeal. Additionally, hypermarkets and supermarkets often run promotional campaigns, discounts, and loyalty programs that attract health-conscious shoppers looking for value deals. The strategic location of these stores in urban and suburban areas ensures high foot traffic and accessibility, further cementing their dominance in the market. The comprehensive selection and convenience offered by hypermarkets and supermarkets make them the largest segment in the distribution of low fat products.
Low Fat Product Market Segmentation
By Type
Conventional
Organic
By Product
Low fat dairy
Low fat cereals
Low fat drinks
Low fat snacks
Others
By Distribution Channel
Hypermarkets/supermarkets
Convenience store
Specialty store
Online retail
Others
Countries Analyzed
North America (US, Canada, Mexico)
Europe (Germany, UK, France, Spain, Italy, Russia, Rest of Europe)
Asia Pacific (China, India, Japan, South Korea, Australia, South East Asia, Rest of Asia)
South America (Brazil, Argentina, Rest of South America)
Middle East and Africa (Saudi Arabia, UAE, Rest of Middle East, South Africa, Egypt, Rest of Africa)
Low Fat Product Companies Profiled in the Study
Ajinomoto company Inc
Amul
Arla food amba
Bernard food industry
Cargill Inc
Danone S.A.
Fonterra Co-operative Group Limited
kelloges
Nestlé SA
PepsiCo Inc
*- List Not Exhaustive
Chapter 1. TABLE OF CONTENTS
Chapter 2. Introduction to Low Fat Product Market
2.1. Market Overview
2.2. Key Statistics and Report Highlights
2.3. Scope of the Comprehensive Study
2.3.1. Market Definition
2.3.2 Countries and Regions Covered
2.3.3 Research Objective
2.3.4 Units, Currency, and Conversions
2.3.5 Industry Value Chain
2.4. Key Market Segments
2.5. Key Companies
2.6. Study Period
Chapter 3. Strategic Analysis Review
3.1. Low Fat Product Pricing Analysis and Forecast
3.2. Porter’s Five Forces
3.3. Market Ecosystem
3.4. SWOT Analysis
3.5. Regulatory Scenario
3.3. Effects of Inflation, Russia-Ukraine War, moderating economic growth, and other macroeconomic factors
Chapter 4. Competitive Landscape
4.1. Market Share Analysis
4.1.1. Global Low Fat Product Market Share by Company, 2023
4.1.2. Product Offerings of Leading Low Fat Product Companies
4.2. Market Entropy
4.2.1. New Product Launches in the Industry
4.2.2. Mergers, Acquisitions, Joint ventures, and Partnerships
4.3. Key Strategies and Best Practices
Chapter 5. Global Market Projections: Best, Reference, and Low Case Scenarios
5.1. Growth Analysis- Case Scenario Definitions
5.2. Low Growth Case Scenario Forecasts
5.3. Reference Growth Case Scenario Forecasts
5.4. High Growth Case Scenario Forecasts
Chapter 6. Market Dynamics
6.1. Low Fat Product Market Drivers
6.2. Low Fat Product Market Challenges
6.6. Low Fat Product Market Opportunities
6.4. Low Fat Product Market Trends
Chapter 7. Global Low Fat Product Market Outlook Trends
7.1. Global Low Fat Product Revenue (USD Million) and CAGR (%) by Type (2021-2032)
7.2. Global Low Fat Product Revenue (USD Million) and CAGR (%) by Application (2021-2032)
7.3. Global Low Fat Product Revenue (USD Million) and CAGR (%) by Product (2021-2032)
By Type
Conventional
Organic
By Product
Low fat dairy
Low fat cereals
Low fat drinks
Low fat snacks
Others
By Distribution Channel
Hypermarkets/supermarkets
Convenience store
Specialty store
Online retail
Others
Chapter 8. Global Low Fat Product Regional Analysis and Outlook
8.1. Global Low Fat Product Revenue (USD Million) By Regions (2021- 2032)
8.2. North America Low Fat Product Revenue (USD Million) by Country (2021-2032)
8.2.1. United States Low Fat Product Regional Analysis and Outlook
8.2.2. Canada Low Fat Product Regional Analysis and Outlook
8.2.3. Mexico Low Fat Product Regional Analysis and Outlook
8.3. Europe Low Fat Product Revenue (USD Million), by Country (2021-2032)
8.3.1. Germany Low Fat Product Regional Analysis and Outlook
8.3.2. France Low Fat Product Regional Analysis and Outlook
8.3.3. United Kingdom Low Fat Product Regional Analysis and Outlook
8.3.4. Spain Low Fat Product Regional Analysis and Outlook
8.3.5. Italy Low Fat Product Regional Analysis and Outlook
8.3.6. Russia Low Fat Product Regional Analysis and Outlook
8.3.7. Rest of Europe Low Fat Product Regional Analysis and Outlook
8.4. Asia Pacific Low Fat Product Revenue (USD Million) by Country (2021-2032)
8.4.1. China Low Fat Product Regional Analysis and Outlook
8.4.2. Japan Low Fat Product Regional Analysis and Outlook
8.4.3. India Low Fat Product Regional Analysis and Outlook
8.4.4. South Korea Low Fat Product Regional Analysis and Outlook
8.4.5. Australia Low Fat Product Regional Analysis and Outlook
8.4.6. South East Asia Low Fat Product Regional Analysis and Outlook
8.4.7. Rest of Asia Pacific Low Fat Product Regional Analysis and Outlook
8.5. South America Low Fat Product Revenue (USD Million), by Country (2021-2032)
8.5.1. Brazil Low Fat Product Regional Analysis and Outlook
8.5.2. Argentina Low Fat Product Regional Analysis and Outlook
8.5.3. Rest of South America Low Fat Product Regional Analysis and Outlook
8.6. Middle East and Africa Low Fat Product Revenue (USD Million) by Country (2021-2032)
8.6.1. Middle East Low Fat Product Regional Analysis and Outlook
8.6.2. Africa Low Fat Product Regional Analysis and Outlook
Chapter 9. North America Low Fat Product Analysis and Outlook
9.1. North America Low Fat Product Revenue (USD Million) by Segments (2021-2032)
9.1.1. North America Low Fat Product Revenue (USD Million) by Type (2021-2032)
9.1.2. North America Low Fat Product Revenue (USD Million) by Application (2021-2032)
9.1.3. North America Low Fat Product Revenue (USD Million) by Product (2021-2032)
By Type
Conventional
Organic
By Product
Low fat dairy
Low fat cereals
Low fat drinks
Low fat snacks
Others
By Distribution Channel
Hypermarkets/supermarkets
Convenience store
Specialty store
Online retail
Others
Chapter 10. Europe Low Fat Product Analysis and Outlook
10.1. Europe Low Fat Product Revenue (USD Million), by Segments (USD Million) (2021-2032)
10.1.1. Europe Low Fat Product Revenue (USD Million) by Type (2021-2032)
10.1.2. Europe Low Fat Product Revenue (USD Million) by Application (2021-2032)
10.1.3. Europe Low Fat Product Revenue (USD Million) by Product (2021-2032)
By Type
Conventional
Organic
By Product
Low fat dairy
Low fat cereals
Low fat drinks
Low fat snacks
Others
By Distribution Channel
Hypermarkets/supermarkets
Convenience store
Specialty store
Online retail
Others
Chapter 11. Asia Pacific Low Fat Product Analysis and Outlook
11.1. Asia Pacific Low Fat Product Revenue (USD Million), and Revenue (USD Million) by Segments (2021-2032)
11.1.1. Asia Pacific Low Fat Product Revenue (USD Million) by Type (2021-2032)
11.1.2. Asia Pacific Low Fat Product Revenue (USD Million) by Application (2021-2032)
11.1.3. Asia Pacific Low Fat Product Revenue (USD Million) by Product (2021-2032)
By Type
Conventional
Organic
By Product
Low fat dairy
Low fat cereals
Low fat drinks
Low fat snacks
Others
By Distribution Channel
Hypermarkets/supermarkets
Convenience store
Specialty store
Online retail
Others
Chapter 12. South America Low Fat Product Analysis and Outlook
12.1. South America Low Fat Product Revenue (USD Million), by Segments (2021-2032)
12.1.1. South America Low Fat Product Revenue (USD Million) by Type (2021-2032)
12.1.2. South America Low Fat Product Revenue (USD Million) by Application (2021-2032)
12.1.3. South America Low Fat Product Revenue (USD Million) by Product (2021-2032)
By Type
Conventional
Organic
By Product
Low fat dairy
Low fat cereals
Low fat drinks
Low fat snacks
Others
By Distribution Channel
Hypermarkets/supermarkets
Convenience store
Specialty store
Online retail
Others
Chapter 13. Middle East and Africa Low Fat Product Analysis and Outlook
13.1. Middle East and Africa Low Fat Product Revenue (USD Million), by Segments (2021-2032)
13.1.1. Middle East and Africa Low Fat Product Revenue (USD Million) by Type (2021-2032)
13.1.2. Middle East and Africa Low Fat Product Revenue (USD Million) by Application (2021-2032)
13.1.3. Middle East and Africa Low Fat Product Revenue (USD Million) by Product (2021-2032)
By Type
Conventional
Organic
By Product
Low fat dairy
Low fat cereals
Low fat drinks
Low fat snacks
Others
By Distribution Channel
Hypermarkets/supermarkets
Convenience store
Specialty store
Online retail
Others
Chapter 14. Low Fat Product Company Profiles
14.1 Business Overview
14.2 Product Profiles
14.3 SWOT Profiles
14.5 Recent Developments
14.6 Financial Profile
List of Companies
Ajinomoto company Inc
Amul
Arla food amba
Bernard food industry
Cargill Inc
Danone S.A.
Fonterra Co-operative Group Limited
kelloges
Nestlé SA
PepsiCo Inc
15. Methodology and Data Sources
15.1 Customization Offerings
15.2 Subscription Services
15.3 Related Reports
15.4 Publisher Expertise
LIST OF TABLES
Table 1 Market Segmentation Analysis
Table 2 Global Low Fat Product Market Share of Leading Companies, 2023
Table 3 Product Offerings of Leading Companies
Table 4 Low Growth Scenario Forecasts
Table 5 Reference Case Growth Scenario
Table 6 High Growth Case Scenario
Table 7 Global Low Fat Product Revenue (USD Million) And CAGR (%) By Type (2021-2032)
Table 8 Global Low Fat Product Revenue (USD Million) And CAGR (%) By Application (2021-2032)
Table 9 Global Low Fat Product Revenue (USD Million) And CAGR (%) By Product (2021-2032)
Table 10 Global Low Fat Product Market Revenue (USD Million) By Regions (2021-2032)
Table 11 Global Low Fat Product Market Share (%) By Regions (2021-2032)
Table 12 North America Low Fat Product Revenue (USD Million) By Country (2021-2032)
Table 13 Europe Low Fat Product Revenue (USD Million) By Country (2021-2032)
Table 14 Asia Pacific Low Fat Product Revenue (USD Million) By Country (2021-2032)
Table 15 South America Low Fat Product Revenue (USD Million) By Country (2021-2032)
Table 16 Middle East and Africa Low Fat Product Revenue (USD Million) By Region (2021-2032)
Table 17 North America Low Fat Product Revenue (USD Million) By Type (2021-2032)
Table 18 North America Low Fat Product Revenue (USD Million) By Application (2021-2032)
Table 19 North America Low Fat Product Revenue (USD Million) By Product (2021-2032)
Table 20 Europe Low Fat Product Revenue (USD Million) By Type (2021-2032)
Table 21 Europe Low Fat Product Revenue (USD Million) By Application (2021-2032)
Table 22 Europe Low Fat Product Revenue (USD Million) By Product (2021-2032)
Table 23 Asia Pacific Low Fat Product Revenue (USD Million) By Type (2021-2032)
Table 24 Asia Pacific Low Fat Product Revenue (USD Million) By Application (2021-2032)
Table 25 Asia Pacific Low Fat Product Revenue (USD Million) By Product (2021-2032)
Table 26 South America Low Fat Product Revenue (USD Million) By Type (2021-2032)
Table 27 South America Low Fat Product Revenue (USD Million) By Application (2021-2032)
Table 28 South America Low Fat Product Revenue (USD Million) By Product (2021-2032)
Table 29 Middle East and Africa Low Fat Product Revenue (USD Million) By Type (2021-2032)
Table 30 Middle East and Africa Low Fat Product Revenue (USD Million) By Application (2021-2032)
Table 31 Middle East and Africa Low Fat Product Revenue (USD Million) By Product (2021-2032)
LIST OF FIGURES
Figure 1. Market Scope
Figure 2. Pricing Forecasts Per Unit, 2023- 2032
Figure 3. Porter’s Five Forces
Figure 4. Global Low Fat Product Market Revenue (USD Million) By Regions (2021-2032)
Figure 5. Global Low Fat Product Market Share (%) By Regions (2023)
Figure 6. North America Low Fat Product Revenue (USD Million) By Country (2021-2032)
Figure 7. United States Low Fat Product Revenue (USD Million) By Country (2021-2032)
Figure 8. Canada Low Fat Product Revenue (USD Million) By Country (2021-2032)
Figure 9. Mexico Low Fat Product Revenue (USD Million) By Country (2021-2032)
Figure 10. Europe Low Fat Product Revenue (USD Million) By Country (2021-2032)
Figure 11. Germany Low Fat Product Revenue (USD Million) By Country (2021-2032)
Figure 12. France Low Fat Product Revenue (USD Million) By Country (2021-2032)
Figure 13. United Kingdom Low Fat Product Revenue (USD Million) By Country (2021-2032)
Figure 14. Spain Low Fat Product Revenue (USD Million) By Country (2021-2032)
Figure 15. Italy Low Fat Product Revenue (USD Million) By Country (2021-2032)
Figure 16. Russia Low Fat Product Revenue (USD Million) By Country (2021-2032)
Figure 17. Rest of Europe Low Fat Product Revenue (USD Million) By Country (2021-2032)
Figure 11. Asia Pacific Low Fat Product Revenue (USD Million) By Country (2021-2032)
Figure 12. China Low Fat Product Revenue (USD Million) By Country (2021-2032)
Figure 13. Japan Low Fat Product Revenue (USD Million) By Country (2021-2032)
Figure 14. India Low Fat Product Revenue (USD Million) By Country (2021-2032)
Figure 15. South Korea Low Fat Product Revenue (USD Million) By Country (2021-2032)
Figure 16. Australia Low Fat Product Revenue (USD Million) By Country (2021-2032)
Figure 17. South East Asia Low Fat Product Revenue (USD Million) By Country (2021-2032)
Figure 18. South America Low Fat Product Revenue (USD Million) By Country (2021-2032)
Figure 19. Brazil Low Fat Product Revenue (USD Million) By Country (2021-2032)
Figure 20. Argentina Low Fat Product Revenue (USD Million) By Country (2021-2032)
Figure 21. Rest of Asia Pacific Low Fat Product Revenue (USD Million) By Country (2021-2032)
Figure 22. Middle East and Africa Low Fat Product Revenue (USD Million) By Region (2021-2032)
Figure 23. Saudi Arabia Low Fat Product Revenue (USD Million) By Region (2021-2032)
Figure 24. The UAE Low Fat Product Revenue (USD Million) By Region (2021-2032)
Figure 25. Rest of Middle East Low Fat Product Revenue (USD Million) By Region (2021-2032)
Figure 26. South Africa Low Fat Product Revenue (USD Million) By Region (2021-2032)
Figure 27. Africa Low Fat Product Revenue (USD Million) By Region (2021-2032)
Figure 28. North America Low Fat Product Revenue (USD Million) By Type (2021-2032)
Figure 29. North America Low Fat Product Revenue (USD Million) By Application (2021-2032)
Figure 30. North America Low Fat Product Revenue (USD Million) By Product (2021-2032)
Figure 31. Europe Low Fat Product Revenue (USD Million) By Type (2021-2032)
Figure 32. Europe Low Fat Product Revenue (USD Million) By Application (2021-2032)
Figure 33. Europe Low Fat Product Revenue (USD Million) By Product (2021-2032)
Figure 34. Asia Pacific Low Fat Product Revenue (USD Million) By Type (2021-2032)
Figure 35. Asia Pacific Low Fat Product Revenue (USD Million) By Application (2021-2032)
Figure 36. Asia Pacific Low Fat Product Revenue (USD Million) By Product (2021-2032)
Figure 37. South America Low Fat Product Revenue (USD Million) By Type (2021-2032)
Figure 38. South America Low Fat Product Revenue (USD Million) By Application (2021-2032)
Figure 39. South America Low Fat Product Revenue (USD Million) By Product (2021-2032)
Figure 40. Middle East and Africa Low Fat Product Revenue (USD Million) By Type (2021-2032)
Figure 41. Middle East and Africa Low Fat Product Revenue (USD Million) By Application (2021-2032)
Figure 42. Middle East and Africa Low Fat Product Revenue (USD Million) By Product (2021-2032)
By Type
Conventional
Organic
By Product
Low fat dairy
Low fat cereals
Low fat drinks
Low fat snacks
Others
By Distribution Channel
Hypermarkets/supermarkets
Convenience store
Specialty store
Online retail
Others
Countries Analyzed
North America (US, Canada, Mexico)
Europe (Germany, UK, France, Spain, Italy, Russia, Rest of Europe)
Asia Pacific (China, India, Japan, South Korea, Australia, South East Asia, Rest of Asia)
South America (Brazil, Argentina, Rest of South America)
Middle East and Africa (Saudi Arabia, UAE, Rest of Middle East, South Africa, Egypt, Rest of Africa)
