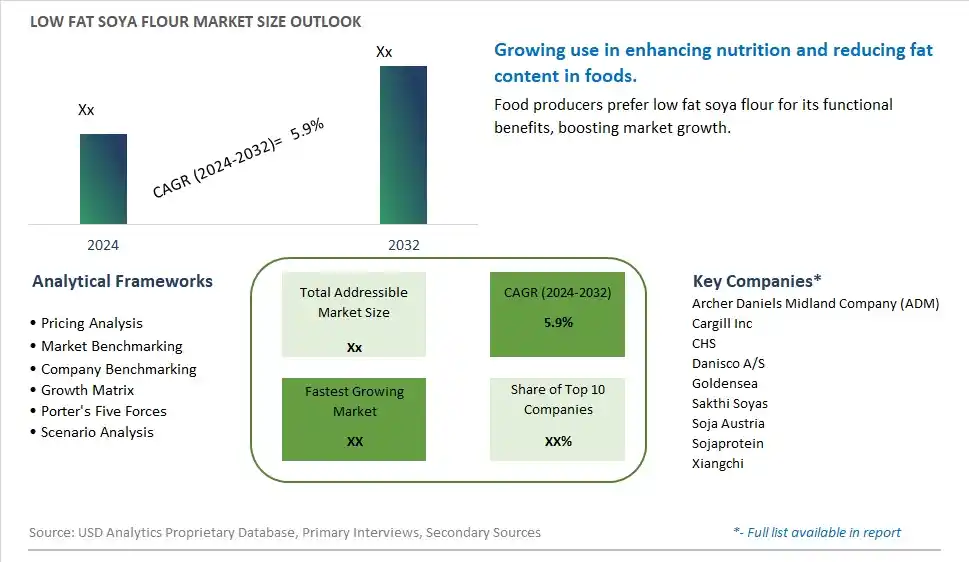
Global Low Fat Soya Flour Market Size is valued at $XX Million in 2024 and is forecast to register a growth rate (CAGR) of 5.9% to reach $XX Million by 2032.
The global Low Fat Soya Flour Market Comprehensive Study analyzes and forecasts the market size across 6 regions and 24 countries for diverse segments -By Type (Low Denatured, High Denatured), By Application (Bakery Products, Dried Milk, Meat Analogues, Health Products, Others)
An Introduction to Low Fat Soya Flour Market
The low fat soya flour market in 2024 is expanding, driven by the demand for high-protein, low-fat ingredients in food manufacturing and home cooking. Low fat soya flour, derived from defatted soybeans, is valued for its high protein content, versatility, and use in various applications, including baking, meat alternatives, and nutritional supplements. The market benefits from innovations in soy processing and flour formulation that enhance product functionality and nutritional profile. The trend towards plant-based diets and clean label ingredients is influencing product development. Increasing consumer interest in high-protein, low-fat foods is further supporting market growth.
Low Fat Soya Flour Competitive Landscape
The market report analyses the leading companies in the industry including Archer Daniels Midland Company (ADM), Cargill Inc, CHS, Danisco A/S, Goldensea, Sakthi Soyas, Soja Austria, Sojaprotein, Xiangchi, and Others.
Low Fat Soya Flour Market Dynamics
Low Fat Soya Flour Market Trend: Rising Demand for Healthier Flour Alternatives
The most prominent trend in the Low Fat Soya Flour Market is the rising demand for healthier flour alternatives. Consumers are increasingly seeking flour options that offer the nutritional benefits of soy with reduced fat content, driven by a growing focus on health and wellness. This trend is evident in the expanding range of low-fat soy flour products available on the market.
Low Fat Soya Flour Market Driver: Increasing Health Consciousness
A key driver in the Low Fat Soya Flour Market is increasing health consciousness among consumers. As people become more aware of the link between diet and health, there is a greater demand for foods that support weight management and overall well-being. Low-fat soy flour, which is high in protein and low in fat, caters to this demand and supports market growth.
Low Fat Soya Flour Market Opportunity: Development of New Product Applications
One significant opportunity in the Low Fat Soya Flour Market lies in the development of new product applications. Companies can innovate by incorporating low-fat soy flour into a variety of food products, such as baked goods, snacks, and meat substitutes. By expanding the use of low-fat soy flour in different food categories, manufacturers can attract health-conscious consumers and drive market growth .
Low Fat Soya Flour Market Share Analysis: High Denatured segment generated the highest revenue share in the industry
The largest segment in the Low Fat Soya Flour Market by type is the High Denatured segment. High denatured low fat soya flour is widely used due to its enhanced functional properties, including improved solubility, water absorption, and emulsification. These properties make it highly suitable for various applications in the food industry, particularly in the production of processed foods where texture, consistency, and stability are crucial. High denatured soya flour is extensively used in meat analogues, health products, and bakery items to improve their nutritional profile and functional characteristics. The widespread adoption of high denatured soya flour in these applications, driven by its superior functional properties, ensures its dominance as the largest segment in the low fat soya flour market.
Low Fat Soya Flour Market Share Analysis: Meat Analogues is the fastest growing segment over the forecast period to 2032
The fastest-growing segment in the Low Fat Soya Flour Market by application is the Meat Analogues segment. The rising demand for plant-based meat alternatives is the primary driver of this segment's rapid growth. Consumers are increasingly turning to meat analogues for health, ethical, and environmental reasons, seeking products that mimic the texture and taste of meat without the associated health risks and environmental impact. Low fat soya flour is a key ingredient in the production of meat analogues due to its high protein content, excellent binding properties, and ability to enhance the texture and juiciness of these products. The growing popularity of vegetarian and vegan diets, along with the increasing awareness of the benefits of plant-based proteins, is fueling the demand for meat analogues. As food manufacturers continue to innovate and expand their plant-based product lines, the use of low fat soya flour in meat analogues is expected to see significant growth, making this application the fastest-growing segment in the low fat soya flour market leading up to 2032.
Low Fat Soya Flour Market Segmentation
By Type
Low Denatured
High Denatured
By Application
Bakery Products
Dried Milk
Meat Analogues
Health Products
Others
Countries Analyzed
North America (US, Canada, Mexico)
Europe (Germany, UK, France, Spain, Italy, Russia, Rest of Europe)
Asia Pacific (China, India, Japan, South Korea, Australia, South East Asia, Rest of Asia)
South America (Brazil, Argentina, Rest of South America)
Middle East and Africa (Saudi Arabia, UAE, Rest of Middle East, South Africa, Egypt, Rest of Africa)
Low Fat Soya Flour Companies Profiled in the Study
Archer Daniels Midland Company (ADM)
Cargill Inc
CHS
Danisco A/S
Goldensea
Sakthi Soyas
Soja Austria
Sojaprotein
Xiangchi
*- List Not Exhaustive
Chapter 1. TABLE OF CONTENTS
Chapter 2. Introduction to Low Fat Soya Flour Market
2.1. Market Overview
2.2. Key Statistics and Report Highlights
2.3. Scope of the Comprehensive Study
2.3.1. Market Definition
2.3.2 Countries and Regions Covered
2.3.3 Research Objective
2.3.4 Units, Currency, and Conversions
2.3.5 Industry Value Chain
2.4. Key Market Segments
2.5. Key Companies
2.6. Study Period
Chapter 3. Strategic Analysis Review
3.1. Low Fat Soya Flour Pricing Analysis and Forecast
3.2. Porter’s Five Forces
3.3. Market Ecosystem
3.4. SWOT Analysis
3.5. Regulatory Scenario
3.3. Effects of Inflation, Russia-Ukraine War, moderating economic growth, and other macroeconomic factors
Chapter 4. Competitive Landscape
4.1. Market Share Analysis
4.1.1. Global Low Fat Soya Flour Market Share by Company, 2023
4.1.2. Product Offerings of Leading Low Fat Soya Flour Companies
4.2. Market Entropy
4.2.1. New Product Launches in the Industry
4.2.2. Mergers, Acquisitions, Joint ventures, and Partnerships
4.3. Key Strategies and Best Practices
Chapter 5. Global Market Projections: Best, Reference, and Low Case Scenarios
5.1. Growth Analysis- Case Scenario Definitions
5.2. Low Growth Case Scenario Forecasts
5.3. Reference Growth Case Scenario Forecasts
5.4. High Growth Case Scenario Forecasts
Chapter 6. Market Dynamics
6.1. Low Fat Soya Flour Market Drivers
6.2. Low Fat Soya Flour Market Challenges
6.6. Low Fat Soya Flour Market Opportunities
6.4. Low Fat Soya Flour Market Trends
Chapter 7. Global Low Fat Soya Flour Market Outlook Trends
7.1. Global Low Fat Soya Flour Revenue (USD Million) and CAGR (%) by Type (2021-2032)
7.2. Global Low Fat Soya Flour Revenue (USD Million) and CAGR (%) by Application (2021-2032)
7.3. Global Low Fat Soya Flour Revenue (USD Million) and CAGR (%) by Product (2021-2032)
By Type
Low Denatured
High Denatured
By Application
Bakery Products
Dried Milk
Meat Analogues
Health Products
Others
Chapter 8. Global Low Fat Soya Flour Regional Analysis and Outlook
8.1. Global Low Fat Soya Flour Revenue (USD Million) By Regions (2021- 2032)
8.2. North America Low Fat Soya Flour Revenue (USD Million) by Country (2021-2032)
8.2.1. United States Low Fat Soya Flour Regional Analysis and Outlook
8.2.2. Canada Low Fat Soya Flour Regional Analysis and Outlook
8.2.3. Mexico Low Fat Soya Flour Regional Analysis and Outlook
8.3. Europe Low Fat Soya Flour Revenue (USD Million), by Country (2021-2032)
8.3.1. Germany Low Fat Soya Flour Regional Analysis and Outlook
8.3.2. France Low Fat Soya Flour Regional Analysis and Outlook
8.3.3. United Kingdom Low Fat Soya Flour Regional Analysis and Outlook
8.3.4. Spain Low Fat Soya Flour Regional Analysis and Outlook
8.3.5. Italy Low Fat Soya Flour Regional Analysis and Outlook
8.3.6. Russia Low Fat Soya Flour Regional Analysis and Outlook
8.3.7. Rest of Europe Low Fat Soya Flour Regional Analysis and Outlook
8.4. Asia Pacific Low Fat Soya Flour Revenue (USD Million) by Country (2021-2032)
8.4.1. China Low Fat Soya Flour Regional Analysis and Outlook
8.4.2. Japan Low Fat Soya Flour Regional Analysis and Outlook
8.4.3. India Low Fat Soya Flour Regional Analysis and Outlook
8.4.4. South Korea Low Fat Soya Flour Regional Analysis and Outlook
8.4.5. Australia Low Fat Soya Flour Regional Analysis and Outlook
8.4.6. South East Asia Low Fat Soya Flour Regional Analysis and Outlook
8.4.7. Rest of Asia Pacific Low Fat Soya Flour Regional Analysis and Outlook
8.5. South America Low Fat Soya Flour Revenue (USD Million), by Country (2021-2032)
8.5.1. Brazil Low Fat Soya Flour Regional Analysis and Outlook
8.5.2. Argentina Low Fat Soya Flour Regional Analysis and Outlook
8.5.3. Rest of South America Low Fat Soya Flour Regional Analysis and Outlook
8.6. Middle East and Africa Low Fat Soya Flour Revenue (USD Million) by Country (2021-2032)
8.6.1. Middle East Low Fat Soya Flour Regional Analysis and Outlook
8.6.2. Africa Low Fat Soya Flour Regional Analysis and Outlook
Chapter 9. North America Low Fat Soya Flour Analysis and Outlook
9.1. North America Low Fat Soya Flour Revenue (USD Million) by Segments (2021-2032)
9.1.1. North America Low Fat Soya Flour Revenue (USD Million) by Type (2021-2032)
9.1.2. North America Low Fat Soya Flour Revenue (USD Million) by Application (2021-2032)
9.1.3. North America Low Fat Soya Flour Revenue (USD Million) by Product (2021-2032)
By Type
Low Denatured
High Denatured
By Application
Bakery Products
Dried Milk
Meat Analogues
Health Products
Others
Chapter 10. Europe Low Fat Soya Flour Analysis and Outlook
10.1. Europe Low Fat Soya Flour Revenue (USD Million), by Segments (USD Million) (2021-2032)
10.1.1. Europe Low Fat Soya Flour Revenue (USD Million) by Type (2021-2032)
10.1.2. Europe Low Fat Soya Flour Revenue (USD Million) by Application (2021-2032)
10.1.3. Europe Low Fat Soya Flour Revenue (USD Million) by Product (2021-2032)
By Type
Low Denatured
High Denatured
By Application
Bakery Products
Dried Milk
Meat Analogues
Health Products
Others
Chapter 11. Asia Pacific Low Fat Soya Flour Analysis and Outlook
11.1. Asia Pacific Low Fat Soya Flour Revenue (USD Million), and Revenue (USD Million) by Segments (2021-2032)
11.1.1. Asia Pacific Low Fat Soya Flour Revenue (USD Million) by Type (2021-2032)
11.1.2. Asia Pacific Low Fat Soya Flour Revenue (USD Million) by Application (2021-2032)
11.1.3. Asia Pacific Low Fat Soya Flour Revenue (USD Million) by Product (2021-2032)
By Type
Low Denatured
High Denatured
By Application
Bakery Products
Dried Milk
Meat Analogues
Health Products
Others
Chapter 12. South America Low Fat Soya Flour Analysis and Outlook
12.1. South America Low Fat Soya Flour Revenue (USD Million), by Segments (2021-2032)
12.1.1. South America Low Fat Soya Flour Revenue (USD Million) by Type (2021-2032)
12.1.2. South America Low Fat Soya Flour Revenue (USD Million) by Application (2021-2032)
12.1.3. South America Low Fat Soya Flour Revenue (USD Million) by Product (2021-2032)
By Type
Low Denatured
High Denatured
By Application
Bakery Products
Dried Milk
Meat Analogues
Health Products
Others
Chapter 13. Middle East and Africa Low Fat Soya Flour Analysis and Outlook
13.1. Middle East and Africa Low Fat Soya Flour Revenue (USD Million), by Segments (2021-2032)
13.1.1. Middle East and Africa Low Fat Soya Flour Revenue (USD Million) by Type (2021-2032)
13.1.2. Middle East and Africa Low Fat Soya Flour Revenue (USD Million) by Application (2021-2032)
13.1.3. Middle East and Africa Low Fat Soya Flour Revenue (USD Million) by Product (2021-2032)
By Type
Low Denatured
High Denatured
By Application
Bakery Products
Dried Milk
Meat Analogues
Health Products
Others
Chapter 14. Low Fat Soya Flour Company Profiles
14.1 Business Overview
14.2 Product Profiles
14.3 SWOT Profiles
14.5 Recent Developments
14.6 Financial Profile
List of Companies
Archer Daniels Midland Company (ADM)
Cargill Inc
CHS
Danisco A/S
Goldensea
Sakthi Soyas
Soja Austria
Sojaprotein
Xiangchi
15. Methodology and Data Sources
15.1 Customization Offerings
15.2 Subscription Services
15.3 Related Reports
15.4 Publisher Expertise
LIST OF TABLES
Table 1 Market Segmentation Analysis
Table 2 Global Low Fat Soya Flour Market Share of Leading Companies, 2023
Table 3 Product Offerings of Leading Companies
Table 4 Low Growth Scenario Forecasts
Table 5 Reference Case Growth Scenario
Table 6 High Growth Case Scenario
Table 7 Global Low Fat Soya Flour Revenue (USD Million) And CAGR (%) By Type (2021-2032)
Table 8 Global Low Fat Soya Flour Revenue (USD Million) And CAGR (%) By Application (2021-2032)
Table 9 Global Low Fat Soya Flour Revenue (USD Million) And CAGR (%) By Product (2021-2032)
Table 10 Global Low Fat Soya Flour Market Revenue (USD Million) By Regions (2021-2032)
Table 11 Global Low Fat Soya Flour Market Share (%) By Regions (2021-2032)
Table 12 North America Low Fat Soya Flour Revenue (USD Million) By Country (2021-2032)
Table 13 Europe Low Fat Soya Flour Revenue (USD Million) By Country (2021-2032)
Table 14 Asia Pacific Low Fat Soya Flour Revenue (USD Million) By Country (2021-2032)
Table 15 South America Low Fat Soya Flour Revenue (USD Million) By Country (2021-2032)
Table 16 Middle East and Africa Low Fat Soya Flour Revenue (USD Million) By Region (2021-2032)
Table 17 North America Low Fat Soya Flour Revenue (USD Million) By Type (2021-2032)
Table 18 North America Low Fat Soya Flour Revenue (USD Million) By Application (2021-2032)
Table 19 North America Low Fat Soya Flour Revenue (USD Million) By Product (2021-2032)
Table 20 Europe Low Fat Soya Flour Revenue (USD Million) By Type (2021-2032)
Table 21 Europe Low Fat Soya Flour Revenue (USD Million) By Application (2021-2032)
Table 22 Europe Low Fat Soya Flour Revenue (USD Million) By Product (2021-2032)
Table 23 Asia Pacific Low Fat Soya Flour Revenue (USD Million) By Type (2021-2032)
Table 24 Asia Pacific Low Fat Soya Flour Revenue (USD Million) By Application (2021-2032)
Table 25 Asia Pacific Low Fat Soya Flour Revenue (USD Million) By Product (2021-2032)
Table 26 South America Low Fat Soya Flour Revenue (USD Million) By Type (2021-2032)
Table 27 South America Low Fat Soya Flour Revenue (USD Million) By Application (2021-2032)
Table 28 South America Low Fat Soya Flour Revenue (USD Million) By Product (2021-2032)
Table 29 Middle East and Africa Low Fat Soya Flour Revenue (USD Million) By Type (2021-2032)
Table 30 Middle East and Africa Low Fat Soya Flour Revenue (USD Million) By Application (2021-2032)
Table 31 Middle East and Africa Low Fat Soya Flour Revenue (USD Million) By Product (2021-2032)
LIST OF FIGURES
Figure 1. Market Scope
Figure 2. Pricing Forecasts Per Unit, 2023- 2032
Figure 3. Porter’s Five Forces
Figure 4. Global Low Fat Soya Flour Market Revenue (USD Million) By Regions (2021-2032)
Figure 5. Global Low Fat Soya Flour Market Share (%) By Regions (2023)
Figure 6. North America Low Fat Soya Flour Revenue (USD Million) By Country (2021-2032)
Figure 7. United States Low Fat Soya Flour Revenue (USD Million) By Country (2021-2032)
Figure 8. Canada Low Fat Soya Flour Revenue (USD Million) By Country (2021-2032)
Figure 9. Mexico Low Fat Soya Flour Revenue (USD Million) By Country (2021-2032)
Figure 10. Europe Low Fat Soya Flour Revenue (USD Million) By Country (2021-2032)
Figure 11. Germany Low Fat Soya Flour Revenue (USD Million) By Country (2021-2032)
Figure 12. France Low Fat Soya Flour Revenue (USD Million) By Country (2021-2032)
Figure 13. United Kingdom Low Fat Soya Flour Revenue (USD Million) By Country (2021-2032)
Figure 14. Spain Low Fat Soya Flour Revenue (USD Million) By Country (2021-2032)
Figure 15. Italy Low Fat Soya Flour Revenue (USD Million) By Country (2021-2032)
Figure 16. Russia Low Fat Soya Flour Revenue (USD Million) By Country (2021-2032)
Figure 17. Rest of Europe Low Fat Soya Flour Revenue (USD Million) By Country (2021-2032)
Figure 11. Asia Pacific Low Fat Soya Flour Revenue (USD Million) By Country (2021-2032)
Figure 12. China Low Fat Soya Flour Revenue (USD Million) By Country (2021-2032)
Figure 13. Japan Low Fat Soya Flour Revenue (USD Million) By Country (2021-2032)
Figure 14. India Low Fat Soya Flour Revenue (USD Million) By Country (2021-2032)
Figure 15. South Korea Low Fat Soya Flour Revenue (USD Million) By Country (2021-2032)
Figure 16. Australia Low Fat Soya Flour Revenue (USD Million) By Country (2021-2032)
Figure 17. South East Asia Low Fat Soya Flour Revenue (USD Million) By Country (2021-2032)
Figure 18. South America Low Fat Soya Flour Revenue (USD Million) By Country (2021-2032)
Figure 19. Brazil Low Fat Soya Flour Revenue (USD Million) By Country (2021-2032)
Figure 20. Argentina Low Fat Soya Flour Revenue (USD Million) By Country (2021-2032)
Figure 21. Rest of Asia Pacific Low Fat Soya Flour Revenue (USD Million) By Country (2021-2032)
Figure 22. Middle East and Africa Low Fat Soya Flour Revenue (USD Million) By Region (2021-2032)
Figure 23. Saudi Arabia Low Fat Soya Flour Revenue (USD Million) By Region (2021-2032)
Figure 24. The UAE Low Fat Soya Flour Revenue (USD Million) By Region (2021-2032)
Figure 25. Rest of Middle East Low Fat Soya Flour Revenue (USD Million) By Region (2021-2032)
Figure 26. South Africa Low Fat Soya Flour Revenue (USD Million) By Region (2021-2032)
Figure 27. Africa Low Fat Soya Flour Revenue (USD Million) By Region (2021-2032)
Figure 28. North America Low Fat Soya Flour Revenue (USD Million) By Type (2021-2032)
Figure 29. North America Low Fat Soya Flour Revenue (USD Million) By Application (2021-2032)
Figure 30. North America Low Fat Soya Flour Revenue (USD Million) By Product (2021-2032)
Figure 31. Europe Low Fat Soya Flour Revenue (USD Million) By Type (2021-2032)
Figure 32. Europe Low Fat Soya Flour Revenue (USD Million) By Application (2021-2032)
Figure 33. Europe Low Fat Soya Flour Revenue (USD Million) By Product (2021-2032)
Figure 34. Asia Pacific Low Fat Soya Flour Revenue (USD Million) By Type (2021-2032)
Figure 35. Asia Pacific Low Fat Soya Flour Revenue (USD Million) By Application (2021-2032)
Figure 36. Asia Pacific Low Fat Soya Flour Revenue (USD Million) By Product (2021-2032)
Figure 37. South America Low Fat Soya Flour Revenue (USD Million) By Type (2021-2032)
Figure 38. South America Low Fat Soya Flour Revenue (USD Million) By Application (2021-2032)
Figure 39. South America Low Fat Soya Flour Revenue (USD Million) By Product (2021-2032)
Figure 40. Middle East and Africa Low Fat Soya Flour Revenue (USD Million) By Type (2021-2032)
Figure 41. Middle East and Africa Low Fat Soya Flour Revenue (USD Million) By Application (2021-2032)
Figure 42. Middle East and Africa Low Fat Soya Flour Revenue (USD Million) By Product (2021-2032)
By Type
Low Denatured
High Denatured
By Application
Bakery Products
Dried Milk
Meat Analogues
Health Products
Others
Countries Analyzed
North America (US, Canada, Mexico)
Europe (Germany, UK, France, Spain, Italy, Russia, Rest of Europe)
Asia Pacific (China, India, Japan, South Korea, Australia, South East Asia, Rest of Asia)
South America (Brazil, Argentina, Rest of South America)
Middle East and Africa (Saudi Arabia, UAE, Rest of Middle East, South Africa, Egypt, Rest of Africa)
