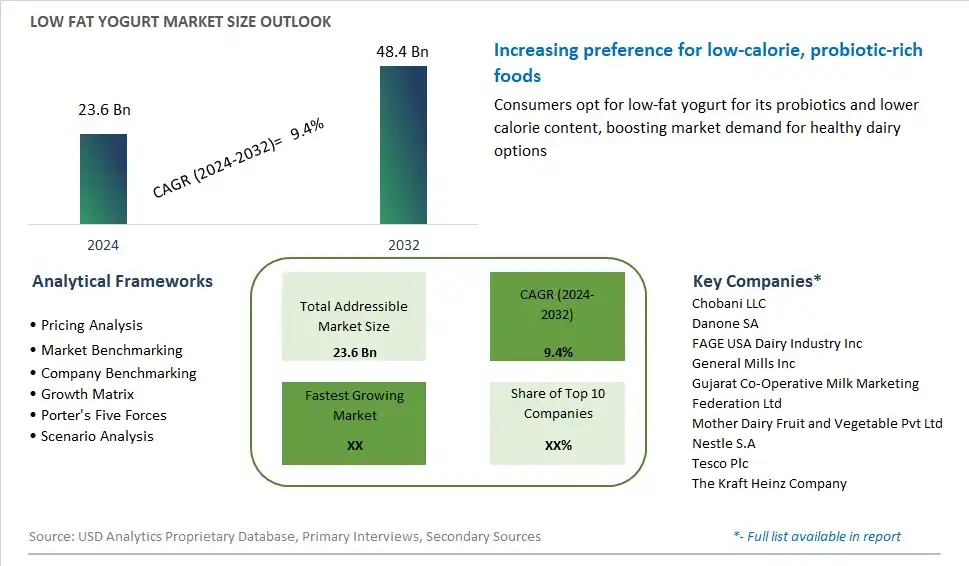
Global Low Fat Yogurt Market Size is valued at $23.6 Billion in 2024 and is forecast to register a growth rate (CAGR) of 9.4% to reach $48.4 Billion by 2032.
The global Low Fat Yogurt Market Comprehensive Study analyzes and forecasts the market size across 6 regions and 24 countries for diverse segments -By Origin (Non-organic Low-Fat Yogurt, Organic Low-Fat Yogurt), By Type (Flavored, Fruit, Plain), By Distribution Channel (Convenience Stores, Hypermarkets/Supermarkets, Online Retailers, Specialty Stores, Departmental Stores, Others)
An Introduction to Low Fat Yogurt Market
The low-fat yogurt market in 2024 is thriving, fueled by a strong consumer focus on health and wellness. Low-fat yogurt offers a nutritious and convenient option for those looking to reduce their fat intake while enjoying the benefits of probiotics and essential nutrients like calcium and protein. The market encompasses a wide range of flavors, formats, and added health benefits, including Greek yogurt, drinkable yogurt, and yogurt with added functional ingredients like fiber, vitamins, and minerals. Innovations in fermentation and dairy processing have improved the taste and texture of low-fat yogurt, making it an appealing choice for health-conscious consumers. The popularity of plant-based diets has also led to the development of low-fat yogurt alternatives made from almond, soy, and coconut milk, catering to lactose-intolerant and vegan consumers. With growing interest in digestive health and clean eating, the low-fat yogurt market is poised for continued growth, supported by strong demand for healthy, convenient, and tasty food options.
Low Fat Yogurt Competitive Landscape
The market report analyses the leading companies in the industry including Chobani LLC, Danone SA, FAGE USA Dairy Industry Inc, General Mills Inc, Gujarat Co-Operative Milk Marketing Federation Ltd, Mother Dairy Fruit and Vegetable Pvt Ltd, Nestle S.A, Tesco Plc, The Kraft Heinz Company, and Others.
Low Fat Yogurt Market Dynamics
Low Fat Yogurt Market Trend: Shift Towards Probiotic-Rich and Functional Foods
In the low-fat yogurt market, a prominent trend is the shift towards probiotic-rich and functional foods. Consumers are increasingly aware of the benefits of probiotics for digestive health and overall well-being, leading to a surge in demand for yogurt products that offer these health benefits. This trend is particularly strong among health-conscious individuals and those looking to improve their gut health naturally. Additionally, there is a growing interest in yogurt fortified with additional nutrients, such as protein, vitamins, and minerals, to support various health goals. The rise of functional foods, which provide specific health benefits beyond basic nutrition, is driving innovation in the low-fat yogurt market, with manufacturers developing products that cater to these evolving consumer preferences.
Market Driver: Growing Awareness of Healthy Eating and Lifestyle
A key driver in the low-fat yogurt market is the growing awareness of healthy eating and lifestyle choices. As more consumers become educated about the impact of diet on long-term health, there is a strong shift towards foods that support a balanced diet and healthy weight management. Low-fat yogurt fits perfectly into this narrative, offering a nutritious and convenient option for those looking to reduce fat intake without sacrificing taste or nutritional value. This driver is further supported by public health campaigns and dietary guidelines that emphasize the importance of reducing saturated fat consumption. The increasing prevalence of lifestyle-related diseases, such as obesity and cardiovascular issues, also reinforces the demand for healthier food alternatives, making low-fat yogurt a popular choice among a wide demographic.
Market Opportunity: Expansion into Plant-Based and Dairy-Free Segments
The low-fat yogurt market presents significant opportunities for expansion into plant-based and dairy-free segments. With the rise of veganism and the growing number of consumers with lactose intolerance or dairy allergies, there is a substantial market for low-fat yogurt alternatives made from plant-based sources such as almonds, soy, and oats. These products not only cater to dietary restrictions but also appeal to environmentally conscious consumers looking to reduce their carbon footprint. Additionally, the plant-based yogurt market is ripe for innovation, with opportunities to create unique flavors, textures, and added health benefits that differentiate these products from traditional dairy yogurts. By tapping into this expanding segment, companies can attract a broader consumer base and capitalize on the growing demand for diverse and inclusive food options.
Low Fat Yogurt Market Share Analysis: Non-organic Low-Fat Yogurt Segment held the dominant market share in 2024
Within the Low Fat Yogurt market, the Non-organic Low-Fat Yogurt segment is the largest category, commanding a significant share due to its affordability, widespread availability, and consumer preference for conventional dairy products. Non-organic low-fat yogurt appeals to a broad consumer base seeking healthy and convenient snack options without the premium price associated with organic products. Additionally, non-organic low-fat yogurt is commonly found in mainstream supermarkets, convenience stores, and grocery chains, making it easily accessible to consumers across various demographics. Further, the familiar taste, smooth texture, and versatile nature of non-organic low-fat yogurt make it a staple item in households and foodservice establishments alike. With its established market presence, competitive pricing, and broad consumer appeal, the Non-organic Low-Fat Yogurt segment continues to dominate the Low Fat Yogurt market, presenting significant opportunities for manufacturers to innovate and expand their product offerings to meet the evolving preferences of health-conscious consumers.
Low Fat Yogurt Market Share Analysis: Flavored Yogurt Segment market is poised to register the fastest growth rae over the forecast period to 2032
Among the segments in the Low Fat Yogurt market, the Flavored Yogurt segment is the fastest-growing category, driven by its broad consumer appeal, innovative flavor profiles, and versatility in culinary applications. Flavored yogurt offers consumers a delicious and indulgent option while still maintaining a low-fat content, making it an attractive choice for those seeking a healthier alternative to traditional desserts or snacks. Further, manufacturers continue to introduce new and exciting flavor combinations, incorporating fruits, spices, and other natural ingredients to enhance taste and appeal to changing consumer preferences. Additionally, flavored yogurt is often marketed as a convenient and nutritious on-the-go snack option, further contributing to its popularity among busy consumers seeking quick and satisfying meals or snacks. With the growing demand for flavorful and health-conscious food options, the Flavored Yogurt segment experiences exponential growth in the Low Fat Yogurt market, presenting significant opportunities for manufacturers to innovate and expand their product offerings to meet the evolving tastes and preferences of consumers.
Low Fat Yogurt Market Share Analysis: Hypermarkets/Supermarkets Segment held the dominant market share in 2024
Within the Low Fat Yogurt market, the Hypermarkets/Supermarkets segment is the largest category, commanding a significant share due to its extensive distribution network, wide product assortment, and consumer convenience. Hypermarkets and supermarkets serve as primary retail channels for low-fat yogurt, offering consumers a one-stop shopping destination for their grocery needs. These retail giants stock a variety of low-fat yogurt brands, flavors, and packaging options, catering to diverse consumer preferences and dietary requirements. Further, the prominent placement of low-fat yogurt products within store aisles, promotional offers, and in-store advertising campaigns further enhances their visibility and consumer appeal. Additionally, the convenience and accessibility of hypermarkets and supermarkets attract a large customer base, including families, health-conscious individuals, and busy professionals, driving sales and market dominance in the Low Fat Yogurt segment. With their established presence and consumer trust, the Hypermarkets/Supermarkets segment continues to lead the Low Fat Yogurt market, presenting significant opportunities for manufacturers to collaborate with retailers and strengthen their market position through strategic partnerships and product innovations.
Low Fat Yogurt Market Segmentation
By Origin
Non-organic Low-Fat Yogurt
Organic Low-Fat Yogurt
By Type
Flavored
Fruit
Plain
By Distribution Channel
Convenience Stores
Hypermarkets/Supermarkets
Online Retailers
Specialty Stores
Departmental Stores
Others
Countries Analyzed
North America (US, Canada, Mexico)
Europe (Germany, UK, France, Spain, Italy, Russia, Rest of Europe)
Asia Pacific (China, India, Japan, South Korea, Australia, South East Asia, Rest of Asia)
South America (Brazil, Argentina, Rest of South America)
Middle East and Africa (Saudi Arabia, UAE, Rest of Middle East, South Africa, Egypt, Rest of Africa)
Low Fat Yogurt Companies Profiled in the Study
Chobani LLC
Danone SA
FAGE USA Dairy Industry Inc
General Mills Inc
Gujarat Co-Operative Milk Marketing Federation Ltd
Mother Dairy Fruit and Vegetable Pvt Ltd
Nestle S.A
Tesco Plc
The Kraft Heinz Company
*- List Not Exhaustive
Chapter 1. TABLE OF CONTENTS
Chapter 2. Introduction to Low Fat Yogurt Market
2.1. Market Overview
2.2. Key Statistics and Report Highlights
2.3. Scope of the Comprehensive Study
2.3.1. Market Definition
2.3.2 Countries and Regions Covered
2.3.3 Research Objective
2.3.4 Units, Currency, and Conversions
2.3.5 Industry Value Chain
2.4. Key Market Segments
2.5. Key Companies
2.6. Study Period
Chapter 3. Strategic Analysis Review
3.1. Low Fat Yogurt Pricing Analysis and Forecast
3.2. Porter’s Five Forces
3.3. Market Ecosystem
3.4. SWOT Analysis
3.5. Regulatory Scenario
3.3. Effects of Inflation, Russia-Ukraine War, moderating economic growth, and other macroeconomic factors
Chapter 4. Competitive Landscape
4.1. Market Share Analysis
4.1.1. Global Low Fat Yogurt Market Share by Company, 2023
4.1.2. Product Offerings of Leading Low Fat Yogurt Companies
4.2. Market Entropy
4.2.1. New Product Launches in the Industry
4.2.2. Mergers, Acquisitions, Joint ventures, and Partnerships
4.3. Key Strategies and Best Practices
Chapter 5. Global Market Projections: Best, Reference, and Low Case Scenarios
5.1. Growth Analysis- Case Scenario Definitions
5.2. Low Growth Case Scenario Forecasts
5.3. Reference Growth Case Scenario Forecasts
5.4. High Growth Case Scenario Forecasts
Chapter 6. Market Dynamics
6.1. Low Fat Yogurt Market Drivers
6.2. Low Fat Yogurt Market Challenges
6.6. Low Fat Yogurt Market Opportunities
6.4. Low Fat Yogurt Market Trends
Chapter 7. Global Low Fat Yogurt Market Outlook Trends
7.1. Global Low Fat Yogurt Revenue (USD Million) and CAGR (%) by Type (2021-2032)
7.2. Global Low Fat Yogurt Revenue (USD Million) and CAGR (%) by Application (2021-2032)
7.3. Global Low Fat Yogurt Revenue (USD Million) and CAGR (%) by Product (2021-2032)
By Origin
Non-organic Low-Fat Yogurt
Organic Low-Fat Yogurt
By Type
Flavored
Fruit
Plain
By Distribution Channel
Convenience Stores
Hypermarkets/Supermarkets
Online Retailers
Specialty Stores
Departmental Stores
Others
Chapter 8. Global Low Fat Yogurt Regional Analysis and Outlook
8.1. Global Low Fat Yogurt Revenue (USD Million) By Regions (2021- 2032)
8.2. North America Low Fat Yogurt Revenue (USD Million) by Country (2021-2032)
8.2.1. United States Low Fat Yogurt Regional Analysis and Outlook
8.2.2. Canada Low Fat Yogurt Regional Analysis and Outlook
8.2.3. Mexico Low Fat Yogurt Regional Analysis and Outlook
8.3. Europe Low Fat Yogurt Revenue (USD Million), by Country (2021-2032)
8.3.1. Germany Low Fat Yogurt Regional Analysis and Outlook
8.3.2. France Low Fat Yogurt Regional Analysis and Outlook
8.3.3. United Kingdom Low Fat Yogurt Regional Analysis and Outlook
8.3.4. Spain Low Fat Yogurt Regional Analysis and Outlook
8.3.5. Italy Low Fat Yogurt Regional Analysis and Outlook
8.3.6. Russia Low Fat Yogurt Regional Analysis and Outlook
8.3.7. Rest of Europe Low Fat Yogurt Regional Analysis and Outlook
8.4. Asia Pacific Low Fat Yogurt Revenue (USD Million) by Country (2021-2032)
8.4.1. China Low Fat Yogurt Regional Analysis and Outlook
8.4.2. Japan Low Fat Yogurt Regional Analysis and Outlook
8.4.3. India Low Fat Yogurt Regional Analysis and Outlook
8.4.4. South Korea Low Fat Yogurt Regional Analysis and Outlook
8.4.5. Australia Low Fat Yogurt Regional Analysis and Outlook
8.4.6. South East Asia Low Fat Yogurt Regional Analysis and Outlook
8.4.7. Rest of Asia Pacific Low Fat Yogurt Regional Analysis and Outlook
8.5. South America Low Fat Yogurt Revenue (USD Million), by Country (2021-2032)
8.5.1. Brazil Low Fat Yogurt Regional Analysis and Outlook
8.5.2. Argentina Low Fat Yogurt Regional Analysis and Outlook
8.5.3. Rest of South America Low Fat Yogurt Regional Analysis and Outlook
8.6. Middle East and Africa Low Fat Yogurt Revenue (USD Million) by Country (2021-2032)
8.6.1. Middle East Low Fat Yogurt Regional Analysis and Outlook
8.6.2. Africa Low Fat Yogurt Regional Analysis and Outlook
Chapter 9. North America Low Fat Yogurt Analysis and Outlook
9.1. North America Low Fat Yogurt Revenue (USD Million) by Segments (2021-2032)
9.1.1. North America Low Fat Yogurt Revenue (USD Million) by Type (2021-2032)
9.1.2. North America Low Fat Yogurt Revenue (USD Million) by Application (2021-2032)
9.1.3. North America Low Fat Yogurt Revenue (USD Million) by Product (2021-2032)
By Origin
Non-organic Low-Fat Yogurt
Organic Low-Fat Yogurt
By Type
Flavored
Fruit
Plain
By Distribution Channel
Convenience Stores
Hypermarkets/Supermarkets
Online Retailers
Specialty Stores
Departmental Stores
Others
Chapter 10. Europe Low Fat Yogurt Analysis and Outlook
10.1. Europe Low Fat Yogurt Revenue (USD Million), by Segments (USD Million) (2021-2032)
10.1.1. Europe Low Fat Yogurt Revenue (USD Million) by Type (2021-2032)
10.1.2. Europe Low Fat Yogurt Revenue (USD Million) by Application (2021-2032)
10.1.3. Europe Low Fat Yogurt Revenue (USD Million) by Product (2021-2032)
By Origin
Non-organic Low-Fat Yogurt
Organic Low-Fat Yogurt
By Type
Flavored
Fruit
Plain
By Distribution Channel
Convenience Stores
Hypermarkets/Supermarkets
Online Retailers
Specialty Stores
Departmental Stores
Others
Chapter 11. Asia Pacific Low Fat Yogurt Analysis and Outlook
11.1. Asia Pacific Low Fat Yogurt Revenue (USD Million), and Revenue (USD Million) by Segments (2021-2032)
11.1.1. Asia Pacific Low Fat Yogurt Revenue (USD Million) by Type (2021-2032)
11.1.2. Asia Pacific Low Fat Yogurt Revenue (USD Million) by Application (2021-2032)
11.1.3. Asia Pacific Low Fat Yogurt Revenue (USD Million) by Product (2021-2032)
By Origin
Non-organic Low-Fat Yogurt
Organic Low-Fat Yogurt
By Type
Flavored
Fruit
Plain
By Distribution Channel
Convenience Stores
Hypermarkets/Supermarkets
Online Retailers
Specialty Stores
Departmental Stores
Others
Chapter 12. South America Low Fat Yogurt Analysis and Outlook
12.1. South America Low Fat Yogurt Revenue (USD Million), by Segments (2021-2032)
12.1.1. South America Low Fat Yogurt Revenue (USD Million) by Type (2021-2032)
12.1.2. South America Low Fat Yogurt Revenue (USD Million) by Application (2021-2032)
12.1.3. South America Low Fat Yogurt Revenue (USD Million) by Product (2021-2032)
By Origin
Non-organic Low-Fat Yogurt
Organic Low-Fat Yogurt
By Type
Flavored
Fruit
Plain
By Distribution Channel
Convenience Stores
Hypermarkets/Supermarkets
Online Retailers
Specialty Stores
Departmental Stores
Others
Chapter 13. Middle East and Africa Low Fat Yogurt Analysis and Outlook
13.1. Middle East and Africa Low Fat Yogurt Revenue (USD Million), by Segments (2021-2032)
13.1.1. Middle East and Africa Low Fat Yogurt Revenue (USD Million) by Type (2021-2032)
13.1.2. Middle East and Africa Low Fat Yogurt Revenue (USD Million) by Application (2021-2032)
13.1.3. Middle East and Africa Low Fat Yogurt Revenue (USD Million) by Product (2021-2032)
By Origin
Non-organic Low-Fat Yogurt
Organic Low-Fat Yogurt
By Type
Flavored
Fruit
Plain
By Distribution Channel
Convenience Stores
Hypermarkets/Supermarkets
Online Retailers
Specialty Stores
Departmental Stores
Others
Chapter 14. Low Fat Yogurt Company Profiles
14.1 Business Overview
14.2 Product Profiles
14.3 SWOT Profiles
14.5 Recent Developments
14.6 Financial Profile
List of Companies
Chobani LLC
Danone SA
FAGE USA Dairy Industry Inc
General Mills Inc
Gujarat Co-Operative Milk Marketing Federation Ltd
Mother Dairy Fruit and Vegetable Pvt Ltd
Nestle S.A
Tesco Plc
The Kraft Heinz Company
15. Methodology and Data Sources
15.1 Customization Offerings
15.2 Subscription Services
15.3 Related Reports
15.4 Publisher Expertise
LIST OF TABLES
Table 1 Market Segmentation Analysis
Table 2 Global Low Fat Yogurt Market Share of Leading Companies, 2023
Table 3 Product Offerings of Leading Companies
Table 4 Low Growth Scenario Forecasts
Table 5 Reference Case Growth Scenario
Table 6 High Growth Case Scenario
Table 7 Global Low Fat Yogurt Revenue (USD Million) And CAGR (%) By Type (2021-2032)
Table 8 Global Low Fat Yogurt Revenue (USD Million) And CAGR (%) By Application (2021-2032)
Table 9 Global Low Fat Yogurt Revenue (USD Million) And CAGR (%) By Product (2021-2032)
Table 10 Global Low Fat Yogurt Market Revenue (USD Million) By Regions (2021-2032)
Table 11 Global Low Fat Yogurt Market Share (%) By Regions (2021-2032)
Table 12 North America Low Fat Yogurt Revenue (USD Million) By Country (2021-2032)
Table 13 Europe Low Fat Yogurt Revenue (USD Million) By Country (2021-2032)
Table 14 Asia Pacific Low Fat Yogurt Revenue (USD Million) By Country (2021-2032)
Table 15 South America Low Fat Yogurt Revenue (USD Million) By Country (2021-2032)
Table 16 Middle East and Africa Low Fat Yogurt Revenue (USD Million) By Region (2021-2032)
Table 17 North America Low Fat Yogurt Revenue (USD Million) By Type (2021-2032)
Table 18 North America Low Fat Yogurt Revenue (USD Million) By Application (2021-2032)
Table 19 North America Low Fat Yogurt Revenue (USD Million) By Product (2021-2032)
Table 20 Europe Low Fat Yogurt Revenue (USD Million) By Type (2021-2032)
Table 21 Europe Low Fat Yogurt Revenue (USD Million) By Application (2021-2032)
Table 22 Europe Low Fat Yogurt Revenue (USD Million) By Product (2021-2032)
Table 23 Asia Pacific Low Fat Yogurt Revenue (USD Million) By Type (2021-2032)
Table 24 Asia Pacific Low Fat Yogurt Revenue (USD Million) By Application (2021-2032)
Table 25 Asia Pacific Low Fat Yogurt Revenue (USD Million) By Product (2021-2032)
Table 26 South America Low Fat Yogurt Revenue (USD Million) By Type (2021-2032)
Table 27 South America Low Fat Yogurt Revenue (USD Million) By Application (2021-2032)
Table 28 South America Low Fat Yogurt Revenue (USD Million) By Product (2021-2032)
Table 29 Middle East and Africa Low Fat Yogurt Revenue (USD Million) By Type (2021-2032)
Table 30 Middle East and Africa Low Fat Yogurt Revenue (USD Million) By Application (2021-2032)
Table 31 Middle East and Africa Low Fat Yogurt Revenue (USD Million) By Product (2021-2032)
LIST OF FIGURES
Figure 1. Market Scope
Figure 2. Pricing Forecasts Per Unit, 2023- 2032
Figure 3. Porter’s Five Forces
Figure 4. Global Low Fat Yogurt Market Revenue (USD Million) By Regions (2021-2032)
Figure 5. Global Low Fat Yogurt Market Share (%) By Regions (2023)
Figure 6. North America Low Fat Yogurt Revenue (USD Million) By Country (2021-2032)
Figure 7. United States Low Fat Yogurt Revenue (USD Million) By Country (2021-2032)
Figure 8. Canada Low Fat Yogurt Revenue (USD Million) By Country (2021-2032)
Figure 9. Mexico Low Fat Yogurt Revenue (USD Million) By Country (2021-2032)
Figure 10. Europe Low Fat Yogurt Revenue (USD Million) By Country (2021-2032)
Figure 11. Germany Low Fat Yogurt Revenue (USD Million) By Country (2021-2032)
Figure 12. France Low Fat Yogurt Revenue (USD Million) By Country (2021-2032)
Figure 13. United Kingdom Low Fat Yogurt Revenue (USD Million) By Country (2021-2032)
Figure 14. Spain Low Fat Yogurt Revenue (USD Million) By Country (2021-2032)
Figure 15. Italy Low Fat Yogurt Revenue (USD Million) By Country (2021-2032)
Figure 16. Russia Low Fat Yogurt Revenue (USD Million) By Country (2021-2032)
Figure 17. Rest of Europe Low Fat Yogurt Revenue (USD Million) By Country (2021-2032)
Figure 11. Asia Pacific Low Fat Yogurt Revenue (USD Million) By Country (2021-2032)
Figure 12. China Low Fat Yogurt Revenue (USD Million) By Country (2021-2032)
Figure 13. Japan Low Fat Yogurt Revenue (USD Million) By Country (2021-2032)
Figure 14. India Low Fat Yogurt Revenue (USD Million) By Country (2021-2032)
Figure 15. South Korea Low Fat Yogurt Revenue (USD Million) By Country (2021-2032)
Figure 16. Australia Low Fat Yogurt Revenue (USD Million) By Country (2021-2032)
Figure 17. South East Asia Low Fat Yogurt Revenue (USD Million) By Country (2021-2032)
Figure 18. South America Low Fat Yogurt Revenue (USD Million) By Country (2021-2032)
Figure 19. Brazil Low Fat Yogurt Revenue (USD Million) By Country (2021-2032)
Figure 20. Argentina Low Fat Yogurt Revenue (USD Million) By Country (2021-2032)
Figure 21. Rest of Asia Pacific Low Fat Yogurt Revenue (USD Million) By Country (2021-2032)
Figure 22. Middle East and Africa Low Fat Yogurt Revenue (USD Million) By Region (2021-2032)
Figure 23. Saudi Arabia Low Fat Yogurt Revenue (USD Million) By Region (2021-2032)
Figure 24. The UAE Low Fat Yogurt Revenue (USD Million) By Region (2021-2032)
Figure 25. Rest of Middle East Low Fat Yogurt Revenue (USD Million) By Region (2021-2032)
Figure 26. South Africa Low Fat Yogurt Revenue (USD Million) By Region (2021-2032)
Figure 27. Africa Low Fat Yogurt Revenue (USD Million) By Region (2021-2032)
Figure 28. North America Low Fat Yogurt Revenue (USD Million) By Type (2021-2032)
Figure 29. North America Low Fat Yogurt Revenue (USD Million) By Application (2021-2032)
Figure 30. North America Low Fat Yogurt Revenue (USD Million) By Product (2021-2032)
Figure 31. Europe Low Fat Yogurt Revenue (USD Million) By Type (2021-2032)
Figure 32. Europe Low Fat Yogurt Revenue (USD Million) By Application (2021-2032)
Figure 33. Europe Low Fat Yogurt Revenue (USD Million) By Product (2021-2032)
Figure 34. Asia Pacific Low Fat Yogurt Revenue (USD Million) By Type (2021-2032)
Figure 35. Asia Pacific Low Fat Yogurt Revenue (USD Million) By Application (2021-2032)
Figure 36. Asia Pacific Low Fat Yogurt Revenue (USD Million) By Product (2021-2032)
Figure 37. South America Low Fat Yogurt Revenue (USD Million) By Type (2021-2032)
Figure 38. South America Low Fat Yogurt Revenue (USD Million) By Application (2021-2032)
Figure 39. South America Low Fat Yogurt Revenue (USD Million) By Product (2021-2032)
Figure 40. Middle East and Africa Low Fat Yogurt Revenue (USD Million) By Type (2021-2032)
Figure 41. Middle East and Africa Low Fat Yogurt Revenue (USD Million) By Application (2021-2032)
Figure 42. Middle East and Africa Low Fat Yogurt Revenue (USD Million) By Product (2021-2032)
By Origin
Non-organic Low-Fat Yogurt
Organic Low-Fat Yogurt
By Type
Flavored
Fruit
Plain
By Distribution Channel
Convenience Stores
Hypermarkets/Supermarkets
Online Retailers
Specialty Stores
Departmental Stores
Others
Countries Analyzed
North America (US, Canada, Mexico)
Europe (Germany, UK, France, Spain, Italy, Russia, Rest of Europe)
Asia Pacific (China, India, Japan, South Korea, Australia, South East Asia, Rest of Asia)
South America (Brazil, Argentina, Rest of South America)
Middle East and Africa (Saudi Arabia, UAE, Rest of Middle East, South Africa, Egypt, Rest of Africa)
