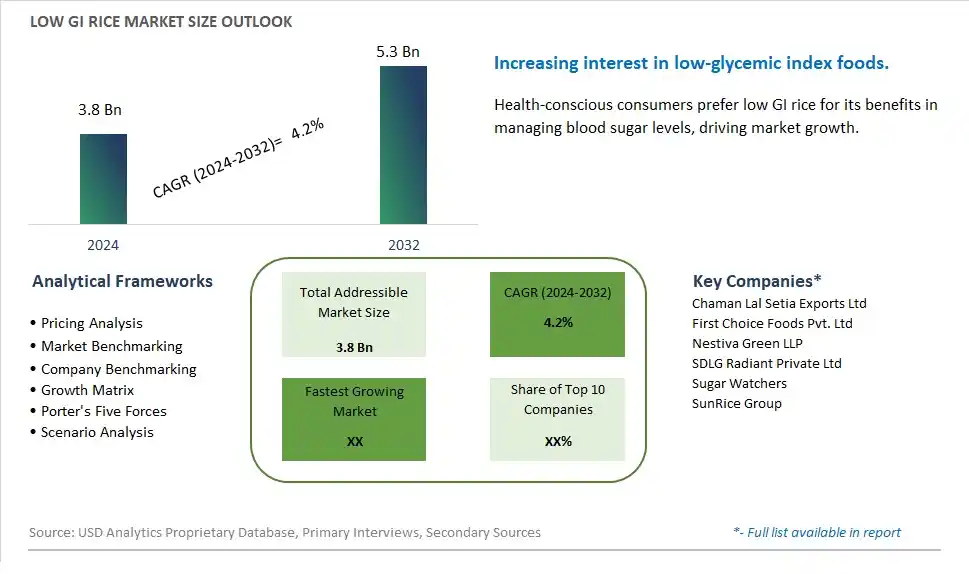
Global Low GI Rice Market Size is valued at $3.8 Billion in 2024 and is forecast to register a growth rate (CAGR) of 4.2% to reach $5.3 Billion by 2032.
The global Low GI Rice Market Comprehensive Study analyzes and forecasts the market size across 6 regions and 24 countries for diverse segments -By Distribution Channel (Hypermarkets/Supermarkets, Online Retail, Others)
An Introduction to Low GI Rice Market
The low glycemic index (GI) rice market in 2024 is witnessing robust growth, propelled by increasing consumer awareness of the health benefits associated with low GI foods and the rising prevalence of lifestyle-related diseases such as diabetes and obesity. Low GI rice, characterized by its slow digestion and absorption, offers a viable alternative to traditional rice varieties, making it an attractive option for health-conscious consumers. With a focus on product development and innovation, manufacturers are introducing a diverse range of low GI rice products, including brown rice, basmati rice, and specialty blends, to cater to varying culinary preferences. Additionally, partnerships with healthcare professionals and nutritionists, along with targeted marketing campaigns, are amplifying consumer education efforts and driving market expansion. Overall, the low GI rice market is poised for sustained growth as consumers increasingly prioritize health and wellness in their dietary choices.
Low GI Rice Competitive Landscape
The market report analyses the leading companies in the industry including Chaman Lal Setia Exports Ltd, First Choice Foods Pvt. Ltd, Nestiva Green LLP, SDLG Radiant Private Ltd, Sugar Watchers, SunRice Group, and Others.
Low GI Rice Market Dynamics
Low GI Rice Market Trend: Growing Demand for Healthier Food Options
A prominent trend in the low GI rice market is the increasing demand for healthier food options among consumers. With rising health consciousness and awareness of the impact of diet on overall well-being, there is a growing preference for foods that offer nutritional benefits and support healthy lifestyles. Low glycemic index (GI) rice, which releases glucose into the bloodstream more slowly, helping to regulate blood sugar levels, is gaining popularity as a healthier alternative to traditional rice varieties. This trend is driven by consumers seeking to manage conditions such as diabetes, obesity, and metabolic disorders, as well as those looking to adopt balanced and nutritious dietary habits.
Market Driver: Rising Incidence of Chronic Health Conditions
A key driver for the low GI rice market is the rising incidence of chronic health conditions such as diabetes, cardiovascular diseases, and obesity. As these health issues continue to affect populations worldwide, there is growing awareness of the importance of diet in disease prevention and management. Low GI foods, including low GI rice, are perceived as beneficial for individuals looking to control blood sugar levels, reduce the risk of insulin resistance, and maintain a healthy weight. The increasing prevalence of chronic health conditions, coupled with recommendations from healthcare professionals and nutritionists, is driving the demand for low GI rice products among consumers seeking to make healthier dietary choices.
Market Opportunity: Product Innovation and Education
An opportunity for the low GI rice market lies in product innovation and education to raise awareness and expand market penetration. Manufacturers can explore innovative techniques to develop new varieties of low GI rice with improved taste, texture, and cooking properties, thereby appealing to a broader consumer base. Collaborations with research institutions and agricultural experts can facilitate the development of novel rice cultivars with naturally low GI properties, leveraging advances in breeding and biotechnology. Moreover, there is an opportunity to invest in consumer education and marketing campaigns to communicate the health benefits of low GI rice, dispel misconceptions, and encourage adoption among target demographics. By combining product innovation with effective education and marketing strategies, companies can capitalize on the growing demand for low GI rice and position themselves as leaders in the health-conscious food market.
Low GI Rice Market Share Analysis: Online Retail market is poised to register the fastest growth rae over the forecast period to 2032
Online retail is the fastest-growing segment in the Low GI Rice market by distribution channel. With the rapid digitization of commerce and increasing consumer preference for convenience, online retail platforms have witnessed a surge in demand for various food products, including low GI rice. The convenience of browsing through a wide variety of options, easy comparison of prices, and doorstep delivery services offered by online retailers have significantly contributed to the growth of this segment. Further, the COVID-19 pandemic has further accelerated the shift towards online shopping as consumers seek safer alternatives to traditional brick-and-mortar stores. As a result, online retail has become a pivotal distribution channel for low GI rice, offering both accessibility and convenience to consumers globally. This trend is expected to continue as e-commerce platforms continue to innovate and improve their services, catering to the evolving needs and preferences of health-conscious consumers.
Low GI Rice Market Segmentation
By Distribution Channel
Hypermarkets/Supermarkets
Online Retail
Others
Countries Analyzed
North America (US, Canada, Mexico)
Europe (Germany, UK, France, Spain, Italy, Russia, Rest of Europe)
Asia Pacific (China, India, Japan, South Korea, Australia, South East Asia, Rest of Asia)
South America (Brazil, Argentina, Rest of South America)
Middle East and Africa (Saudi Arabia, UAE, Rest of Middle East, South Africa, Egypt, Rest of Africa)
Low GI Rice Companies Profiled in the Study
Chaman Lal Setia Exports Ltd
First Choice Foods Pvt. Ltd
Nestiva Green LLP
SDLG Radiant Private Ltd
Sugar Watchers
SunRice Group
*- List Not Exhaustive
Chapter 1. TABLE OF CONTENTS
Chapter 2. Introduction to Low GI Rice Market
2.1. Market Overview
2.2. Key Statistics and Report Highlights
2.3. Scope of the Comprehensive Study
2.3.1. Market Definition
2.3.2 Countries and Regions Covered
2.3.3 Research Objective
2.3.4 Units, Currency, and Conversions
2.3.5 Industry Value Chain
2.4. Key Market Segments
2.5. Key Companies
2.6. Study Period
Chapter 3. Strategic Analysis Review
3.1. Low GI Rice Pricing Analysis and Forecast
3.2. Porter’s Five Forces
3.3. Market Ecosystem
3.4. SWOT Analysis
3.5. Regulatory Scenario
3.3. Effects of Inflation, Russia-Ukraine War, moderating economic growth, and other macroeconomic factors
Chapter 4. Competitive Landscape
4.1. Market Share Analysis
4.1.1. Global Low GI Rice Market Share by Company, 2023
4.1.2. Product Offerings of Leading Low GI Rice Companies
4.2. Market Entropy
4.2.1. New Product Launches in the Industry
4.2.2. Mergers, Acquisitions, Joint ventures, and Partnerships
4.3. Key Strategies and Best Practices
Chapter 5. Global Market Projections: Best, Reference, and Low Case Scenarios
5.1. Growth Analysis- Case Scenario Definitions
5.2. Low Growth Case Scenario Forecasts
5.3. Reference Growth Case Scenario Forecasts
5.4. High Growth Case Scenario Forecasts
Chapter 6. Market Dynamics
6.1. Low GI Rice Market Drivers
6.2. Low GI Rice Market Challenges
6.6. Low GI Rice Market Opportunities
6.4. Low GI Rice Market Trends
Chapter 7. Global Low GI Rice Market Outlook Trends
7.1. Global Low GI Rice Revenue (USD Million) and CAGR (%) by Type (2021-2032)
7.2. Global Low GI Rice Revenue (USD Million) and CAGR (%) by Application (2021-2032)
7.3. Global Low GI Rice Revenue (USD Million) and CAGR (%) by Product (2021-2032)
By Distribution Channel
Hypermarkets/Supermarkets
Online Retail
Others
Chapter 8. Global Low GI Rice Regional Analysis and Outlook
8.1. Global Low GI Rice Revenue (USD Million) By Regions (2021- 2032)
8.2. North America Low GI Rice Revenue (USD Million) by Country (2021-2032)
8.2.1. United States Low GI Rice Regional Analysis and Outlook
8.2.2. Canada Low GI Rice Regional Analysis and Outlook
8.2.3. Mexico Low GI Rice Regional Analysis and Outlook
8.3. Europe Low GI Rice Revenue (USD Million), by Country (2021-2032)
8.3.1. Germany Low GI Rice Regional Analysis and Outlook
8.3.2. France Low GI Rice Regional Analysis and Outlook
8.3.3. United Kingdom Low GI Rice Regional Analysis and Outlook
8.3.4. Spain Low GI Rice Regional Analysis and Outlook
8.3.5. Italy Low GI Rice Regional Analysis and Outlook
8.3.6. Russia Low GI Rice Regional Analysis and Outlook
8.3.7. Rest of Europe Low GI Rice Regional Analysis and Outlook
8.4. Asia Pacific Low GI Rice Revenue (USD Million) by Country (2021-2032)
8.4.1. China Low GI Rice Regional Analysis and Outlook
8.4.2. Japan Low GI Rice Regional Analysis and Outlook
8.4.3. India Low GI Rice Regional Analysis and Outlook
8.4.4. South Korea Low GI Rice Regional Analysis and Outlook
8.4.5. Australia Low GI Rice Regional Analysis and Outlook
8.4.6. South East Asia Low GI Rice Regional Analysis and Outlook
8.4.7. Rest of Asia Pacific Low GI Rice Regional Analysis and Outlook
8.5. South America Low GI Rice Revenue (USD Million), by Country (2021-2032)
8.5.1. Brazil Low GI Rice Regional Analysis and Outlook
8.5.2. Argentina Low GI Rice Regional Analysis and Outlook
8.5.3. Rest of South America Low GI Rice Regional Analysis and Outlook
8.6. Middle East and Africa Low GI Rice Revenue (USD Million) by Country (2021-2032)
8.6.1. Middle East Low GI Rice Regional Analysis and Outlook
8.6.2. Africa Low GI Rice Regional Analysis and Outlook
Chapter 9. North America Low GI Rice Analysis and Outlook
9.1. North America Low GI Rice Revenue (USD Million) by Segments (2021-2032)
9.1.1. North America Low GI Rice Revenue (USD Million) by Type (2021-2032)
9.1.2. North America Low GI Rice Revenue (USD Million) by Application (2021-2032)
9.1.3. North America Low GI Rice Revenue (USD Million) by Product (2021-2032)
By Distribution Channel
Hypermarkets/Supermarkets
Online Retail
Others
Chapter 10. Europe Low GI Rice Analysis and Outlook
10.1. Europe Low GI Rice Revenue (USD Million), by Segments (USD Million) (2021-2032)
10.1.1. Europe Low GI Rice Revenue (USD Million) by Type (2021-2032)
10.1.2. Europe Low GI Rice Revenue (USD Million) by Application (2021-2032)
10.1.3. Europe Low GI Rice Revenue (USD Million) by Product (2021-2032)
By Distribution Channel
Hypermarkets/Supermarkets
Online Retail
Others
Chapter 11. Asia Pacific Low GI Rice Analysis and Outlook
11.1. Asia Pacific Low GI Rice Revenue (USD Million), and Revenue (USD Million) by Segments (2021-2032)
11.1.1. Asia Pacific Low GI Rice Revenue (USD Million) by Type (2021-2032)
11.1.2. Asia Pacific Low GI Rice Revenue (USD Million) by Application (2021-2032)
11.1.3. Asia Pacific Low GI Rice Revenue (USD Million) by Product (2021-2032)
By Distribution Channel
Hypermarkets/Supermarkets
Online Retail
Others
Chapter 12. South America Low GI Rice Analysis and Outlook
12.1. South America Low GI Rice Revenue (USD Million), by Segments (2021-2032)
12.1.1. South America Low GI Rice Revenue (USD Million) by Type (2021-2032)
12.1.2. South America Low GI Rice Revenue (USD Million) by Application (2021-2032)
12.1.3. South America Low GI Rice Revenue (USD Million) by Product (2021-2032)
By Distribution Channel
Hypermarkets/Supermarkets
Online Retail
Others
Chapter 13. Middle East and Africa Low GI Rice Analysis and Outlook
13.1. Middle East and Africa Low GI Rice Revenue (USD Million), by Segments (2021-2032)
13.1.1. Middle East and Africa Low GI Rice Revenue (USD Million) by Type (2021-2032)
13.1.2. Middle East and Africa Low GI Rice Revenue (USD Million) by Application (2021-2032)
13.1.3. Middle East and Africa Low GI Rice Revenue (USD Million) by Product (2021-2032)
By Distribution Channel
Hypermarkets/Supermarkets
Online Retail
Others
Chapter 14. Low GI Rice Company Profiles
14.1 Business Overview
14.2 Product Profiles
14.3 SWOT Profiles
14.5 Recent Developments
14.6 Financial Profile
List of Companies
Chaman Lal Setia Exports Ltd
First Choice Foods Pvt. Ltd
Nestiva Green LLP
SDLG Radiant Private Ltd
Sugar Watchers
SunRice Group
15. Methodology and Data Sources
15.1 Customization Offerings
15.2 Subscription Services
15.3 Related Reports
15.4 Publisher Expertise
LIST OF TABLES
Table 1 Market Segmentation Analysis
Table 2 Global Low GI Rice Market Share of Leading Companies, 2023
Table 3 Product Offerings of Leading Companies
Table 4 Low Growth Scenario Forecasts
Table 5 Reference Case Growth Scenario
Table 6 High Growth Case Scenario
Table 7 Global Low GI Rice Revenue (USD Million) And CAGR (%) By Type (2021-2032)
Table 8 Global Low GI Rice Revenue (USD Million) And CAGR (%) By Application (2021-2032)
Table 9 Global Low GI Rice Revenue (USD Million) And CAGR (%) By Product (2021-2032)
Table 10 Global Low GI Rice Market Revenue (USD Million) By Regions (2021-2032)
Table 11 Global Low GI Rice Market Share (%) By Regions (2021-2032)
Table 12 North America Low GI Rice Revenue (USD Million) By Country (2021-2032)
Table 13 Europe Low GI Rice Revenue (USD Million) By Country (2021-2032)
Table 14 Asia Pacific Low GI Rice Revenue (USD Million) By Country (2021-2032)
Table 15 South America Low GI Rice Revenue (USD Million) By Country (2021-2032)
Table 16 Middle East and Africa Low GI Rice Revenue (USD Million) By Region (2021-2032)
Table 17 North America Low GI Rice Revenue (USD Million) By Type (2021-2032)
Table 18 North America Low GI Rice Revenue (USD Million) By Application (2021-2032)
Table 19 North America Low GI Rice Revenue (USD Million) By Product (2021-2032)
Table 20 Europe Low GI Rice Revenue (USD Million) By Type (2021-2032)
Table 21 Europe Low GI Rice Revenue (USD Million) By Application (2021-2032)
Table 22 Europe Low GI Rice Revenue (USD Million) By Product (2021-2032)
Table 23 Asia Pacific Low GI Rice Revenue (USD Million) By Type (2021-2032)
Table 24 Asia Pacific Low GI Rice Revenue (USD Million) By Application (2021-2032)
Table 25 Asia Pacific Low GI Rice Revenue (USD Million) By Product (2021-2032)
Table 26 South America Low GI Rice Revenue (USD Million) By Type (2021-2032)
Table 27 South America Low GI Rice Revenue (USD Million) By Application (2021-2032)
Table 28 South America Low GI Rice Revenue (USD Million) By Product (2021-2032)
Table 29 Middle East and Africa Low GI Rice Revenue (USD Million) By Type (2021-2032)
Table 30 Middle East and Africa Low GI Rice Revenue (USD Million) By Application (2021-2032)
Table 31 Middle East and Africa Low GI Rice Revenue (USD Million) By Product (2021-2032)
LIST OF FIGURES
Figure 1. Market Scope
Figure 2. Pricing Forecasts Per Unit, 2023- 2032
Figure 3. Porter’s Five Forces
Figure 4. Global Low GI Rice Market Revenue (USD Million) By Regions (2021-2032)
Figure 5. Global Low GI Rice Market Share (%) By Regions (2023)
Figure 6. North America Low GI Rice Revenue (USD Million) By Country (2021-2032)
Figure 7. United States Low GI Rice Revenue (USD Million) By Country (2021-2032)
Figure 8. Canada Low GI Rice Revenue (USD Million) By Country (2021-2032)
Figure 9. Mexico Low GI Rice Revenue (USD Million) By Country (2021-2032)
Figure 10. Europe Low GI Rice Revenue (USD Million) By Country (2021-2032)
Figure 11. Germany Low GI Rice Revenue (USD Million) By Country (2021-2032)
Figure 12. France Low GI Rice Revenue (USD Million) By Country (2021-2032)
Figure 13. United Kingdom Low GI Rice Revenue (USD Million) By Country (2021-2032)
Figure 14. Spain Low GI Rice Revenue (USD Million) By Country (2021-2032)
Figure 15. Italy Low GI Rice Revenue (USD Million) By Country (2021-2032)
Figure 16. Russia Low GI Rice Revenue (USD Million) By Country (2021-2032)
Figure 17. Rest of Europe Low GI Rice Revenue (USD Million) By Country (2021-2032)
Figure 11. Asia Pacific Low GI Rice Revenue (USD Million) By Country (2021-2032)
Figure 12. China Low GI Rice Revenue (USD Million) By Country (2021-2032)
Figure 13. Japan Low GI Rice Revenue (USD Million) By Country (2021-2032)
Figure 14. India Low GI Rice Revenue (USD Million) By Country (2021-2032)
Figure 15. South Korea Low GI Rice Revenue (USD Million) By Country (2021-2032)
Figure 16. Australia Low GI Rice Revenue (USD Million) By Country (2021-2032)
Figure 17. South East Asia Low GI Rice Revenue (USD Million) By Country (2021-2032)
Figure 18. South America Low GI Rice Revenue (USD Million) By Country (2021-2032)
Figure 19. Brazil Low GI Rice Revenue (USD Million) By Country (2021-2032)
Figure 20. Argentina Low GI Rice Revenue (USD Million) By Country (2021-2032)
Figure 21. Rest of Asia Pacific Low GI Rice Revenue (USD Million) By Country (2021-2032)
Figure 22. Middle East and Africa Low GI Rice Revenue (USD Million) By Region (2021-2032)
Figure 23. Saudi Arabia Low GI Rice Revenue (USD Million) By Region (2021-2032)
Figure 24. The UAE Low GI Rice Revenue (USD Million) By Region (2021-2032)
Figure 25. Rest of Middle East Low GI Rice Revenue (USD Million) By Region (2021-2032)
Figure 26. South Africa Low GI Rice Revenue (USD Million) By Region (2021-2032)
Figure 27. Africa Low GI Rice Revenue (USD Million) By Region (2021-2032)
Figure 28. North America Low GI Rice Revenue (USD Million) By Type (2021-2032)
Figure 29. North America Low GI Rice Revenue (USD Million) By Application (2021-2032)
Figure 30. North America Low GI Rice Revenue (USD Million) By Product (2021-2032)
Figure 31. Europe Low GI Rice Revenue (USD Million) By Type (2021-2032)
Figure 32. Europe Low GI Rice Revenue (USD Million) By Application (2021-2032)
Figure 33. Europe Low GI Rice Revenue (USD Million) By Product (2021-2032)
Figure 34. Asia Pacific Low GI Rice Revenue (USD Million) By Type (2021-2032)
Figure 35. Asia Pacific Low GI Rice Revenue (USD Million) By Application (2021-2032)
Figure 36. Asia Pacific Low GI Rice Revenue (USD Million) By Product (2021-2032)
Figure 37. South America Low GI Rice Revenue (USD Million) By Type (2021-2032)
Figure 38. South America Low GI Rice Revenue (USD Million) By Application (2021-2032)
Figure 39. South America Low GI Rice Revenue (USD Million) By Product (2021-2032)
Figure 40. Middle East and Africa Low GI Rice Revenue (USD Million) By Type (2021-2032)
Figure 41. Middle East and Africa Low GI Rice Revenue (USD Million) By Application (2021-2032)
Figure 42. Middle East and Africa Low GI Rice Revenue (USD Million) By Product (2021-2032)
By Distribution Channel
Hypermarkets/Supermarkets
Online Retail
Others
Countries Analyzed
North America (US, Canada, Mexico)
Europe (Germany, UK, France, Spain, Italy, Russia, Rest of Europe)
Asia Pacific (China, India, Japan, South Korea, Australia, South East Asia, Rest of Asia)
South America (Brazil, Argentina, Rest of South America)
Middle East and Africa (Saudi Arabia, UAE, Rest of Middle East, South Africa, Egypt, Rest of Africa)
