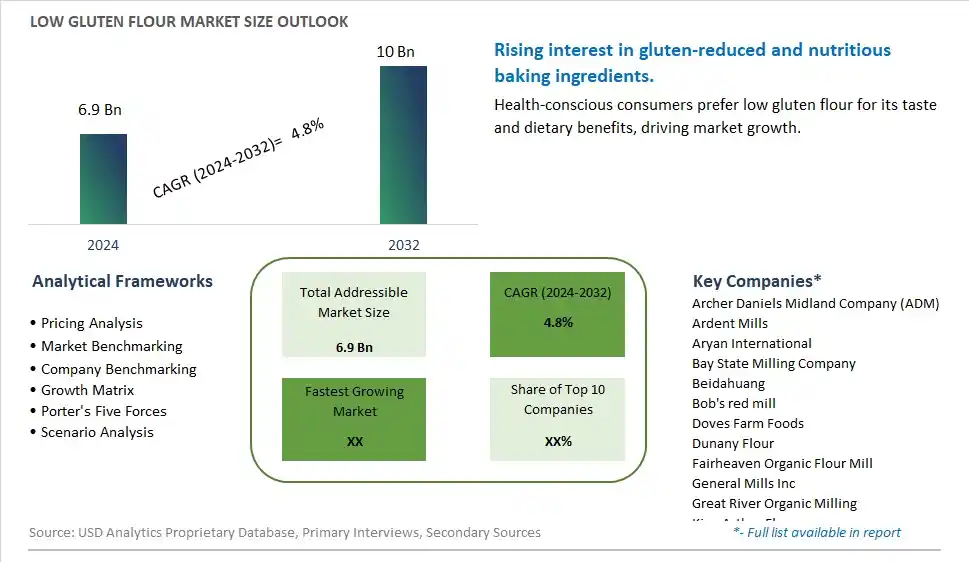
Global Low gluten Flour Market Size is valued at $6.9 Billion in 2024 and is forecast to register a growth rate (CAGR) of 4.8% to reach $10 Billion by 2032.
The global Low gluten Flour Market Comprehensive Study analyzes and forecasts the market size across 6 regions and 24 countries for diverse segments -By Type (Machine Milled Flour, Stone Ground Flour), By Application (Commercial Use, Home Use)
An Introduction to Low gluten Flour Market
In 2024, the low gluten flour market is experiencing significant growth, driven by the demand for gluten-reduced products that cater to individuals with gluten sensitivities and those seeking healthier baking alternatives. Low gluten flour, made from grains with lower gluten content, offers the benefits of traditional flour with reduced gluten levels. The market benefits from innovations in grain breeding and flour processing that enhance product quality and performance. The trend towards clean label and natural ingredients is influencing product development. Increasing consumer awareness of gluten-related health issues and the popularity of gluten-reduced diets are further supporting market growth.
Low gluten Flour Competitive Landscape
The market report analyses the leading companies in the industry including Archer Daniels Midland Company (ADM), Ardent Mills, Aryan International, Bay State Milling Company, Beidahuang, Bob's red mill, Doves Farm Foods, Dunany Flour, Fairheaven Organic Flour Mill, General Mills Inc, Great River Organic Milling, King Arthur Flour, Shipton Mill Ltd, and Others.
Low gluten Flour Market Dynamics
Low Gluten Flour Market Trend: Increasing Adoption of Gluten-Free Diets
The most prominent trend in the Low Gluten Flour Market is the increasing adoption of gluten-free diets. Many consumers are turning to low gluten or gluten-free products due to gluten intolerance or a preference for healthier eating. This trend is driving the demand for low gluten flour, which offers a suitable alternative for those seeking to reduce their gluten intake without compromising on taste or texture.
Low Gluten Flour Market Driver: Rising Awareness of Gluten Intolerance
A key driver in the Low Gluten Flour Market is rising awareness of gluten intolerance and celiac disease. As more people are diagnosed with these conditions, there is a growing demand for gluten-free products. Low gluten flour provides an option for consumers who are sensitive to gluten but do not require a completely gluten-free diet, supporting market growth.
Low Gluten Flour Market Opportunity: Innovation in Baking and Cooking
One significant opportunity in the Low Gluten Flour Market lies in innovation in baking and cooking. Companies can develop new low gluten flour blends that improve the texture and flavor of gluten-free baked goods and other products. By creating high-quality, versatile low gluten flours, manufacturers can attract a broader consumer base and drive market growth .
Low gluten Flour Market Share Analysis: Machine Milled Flour segment generated the highest revenue share in the industry
The largest segment in the Low Gluten Flour Market by type is the Machine Milled Flour segment. Machine milled flour is highly favored in both commercial and home baking due to its consistent quality, fine texture, and higher production efficiency. This type of flour is processed using modern milling technology, which ensures a uniform particle size and better control over the gluten content. Machine milled low gluten flour is widely used in the production of a variety of baked goods, including bread, pastries, and cakes, catering to the growing demand for low gluten options among consumers. The extensive availability of machine milled flour in supermarkets and specialty stores, along with its affordability, further drives its dominance in the market. The reliable quality and widespread usage of machine milled low gluten flour make it the largest segment in this market.
Low gluten Flour Market Share Analysis: Home Use is the fastest growing segment over the forecast period to 2032
The fastest-growing segment in the Low Gluten Flour Market by application is the Home Use segment. The rise in home baking trends, particularly accentuated by the Past few years, has led to a surge in demand for low gluten flour among home bakers. Consumers are increasingly aware of the health benefits associated with low gluten diets, driving the demand for low gluten flour for home cooking and baking. The accessibility of various recipes and baking tutorials online has empowered more people to experiment with baking at home, contributing to the growth of this segment. Additionally, the availability of a wide range of low gluten flour products in convenient packaging sizes tailored for home use further supports this trend. As health-conscious consumers continue to prioritize dietary modifications and seek healthier baking alternatives, the home use segment is expected to experience substantial growth, making it the fastest-growing application in the low gluten flour market leading up to 2032.
Low gluten Flour Market Segmentation
By Type
Machine Milled Flour
Stone Ground Flour
By Application
Commercial Use
Home Use
Countries Analyzed
North America (US, Canada, Mexico)
Europe (Germany, UK, France, Spain, Italy, Russia, Rest of Europe)
Asia Pacific (China, India, Japan, South Korea, Australia, South East Asia, Rest of Asia)
South America (Brazil, Argentina, Rest of South America)
Middle East and Africa (Saudi Arabia, UAE, Rest of Middle East, South Africa, Egypt, Rest of Africa)
Low gluten Flour Companies Profiled in the Study
Archer Daniels Midland Company (ADM)
Ardent Mills
Aryan International
Bay State Milling Company
Beidahuang
Bob's red mill
Doves Farm Foods
Dunany Flour
Fairheaven Organic Flour Mill
General Mills Inc
Great River Organic Milling
King Arthur Flour
Shipton Mill Ltd
*- List Not Exhaustive
Chapter 1. TABLE OF CONTENTS
Chapter 2. Introduction to Low gluten Flour Market
2.1. Market Overview
2.2. Key Statistics and Report Highlights
2.3. Scope of the Comprehensive Study
2.3.1. Market Definition
2.3.2 Countries and Regions Covered
2.3.3 Research Objective
2.3.4 Units, Currency, and Conversions
2.3.5 Industry Value Chain
2.4. Key Market Segments
2.5. Key Companies
2.6. Study Period
Chapter 3. Strategic Analysis Review
3.1. Low gluten Flour Pricing Analysis and Forecast
3.2. Porter’s Five Forces
3.3. Market Ecosystem
3.4. SWOT Analysis
3.5. Regulatory Scenario
3.3. Effects of Inflation, Russia-Ukraine War, moderating economic growth, and other macroeconomic factors
Chapter 4. Competitive Landscape
4.1. Market Share Analysis
4.1.1. Global Low gluten Flour Market Share by Company, 2023
4.1.2. Product Offerings of Leading Low gluten Flour Companies
4.2. Market Entropy
4.2.1. New Product Launches in the Industry
4.2.2. Mergers, Acquisitions, Joint ventures, and Partnerships
4.3. Key Strategies and Best Practices
Chapter 5. Global Market Projections: Best, Reference, and Low Case Scenarios
5.1. Growth Analysis- Case Scenario Definitions
5.2. Low Growth Case Scenario Forecasts
5.3. Reference Growth Case Scenario Forecasts
5.4. High Growth Case Scenario Forecasts
Chapter 6. Market Dynamics
6.1. Low gluten Flour Market Drivers
6.2. Low gluten Flour Market Challenges
6.6. Low gluten Flour Market Opportunities
6.4. Low gluten Flour Market Trends
Chapter 7. Global Low gluten Flour Market Outlook Trends
7.1. Global Low gluten Flour Revenue (USD Million) and CAGR (%) by Type (2021-2032)
7.2. Global Low gluten Flour Revenue (USD Million) and CAGR (%) by Application (2021-2032)
7.3. Global Low gluten Flour Revenue (USD Million) and CAGR (%) by Product (2021-2032)
By Type
Machine Milled Flour
Stone Ground Flour
By Application
Commercial Use
Home Use
Chapter 8. Global Low gluten Flour Regional Analysis and Outlook
8.1. Global Low gluten Flour Revenue (USD Million) By Regions (2021- 2032)
8.2. North America Low gluten Flour Revenue (USD Million) by Country (2021-2032)
8.2.1. United States Low gluten Flour Regional Analysis and Outlook
8.2.2. Canada Low gluten Flour Regional Analysis and Outlook
8.2.3. Mexico Low gluten Flour Regional Analysis and Outlook
8.3. Europe Low gluten Flour Revenue (USD Million), by Country (2021-2032)
8.3.1. Germany Low gluten Flour Regional Analysis and Outlook
8.3.2. France Low gluten Flour Regional Analysis and Outlook
8.3.3. United Kingdom Low gluten Flour Regional Analysis and Outlook
8.3.4. Spain Low gluten Flour Regional Analysis and Outlook
8.3.5. Italy Low gluten Flour Regional Analysis and Outlook
8.3.6. Russia Low gluten Flour Regional Analysis and Outlook
8.3.7. Rest of Europe Low gluten Flour Regional Analysis and Outlook
8.4. Asia Pacific Low gluten Flour Revenue (USD Million) by Country (2021-2032)
8.4.1. China Low gluten Flour Regional Analysis and Outlook
8.4.2. Japan Low gluten Flour Regional Analysis and Outlook
8.4.3. India Low gluten Flour Regional Analysis and Outlook
8.4.4. South Korea Low gluten Flour Regional Analysis and Outlook
8.4.5. Australia Low gluten Flour Regional Analysis and Outlook
8.4.6. South East Asia Low gluten Flour Regional Analysis and Outlook
8.4.7. Rest of Asia Pacific Low gluten Flour Regional Analysis and Outlook
8.5. South America Low gluten Flour Revenue (USD Million), by Country (2021-2032)
8.5.1. Brazil Low gluten Flour Regional Analysis and Outlook
8.5.2. Argentina Low gluten Flour Regional Analysis and Outlook
8.5.3. Rest of South America Low gluten Flour Regional Analysis and Outlook
8.6. Middle East and Africa Low gluten Flour Revenue (USD Million) by Country (2021-2032)
8.6.1. Middle East Low gluten Flour Regional Analysis and Outlook
8.6.2. Africa Low gluten Flour Regional Analysis and Outlook
Chapter 9. North America Low gluten Flour Analysis and Outlook
9.1. North America Low gluten Flour Revenue (USD Million) by Segments (2021-2032)
9.1.1. North America Low gluten Flour Revenue (USD Million) by Type (2021-2032)
9.1.2. North America Low gluten Flour Revenue (USD Million) by Application (2021-2032)
9.1.3. North America Low gluten Flour Revenue (USD Million) by Product (2021-2032)
By Type
Machine Milled Flour
Stone Ground Flour
By Application
Commercial Use
Home Use
Chapter 10. Europe Low gluten Flour Analysis and Outlook
10.1. Europe Low gluten Flour Revenue (USD Million), by Segments (USD Million) (2021-2032)
10.1.1. Europe Low gluten Flour Revenue (USD Million) by Type (2021-2032)
10.1.2. Europe Low gluten Flour Revenue (USD Million) by Application (2021-2032)
10.1.3. Europe Low gluten Flour Revenue (USD Million) by Product (2021-2032)
By Type
Machine Milled Flour
Stone Ground Flour
By Application
Commercial Use
Home Use
Chapter 11. Asia Pacific Low gluten Flour Analysis and Outlook
11.1. Asia Pacific Low gluten Flour Revenue (USD Million), and Revenue (USD Million) by Segments (2021-2032)
11.1.1. Asia Pacific Low gluten Flour Revenue (USD Million) by Type (2021-2032)
11.1.2. Asia Pacific Low gluten Flour Revenue (USD Million) by Application (2021-2032)
11.1.3. Asia Pacific Low gluten Flour Revenue (USD Million) by Product (2021-2032)
By Type
Machine Milled Flour
Stone Ground Flour
By Application
Commercial Use
Home Use
Chapter 12. South America Low gluten Flour Analysis and Outlook
12.1. South America Low gluten Flour Revenue (USD Million), by Segments (2021-2032)
12.1.1. South America Low gluten Flour Revenue (USD Million) by Type (2021-2032)
12.1.2. South America Low gluten Flour Revenue (USD Million) by Application (2021-2032)
12.1.3. South America Low gluten Flour Revenue (USD Million) by Product (2021-2032)
By Type
Machine Milled Flour
Stone Ground Flour
By Application
Commercial Use
Home Use
Chapter 13. Middle East and Africa Low gluten Flour Analysis and Outlook
13.1. Middle East and Africa Low gluten Flour Revenue (USD Million), by Segments (2021-2032)
13.1.1. Middle East and Africa Low gluten Flour Revenue (USD Million) by Type (2021-2032)
13.1.2. Middle East and Africa Low gluten Flour Revenue (USD Million) by Application (2021-2032)
13.1.3. Middle East and Africa Low gluten Flour Revenue (USD Million) by Product (2021-2032)
By Type
Machine Milled Flour
Stone Ground Flour
By Application
Commercial Use
Home Use
Chapter 14. Low gluten Flour Company Profiles
14.1 Business Overview
14.2 Product Profiles
14.3 SWOT Profiles
14.5 Recent Developments
14.6 Financial Profile
List of Companies
Archer Daniels Midland Company (ADM)
Ardent Mills
Aryan International
Bay State Milling Company
Beidahuang
Bob's red mill
Doves Farm Foods
Dunany Flour
Fairheaven Organic Flour Mill
General Mills Inc
Great River Organic Milling
King Arthur Flour
Shipton Mill Ltd
15. Methodology and Data Sources
15.1 Customization Offerings
15.2 Subscription Services
15.3 Related Reports
15.4 Publisher Expertise
LIST OF TABLES
Table 1 Market Segmentation Analysis
Table 2 Global Low gluten Flour Market Share of Leading Companies, 2023
Table 3 Product Offerings of Leading Companies
Table 4 Low Growth Scenario Forecasts
Table 5 Reference Case Growth Scenario
Table 6 High Growth Case Scenario
Table 7 Global Low gluten Flour Revenue (USD Million) And CAGR (%) By Type (2021-2032)
Table 8 Global Low gluten Flour Revenue (USD Million) And CAGR (%) By Application (2021-2032)
Table 9 Global Low gluten Flour Revenue (USD Million) And CAGR (%) By Product (2021-2032)
Table 10 Global Low gluten Flour Market Revenue (USD Million) By Regions (2021-2032)
Table 11 Global Low gluten Flour Market Share (%) By Regions (2021-2032)
Table 12 North America Low gluten Flour Revenue (USD Million) By Country (2021-2032)
Table 13 Europe Low gluten Flour Revenue (USD Million) By Country (2021-2032)
Table 14 Asia Pacific Low gluten Flour Revenue (USD Million) By Country (2021-2032)
Table 15 South America Low gluten Flour Revenue (USD Million) By Country (2021-2032)
Table 16 Middle East and Africa Low gluten Flour Revenue (USD Million) By Region (2021-2032)
Table 17 North America Low gluten Flour Revenue (USD Million) By Type (2021-2032)
Table 18 North America Low gluten Flour Revenue (USD Million) By Application (2021-2032)
Table 19 North America Low gluten Flour Revenue (USD Million) By Product (2021-2032)
Table 20 Europe Low gluten Flour Revenue (USD Million) By Type (2021-2032)
Table 21 Europe Low gluten Flour Revenue (USD Million) By Application (2021-2032)
Table 22 Europe Low gluten Flour Revenue (USD Million) By Product (2021-2032)
Table 23 Asia Pacific Low gluten Flour Revenue (USD Million) By Type (2021-2032)
Table 24 Asia Pacific Low gluten Flour Revenue (USD Million) By Application (2021-2032)
Table 25 Asia Pacific Low gluten Flour Revenue (USD Million) By Product (2021-2032)
Table 26 South America Low gluten Flour Revenue (USD Million) By Type (2021-2032)
Table 27 South America Low gluten Flour Revenue (USD Million) By Application (2021-2032)
Table 28 South America Low gluten Flour Revenue (USD Million) By Product (2021-2032)
Table 29 Middle East and Africa Low gluten Flour Revenue (USD Million) By Type (2021-2032)
Table 30 Middle East and Africa Low gluten Flour Revenue (USD Million) By Application (2021-2032)
Table 31 Middle East and Africa Low gluten Flour Revenue (USD Million) By Product (2021-2032)
LIST OF FIGURES
Figure 1. Market Scope
Figure 2. Pricing Forecasts Per Unit, 2023- 2032
Figure 3. Porter’s Five Forces
Figure 4. Global Low gluten Flour Market Revenue (USD Million) By Regions (2021-2032)
Figure 5. Global Low gluten Flour Market Share (%) By Regions (2023)
Figure 6. North America Low gluten Flour Revenue (USD Million) By Country (2021-2032)
Figure 7. United States Low gluten Flour Revenue (USD Million) By Country (2021-2032)
Figure 8. Canada Low gluten Flour Revenue (USD Million) By Country (2021-2032)
Figure 9. Mexico Low gluten Flour Revenue (USD Million) By Country (2021-2032)
Figure 10. Europe Low gluten Flour Revenue (USD Million) By Country (2021-2032)
Figure 11. Germany Low gluten Flour Revenue (USD Million) By Country (2021-2032)
Figure 12. France Low gluten Flour Revenue (USD Million) By Country (2021-2032)
Figure 13. United Kingdom Low gluten Flour Revenue (USD Million) By Country (2021-2032)
Figure 14. Spain Low gluten Flour Revenue (USD Million) By Country (2021-2032)
Figure 15. Italy Low gluten Flour Revenue (USD Million) By Country (2021-2032)
Figure 16. Russia Low gluten Flour Revenue (USD Million) By Country (2021-2032)
Figure 17. Rest of Europe Low gluten Flour Revenue (USD Million) By Country (2021-2032)
Figure 11. Asia Pacific Low gluten Flour Revenue (USD Million) By Country (2021-2032)
Figure 12. China Low gluten Flour Revenue (USD Million) By Country (2021-2032)
Figure 13. Japan Low gluten Flour Revenue (USD Million) By Country (2021-2032)
Figure 14. India Low gluten Flour Revenue (USD Million) By Country (2021-2032)
Figure 15. South Korea Low gluten Flour Revenue (USD Million) By Country (2021-2032)
Figure 16. Australia Low gluten Flour Revenue (USD Million) By Country (2021-2032)
Figure 17. South East Asia Low gluten Flour Revenue (USD Million) By Country (2021-2032)
Figure 18. South America Low gluten Flour Revenue (USD Million) By Country (2021-2032)
Figure 19. Brazil Low gluten Flour Revenue (USD Million) By Country (2021-2032)
Figure 20. Argentina Low gluten Flour Revenue (USD Million) By Country (2021-2032)
Figure 21. Rest of Asia Pacific Low gluten Flour Revenue (USD Million) By Country (2021-2032)
Figure 22. Middle East and Africa Low gluten Flour Revenue (USD Million) By Region (2021-2032)
Figure 23. Saudi Arabia Low gluten Flour Revenue (USD Million) By Region (2021-2032)
Figure 24. The UAE Low gluten Flour Revenue (USD Million) By Region (2021-2032)
Figure 25. Rest of Middle East Low gluten Flour Revenue (USD Million) By Region (2021-2032)
Figure 26. South Africa Low gluten Flour Revenue (USD Million) By Region (2021-2032)
Figure 27. Africa Low gluten Flour Revenue (USD Million) By Region (2021-2032)
Figure 28. North America Low gluten Flour Revenue (USD Million) By Type (2021-2032)
Figure 29. North America Low gluten Flour Revenue (USD Million) By Application (2021-2032)
Figure 30. North America Low gluten Flour Revenue (USD Million) By Product (2021-2032)
Figure 31. Europe Low gluten Flour Revenue (USD Million) By Type (2021-2032)
Figure 32. Europe Low gluten Flour Revenue (USD Million) By Application (2021-2032)
Figure 33. Europe Low gluten Flour Revenue (USD Million) By Product (2021-2032)
Figure 34. Asia Pacific Low gluten Flour Revenue (USD Million) By Type (2021-2032)
Figure 35. Asia Pacific Low gluten Flour Revenue (USD Million) By Application (2021-2032)
Figure 36. Asia Pacific Low gluten Flour Revenue (USD Million) By Product (2021-2032)
Figure 37. South America Low gluten Flour Revenue (USD Million) By Type (2021-2032)
Figure 38. South America Low gluten Flour Revenue (USD Million) By Application (2021-2032)
Figure 39. South America Low gluten Flour Revenue (USD Million) By Product (2021-2032)
Figure 40. Middle East and Africa Low gluten Flour Revenue (USD Million) By Type (2021-2032)
Figure 41. Middle East and Africa Low gluten Flour Revenue (USD Million) By Application (2021-2032)
Figure 42. Middle East and Africa Low gluten Flour Revenue (USD Million) By Product (2021-2032)
By Type
Machine Milled Flour
Stone Ground Flour
By Application
Commercial Use
Home Use
Countries Analyzed
North America (US, Canada, Mexico)
Europe (Germany, UK, France, Spain, Italy, Russia, Rest of Europe)
Asia Pacific (China, India, Japan, South Korea, Australia, South East Asia, Rest of Asia)
South America (Brazil, Argentina, Rest of South America)
Middle East and Africa (Saudi Arabia, UAE, Rest of Middle East, South Africa, Egypt, Rest of Africa)
