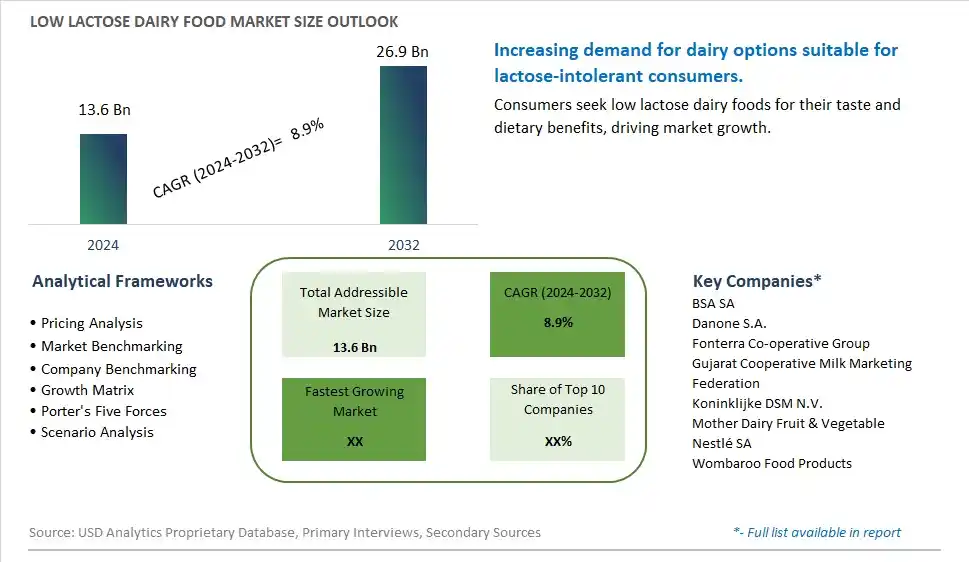
Global Low Lactose Dairy Food Market Size is valued at $13.6 Billion in 2024 and is forecast to register a growth rate (CAGR) of 8.9% to reach $26.9 Billion by 2032.
The global Low Lactose Dairy Food Market Comprehensive Study analyzes and forecasts the market size across 6 regions and 24 countries for diverse segments -By Type (Organic, Conventional), By Application (Food and Beverage Industry, Animal Nutrition Industry, Others)
An Introduction to Low Lactose Dairy Food Market
The low lactose dairy food market in 2024 is thriving, fueled by the demand for dairy products that cater to individuals with lactose intolerance and those seeking digestive health benefits. Low lactose dairy foods, including milk, yogurt, cheese, and ice cream, offer the same taste and nutritional benefits as traditional dairy with reduced lactose content. The market benefits from innovations in lactase enzyme technology and dairy processing that enhance product quality and digestibility. The trend towards clean label and natural ingredients is influencing product development. Increasing consumer awareness of digestive health and the popularity of lactose-free diets are further supporting market growth.
Low Lactose Dairy Food Competitive Landscape
The market report analyses the leading companies in the industry including BSA SA, Danone S.A., Fonterra Co-operative Group, Gujarat Cooperative Milk Marketing Federation, Koninklijke DSM N.V., Mother Dairy Fruit & Vegetable, Nestlé SA, Wombaroo Food Products, and Others.
Low Lactose Dairy Food Market Dynamics
Low Lactose Dairy Food Market Trend: Growing Popularity of Lactose-Free Products
The most prominent trend in the Low Lactose Dairy Food Market is the growing popularity of lactose-free products. As more consumers seek to avoid lactose due to intolerance or dietary preferences, there is an increasing demand for dairy foods that offer the benefits of traditional dairy without the discomfort associated with lactose. This trend is driving the expansion of the low lactose dairy food market.
Low Lactose Dairy Food Market Driver: Increasing Incidence of Lactose Intolerance
A key driver in the Low Lactose Dairy Food Market is the increasing incidence of lactose intolerance. With a significant portion of the global population affected by lactose intolerance, there is a strong demand for dairy products that cater to this demographic. Low lactose dairy foods provide a solution for consumers who want to enjoy dairy without experiencing adverse symptoms, supporting market growth.
Low Lactose Dairy Food Market Opportunity: Expansion into New Dairy Categories
One significant opportunity in the Low Lactose Dairy Food Market lies in the expansion into new dairy categories. Companies can innovate by developing low lactose versions of a wide range of dairy products, such as cheeses, yogurts, and ice creams. By offering a diverse selection of low lactose dairy foods, manufacturers can attract a broader consumer base and drive market growth .
Low Lactose Dairy Food Market Share Analysis: Conventional segment generated the highest revenue share in the industry
The largest segment in the Low Lactose Dairy Food Market by type is the Conventional segment. Conventional low lactose dairy products dominate the market due to their widespread availability, affordability, and consumer familiarity. These products are produced using standard dairy farming and processing practices, making them more accessible to a broad range of consumers compared to organic alternatives. Conventional low lactose dairy products include milk, cheese, yogurt, and ice cream, which are staple items in many households. The affordability and extensive distribution networks of conventional low lactose dairy products, which include supermarkets, grocery stores, and online platforms, ensure their dominance in the market. The combination of accessibility, cost-effectiveness, and wide consumer acceptance makes conventional low lactose dairy products the largest segment in the market.
Low Lactose Dairy Food Market Share Analysis: Food and Beverage Industry is the fastest growing segment over the forecast period to 2032
The fastest-growing segment in the Low Lactose Dairy Food Market by application is the Food and Beverage Industry segment. The food and beverage industry is increasingly incorporating low lactose dairy products into a variety of products to cater to the growing demand for lactose-free options among consumers. This segment is driven by the rising prevalence of lactose intolerance and the increasing awareness of the health benefits associated with low lactose diets. Food manufacturers are innovating and expanding their product lines to include low lactose options such as lactose-free milk, cheese, yogurt, and other dairy-based products. These products are being used in a wide range of applications, from ready-to-drink beverages to baked goods and meal replacements. The growing trend of health-conscious eating and the preference for functional foods are further propelling the demand for low lactose dairy products in the food and beverage industry. As consumers continue to seek healthier and more digestible dairy alternatives, the food and beverage industry segment is expected to witness substantial growth, making it the fastest-growing application in the low lactose dairy food market leading up to 2032.
Low Lactose Dairy Food Market Segmentation
By Type
Organic
Conventional
By Application
Food and Beverage Industry
Animal Nutrition Industry
Others
Countries Analyzed
North America (US, Canada, Mexico)
Europe (Germany, UK, France, Spain, Italy, Russia, Rest of Europe)
Asia Pacific (China, India, Japan, South Korea, Australia, South East Asia, Rest of Asia)
South America (Brazil, Argentina, Rest of South America)
Middle East and Africa (Saudi Arabia, UAE, Rest of Middle East, South Africa, Egypt, Rest of Africa)
Low Lactose Dairy Food Companies Profiled in the Study
BSA SA
Danone S.A.
Fonterra Co-operative Group
Gujarat Cooperative Milk Marketing Federation
Koninklijke DSM N.V.
Mother Dairy Fruit & Vegetable
Nestlé SA
Wombaroo Food Products
*- List Not Exhaustive
Chapter 1. TABLE OF CONTENTS
Chapter 2. Introduction to Low Lactose Dairy Food Market
2.1. Market Overview
2.2. Key Statistics and Report Highlights
2.3. Scope of the Comprehensive Study
2.3.1. Market Definition
2.3.2 Countries and Regions Covered
2.3.3 Research Objective
2.3.4 Units, Currency, and Conversions
2.3.5 Industry Value Chain
2.4. Key Market Segments
2.5. Key Companies
2.6. Study Period
Chapter 3. Strategic Analysis Review
3.1. Low Lactose Dairy Food Pricing Analysis and Forecast
3.2. Porter’s Five Forces
3.3. Market Ecosystem
3.4. SWOT Analysis
3.5. Regulatory Scenario
3.3. Effects of Inflation, Russia-Ukraine War, moderating economic growth, and other macroeconomic factors
Chapter 4. Competitive Landscape
4.1. Market Share Analysis
4.1.1. Global Low Lactose Dairy Food Market Share by Company, 2023
4.1.2. Product Offerings of Leading Low Lactose Dairy Food Companies
4.2. Market Entropy
4.2.1. New Product Launches in the Industry
4.2.2. Mergers, Acquisitions, Joint ventures, and Partnerships
4.3. Key Strategies and Best Practices
Chapter 5. Global Market Projections: Best, Reference, and Low Case Scenarios
5.1. Growth Analysis- Case Scenario Definitions
5.2. Low Growth Case Scenario Forecasts
5.3. Reference Growth Case Scenario Forecasts
5.4. High Growth Case Scenario Forecasts
Chapter 6. Market Dynamics
6.1. Low Lactose Dairy Food Market Drivers
6.2. Low Lactose Dairy Food Market Challenges
6.6. Low Lactose Dairy Food Market Opportunities
6.4. Low Lactose Dairy Food Market Trends
Chapter 7. Global Low Lactose Dairy Food Market Outlook Trends
7.1. Global Low Lactose Dairy Food Revenue (USD Million) and CAGR (%) by Type (2021-2032)
7.2. Global Low Lactose Dairy Food Revenue (USD Million) and CAGR (%) by Application (2021-2032)
7.3. Global Low Lactose Dairy Food Revenue (USD Million) and CAGR (%) by Product (2021-2032)
By Type
Organic
Conventional
By Application
Food and Beverage Industry
Animal Nutrition Industry
Others
Chapter 8. Global Low Lactose Dairy Food Regional Analysis and Outlook
8.1. Global Low Lactose Dairy Food Revenue (USD Million) By Regions (2021- 2032)
8.2. North America Low Lactose Dairy Food Revenue (USD Million) by Country (2021-2032)
8.2.1. United States Low Lactose Dairy Food Regional Analysis and Outlook
8.2.2. Canada Low Lactose Dairy Food Regional Analysis and Outlook
8.2.3. Mexico Low Lactose Dairy Food Regional Analysis and Outlook
8.3. Europe Low Lactose Dairy Food Revenue (USD Million), by Country (2021-2032)
8.3.1. Germany Low Lactose Dairy Food Regional Analysis and Outlook
8.3.2. France Low Lactose Dairy Food Regional Analysis and Outlook
8.3.3. United Kingdom Low Lactose Dairy Food Regional Analysis and Outlook
8.3.4. Spain Low Lactose Dairy Food Regional Analysis and Outlook
8.3.5. Italy Low Lactose Dairy Food Regional Analysis and Outlook
8.3.6. Russia Low Lactose Dairy Food Regional Analysis and Outlook
8.3.7. Rest of Europe Low Lactose Dairy Food Regional Analysis and Outlook
8.4. Asia Pacific Low Lactose Dairy Food Revenue (USD Million) by Country (2021-2032)
8.4.1. China Low Lactose Dairy Food Regional Analysis and Outlook
8.4.2. Japan Low Lactose Dairy Food Regional Analysis and Outlook
8.4.3. India Low Lactose Dairy Food Regional Analysis and Outlook
8.4.4. South Korea Low Lactose Dairy Food Regional Analysis and Outlook
8.4.5. Australia Low Lactose Dairy Food Regional Analysis and Outlook
8.4.6. South East Asia Low Lactose Dairy Food Regional Analysis and Outlook
8.4.7. Rest of Asia Pacific Low Lactose Dairy Food Regional Analysis and Outlook
8.5. South America Low Lactose Dairy Food Revenue (USD Million), by Country (2021-2032)
8.5.1. Brazil Low Lactose Dairy Food Regional Analysis and Outlook
8.5.2. Argentina Low Lactose Dairy Food Regional Analysis and Outlook
8.5.3. Rest of South America Low Lactose Dairy Food Regional Analysis and Outlook
8.6. Middle East and Africa Low Lactose Dairy Food Revenue (USD Million) by Country (2021-2032)
8.6.1. Middle East Low Lactose Dairy Food Regional Analysis and Outlook
8.6.2. Africa Low Lactose Dairy Food Regional Analysis and Outlook
Chapter 9. North America Low Lactose Dairy Food Analysis and Outlook
9.1. North America Low Lactose Dairy Food Revenue (USD Million) by Segments (2021-2032)
9.1.1. North America Low Lactose Dairy Food Revenue (USD Million) by Type (2021-2032)
9.1.2. North America Low Lactose Dairy Food Revenue (USD Million) by Application (2021-2032)
9.1.3. North America Low Lactose Dairy Food Revenue (USD Million) by Product (2021-2032)
By Type
Organic
Conventional
By Application
Food and Beverage Industry
Animal Nutrition Industry
Others
Chapter 10. Europe Low Lactose Dairy Food Analysis and Outlook
10.1. Europe Low Lactose Dairy Food Revenue (USD Million), by Segments (USD Million) (2021-2032)
10.1.1. Europe Low Lactose Dairy Food Revenue (USD Million) by Type (2021-2032)
10.1.2. Europe Low Lactose Dairy Food Revenue (USD Million) by Application (2021-2032)
10.1.3. Europe Low Lactose Dairy Food Revenue (USD Million) by Product (2021-2032)
By Type
Organic
Conventional
By Application
Food and Beverage Industry
Animal Nutrition Industry
Others
Chapter 11. Asia Pacific Low Lactose Dairy Food Analysis and Outlook
11.1. Asia Pacific Low Lactose Dairy Food Revenue (USD Million), and Revenue (USD Million) by Segments (2021-2032)
11.1.1. Asia Pacific Low Lactose Dairy Food Revenue (USD Million) by Type (2021-2032)
11.1.2. Asia Pacific Low Lactose Dairy Food Revenue (USD Million) by Application (2021-2032)
11.1.3. Asia Pacific Low Lactose Dairy Food Revenue (USD Million) by Product (2021-2032)
By Type
Organic
Conventional
By Application
Food and Beverage Industry
Animal Nutrition Industry
Others
Chapter 12. South America Low Lactose Dairy Food Analysis and Outlook
12.1. South America Low Lactose Dairy Food Revenue (USD Million), by Segments (2021-2032)
12.1.1. South America Low Lactose Dairy Food Revenue (USD Million) by Type (2021-2032)
12.1.2. South America Low Lactose Dairy Food Revenue (USD Million) by Application (2021-2032)
12.1.3. South America Low Lactose Dairy Food Revenue (USD Million) by Product (2021-2032)
By Type
Organic
Conventional
By Application
Food and Beverage Industry
Animal Nutrition Industry
Others
Chapter 13. Middle East and Africa Low Lactose Dairy Food Analysis and Outlook
13.1. Middle East and Africa Low Lactose Dairy Food Revenue (USD Million), by Segments (2021-2032)
13.1.1. Middle East and Africa Low Lactose Dairy Food Revenue (USD Million) by Type (2021-2032)
13.1.2. Middle East and Africa Low Lactose Dairy Food Revenue (USD Million) by Application (2021-2032)
13.1.3. Middle East and Africa Low Lactose Dairy Food Revenue (USD Million) by Product (2021-2032)
By Type
Organic
Conventional
By Application
Food and Beverage Industry
Animal Nutrition Industry
Others
Chapter 14. Low Lactose Dairy Food Company Profiles
14.1 Business Overview
14.2 Product Profiles
14.3 SWOT Profiles
14.5 Recent Developments
14.6 Financial Profile
List of Companies
BSA SA
Danone S.A.
Fonterra Co-operative Group
Gujarat Cooperative Milk Marketing Federation
Koninklijke DSM N.V.
Mother Dairy Fruit & Vegetable
Nestlé SA
Wombaroo Food Products
15. Methodology and Data Sources
15.1 Customization Offerings
15.2 Subscription Services
15.3 Related Reports
15.4 Publisher Expertise
LIST OF TABLES
Table 1 Market Segmentation Analysis
Table 2 Global Low Lactose Dairy Food Market Share of Leading Companies, 2023
Table 3 Product Offerings of Leading Companies
Table 4 Low Growth Scenario Forecasts
Table 5 Reference Case Growth Scenario
Table 6 High Growth Case Scenario
Table 7 Global Low Lactose Dairy Food Revenue (USD Million) And CAGR (%) By Type (2021-2032)
Table 8 Global Low Lactose Dairy Food Revenue (USD Million) And CAGR (%) By Application (2021-2032)
Table 9 Global Low Lactose Dairy Food Revenue (USD Million) And CAGR (%) By Product (2021-2032)
Table 10 Global Low Lactose Dairy Food Market Revenue (USD Million) By Regions (2021-2032)
Table 11 Global Low Lactose Dairy Food Market Share (%) By Regions (2021-2032)
Table 12 North America Low Lactose Dairy Food Revenue (USD Million) By Country (2021-2032)
Table 13 Europe Low Lactose Dairy Food Revenue (USD Million) By Country (2021-2032)
Table 14 Asia Pacific Low Lactose Dairy Food Revenue (USD Million) By Country (2021-2032)
Table 15 South America Low Lactose Dairy Food Revenue (USD Million) By Country (2021-2032)
Table 16 Middle East and Africa Low Lactose Dairy Food Revenue (USD Million) By Region (2021-2032)
Table 17 North America Low Lactose Dairy Food Revenue (USD Million) By Type (2021-2032)
Table 18 North America Low Lactose Dairy Food Revenue (USD Million) By Application (2021-2032)
Table 19 North America Low Lactose Dairy Food Revenue (USD Million) By Product (2021-2032)
Table 20 Europe Low Lactose Dairy Food Revenue (USD Million) By Type (2021-2032)
Table 21 Europe Low Lactose Dairy Food Revenue (USD Million) By Application (2021-2032)
Table 22 Europe Low Lactose Dairy Food Revenue (USD Million) By Product (2021-2032)
Table 23 Asia Pacific Low Lactose Dairy Food Revenue (USD Million) By Type (2021-2032)
Table 24 Asia Pacific Low Lactose Dairy Food Revenue (USD Million) By Application (2021-2032)
Table 25 Asia Pacific Low Lactose Dairy Food Revenue (USD Million) By Product (2021-2032)
Table 26 South America Low Lactose Dairy Food Revenue (USD Million) By Type (2021-2032)
Table 27 South America Low Lactose Dairy Food Revenue (USD Million) By Application (2021-2032)
Table 28 South America Low Lactose Dairy Food Revenue (USD Million) By Product (2021-2032)
Table 29 Middle East and Africa Low Lactose Dairy Food Revenue (USD Million) By Type (2021-2032)
Table 30 Middle East and Africa Low Lactose Dairy Food Revenue (USD Million) By Application (2021-2032)
Table 31 Middle East and Africa Low Lactose Dairy Food Revenue (USD Million) By Product (2021-2032)
LIST OF FIGURES
Figure 1. Market Scope
Figure 2. Pricing Forecasts Per Unit, 2023- 2032
Figure 3. Porter’s Five Forces
Figure 4. Global Low Lactose Dairy Food Market Revenue (USD Million) By Regions (2021-2032)
Figure 5. Global Low Lactose Dairy Food Market Share (%) By Regions (2023)
Figure 6. North America Low Lactose Dairy Food Revenue (USD Million) By Country (2021-2032)
Figure 7. United States Low Lactose Dairy Food Revenue (USD Million) By Country (2021-2032)
Figure 8. Canada Low Lactose Dairy Food Revenue (USD Million) By Country (2021-2032)
Figure 9. Mexico Low Lactose Dairy Food Revenue (USD Million) By Country (2021-2032)
Figure 10. Europe Low Lactose Dairy Food Revenue (USD Million) By Country (2021-2032)
Figure 11. Germany Low Lactose Dairy Food Revenue (USD Million) By Country (2021-2032)
Figure 12. France Low Lactose Dairy Food Revenue (USD Million) By Country (2021-2032)
Figure 13. United Kingdom Low Lactose Dairy Food Revenue (USD Million) By Country (2021-2032)
Figure 14. Spain Low Lactose Dairy Food Revenue (USD Million) By Country (2021-2032)
Figure 15. Italy Low Lactose Dairy Food Revenue (USD Million) By Country (2021-2032)
Figure 16. Russia Low Lactose Dairy Food Revenue (USD Million) By Country (2021-2032)
Figure 17. Rest of Europe Low Lactose Dairy Food Revenue (USD Million) By Country (2021-2032)
Figure 11. Asia Pacific Low Lactose Dairy Food Revenue (USD Million) By Country (2021-2032)
Figure 12. China Low Lactose Dairy Food Revenue (USD Million) By Country (2021-2032)
Figure 13. Japan Low Lactose Dairy Food Revenue (USD Million) By Country (2021-2032)
Figure 14. India Low Lactose Dairy Food Revenue (USD Million) By Country (2021-2032)
Figure 15. South Korea Low Lactose Dairy Food Revenue (USD Million) By Country (2021-2032)
Figure 16. Australia Low Lactose Dairy Food Revenue (USD Million) By Country (2021-2032)
Figure 17. South East Asia Low Lactose Dairy Food Revenue (USD Million) By Country (2021-2032)
Figure 18. South America Low Lactose Dairy Food Revenue (USD Million) By Country (2021-2032)
Figure 19. Brazil Low Lactose Dairy Food Revenue (USD Million) By Country (2021-2032)
Figure 20. Argentina Low Lactose Dairy Food Revenue (USD Million) By Country (2021-2032)
Figure 21. Rest of Asia Pacific Low Lactose Dairy Food Revenue (USD Million) By Country (2021-2032)
Figure 22. Middle East and Africa Low Lactose Dairy Food Revenue (USD Million) By Region (2021-2032)
Figure 23. Saudi Arabia Low Lactose Dairy Food Revenue (USD Million) By Region (2021-2032)
Figure 24. The UAE Low Lactose Dairy Food Revenue (USD Million) By Region (2021-2032)
Figure 25. Rest of Middle East Low Lactose Dairy Food Revenue (USD Million) By Region (2021-2032)
Figure 26. South Africa Low Lactose Dairy Food Revenue (USD Million) By Region (2021-2032)
Figure 27. Africa Low Lactose Dairy Food Revenue (USD Million) By Region (2021-2032)
Figure 28. North America Low Lactose Dairy Food Revenue (USD Million) By Type (2021-2032)
Figure 29. North America Low Lactose Dairy Food Revenue (USD Million) By Application (2021-2032)
Figure 30. North America Low Lactose Dairy Food Revenue (USD Million) By Product (2021-2032)
Figure 31. Europe Low Lactose Dairy Food Revenue (USD Million) By Type (2021-2032)
Figure 32. Europe Low Lactose Dairy Food Revenue (USD Million) By Application (2021-2032)
Figure 33. Europe Low Lactose Dairy Food Revenue (USD Million) By Product (2021-2032)
Figure 34. Asia Pacific Low Lactose Dairy Food Revenue (USD Million) By Type (2021-2032)
Figure 35. Asia Pacific Low Lactose Dairy Food Revenue (USD Million) By Application (2021-2032)
Figure 36. Asia Pacific Low Lactose Dairy Food Revenue (USD Million) By Product (2021-2032)
Figure 37. South America Low Lactose Dairy Food Revenue (USD Million) By Type (2021-2032)
Figure 38. South America Low Lactose Dairy Food Revenue (USD Million) By Application (2021-2032)
Figure 39. South America Low Lactose Dairy Food Revenue (USD Million) By Product (2021-2032)
Figure 40. Middle East and Africa Low Lactose Dairy Food Revenue (USD Million) By Type (2021-2032)
Figure 41. Middle East and Africa Low Lactose Dairy Food Revenue (USD Million) By Application (2021-2032)
Figure 42. Middle East and Africa Low Lactose Dairy Food Revenue (USD Million) By Product (2021-2032)
By Type
Organic
Conventional
By Application
Food and Beverage Industry
Animal Nutrition Industry
Others
Countries Analyzed
North America (US, Canada, Mexico)
Europe (Germany, UK, France, Spain, Italy, Russia, Rest of Europe)
Asia Pacific (China, India, Japan, South Korea, Australia, South East Asia, Rest of Asia)
South America (Brazil, Argentina, Rest of South America)
Middle East and Africa (Saudi Arabia, UAE, Rest of Middle East, South Africa, Egypt, Rest of Africa)
