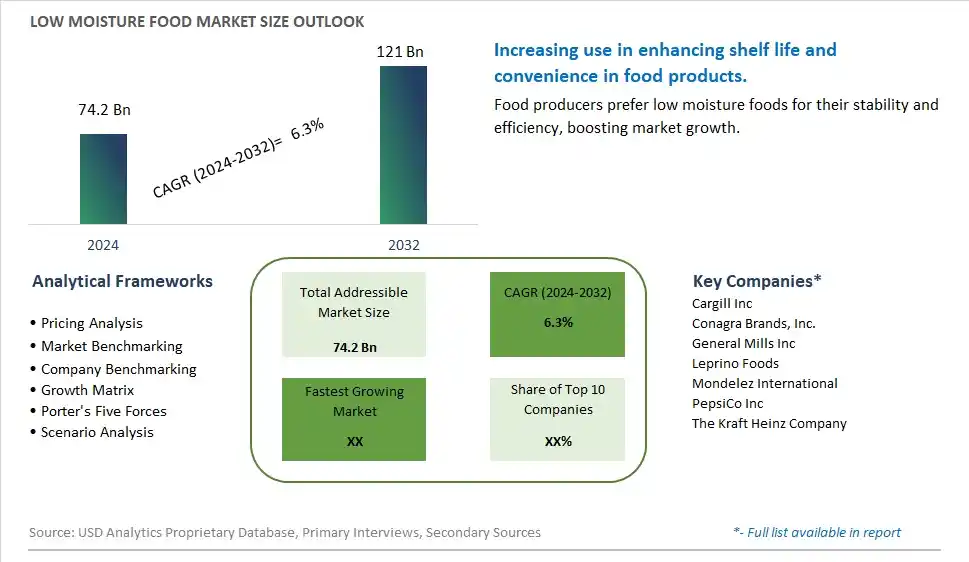
Global Low Moisture Food Market Size is valued at $74.2 Billion in 2024 and is forecast to register a growth rate (CAGR) of 6.3% to reach $121 Billion by 2032.
The global Low Moisture Food Market Comprehensive Study analyzes and forecasts the market size across 6 regions and 24 countries for diverse segments -By Type (Cereals and Grains, Confectionaries and Snacks, Dried Fruits and Vegetables, Others), By Application (Retail Sales, Direct Sales)
An Introduction to Low Moisture Food Market
The low moisture food market in 2024 is thriving, driven by the demand for shelf-stable, long-lasting food products that offer convenience and nutritional value. Low moisture foods, including dried fruits, nuts, jerky, and freeze-dried meals, are popular for their extended shelf life and ease of storage. The market benefits from innovations in drying and packaging technologies that enhance product quality and safety. The trend towards clean label and natural ingredients is influencing product development. Increasing consumer interest in emergency preparedness, outdoor activities, and convenient snacking options is further propelling market growth.
Low Moisture Food Competitive Landscape
The market report analyses the leading companies in the industry including Cargill Inc, Conagra Brands, Inc., General Mills Inc, Leprino Foods, Mondelez International, PepsiCo Inc, The Kraft Heinz Company, and Others.
Low Moisture Food Market Dynamics
Low Moisture Food Market Trend: Increasing Demand for Shelf-Stable Products
The most prominent trend in the Low Moisture Food Market is the increasing demand for shelf-stable products. Low moisture foods, which have a longer shelf life and do not require refrigeration, are becoming popular among consumers seeking convenient and durable food options. This trend is driven by the need for foods that can be stored and consumed over extended periods, especially in regions with limited access to refrigeration.
Low Moisture Food Market Driver: Growth of the Packaged Food Industry
A key driver in the Low Moisture Food Market is the growth of the packaged food industry. As the demand for processed and convenience foods continues to rise, there is an increasing need for products that offer extended shelf life and ease of storage. Low moisture foods, which maintain their quality and safety over time, cater to this demand and support market growth.
Low Moisture Food Market Opportunity: Development of Nutrient-Rich Low Moisture Foods
One significant opportunity in the Low Moisture Food Market lies in the development of nutrient-rich low moisture foods. Companies can innovate by creating low moisture products that are fortified with essential vitamins and minerals, offering a healthy and convenient option for consumers. By focusing on nutrition and convenience, manufacturers can attract health-conscious individuals and drive market growth .
Low Moisture Food Market Share Analysis: Cereals and Grains segment generated the highest revenue share in the industry
The largest segment in the Low Moisture Food Market by type is the Cereals and Grains segment. Cereals and grains, such as rice, wheat, oats, and corn, are staple foods consumed globally, making them a dominant segment in the low moisture food market. These products have a naturally low moisture content, which enhances their shelf life and makes them suitable for long-term storage and transportation. Cereals and grains are fundamental components of many diets around the world, serving as the primary source of carbohydrates and essential nutrients. The widespread use of cereals and grains in various food products, including breakfast cereals, bread, pasta, and snacks, further boosts their demand. The extensive distribution networks and the ability to store these products without refrigeration make cereals and grains the largest segment in the low moisture food market.
Low Moisture Food Market Share Analysis: Retail Sales is the fastest growing segment over the forecast period to 2032
The fastest-growing segment in the Low Moisture Food Market by application is the Retail Sales segment. The growth of this segment is driven by the increasing consumer demand for convenient and long-lasting food products that can be easily purchased and stored at home. Retail sales encompass supermarkets, hypermarkets, convenience stores, and online platforms, all of which have seen significant growth in recent years. The rise of e-commerce and the shift in consumer shopping habits towards online platforms have particularly accelerated the retail sales of low moisture foods. These foods, which include cereals, snacks, dried fruits, and vegetables, are popular among consumers for their convenience, nutritional value, and extended shelf life. Retailers are also expanding their product offerings and introducing innovative packaging solutions to attract health-conscious consumers. As the trend towards convenient, healthy, and sustainable food options continues to grow, the retail sales segment is expected to experience substantial growth, making it the fastest-growing application in the low moisture food market leading up to 2032.
Low Moisture Food Market Segmentation
By Type
Cereals and Grains
Confectionaries and Snacks
Dried Fruits and Vegetables
Others
By Application
Retail Sales
Direct Sales
Countries Analyzed
North America (US, Canada, Mexico)
Europe (Germany, UK, France, Spain, Italy, Russia, Rest of Europe)
Asia Pacific (China, India, Japan, South Korea, Australia, South East Asia, Rest of Asia)
South America (Brazil, Argentina, Rest of South America)
Middle East and Africa (Saudi Arabia, UAE, Rest of Middle East, South Africa, Egypt, Rest of Africa)
Low Moisture Food Companies Profiled in the Study
Cargill Inc
Conagra Brands, Inc.
General Mills Inc
Leprino Foods
Mondelez International
PepsiCo Inc
The Kraft Heinz Company
*- List Not Exhaustive
Chapter 1. TABLE OF CONTENTS
Chapter 2. Introduction to Low Moisture Food Market
2.1. Market Overview
2.2. Key Statistics and Report Highlights
2.3. Scope of the Comprehensive Study
2.3.1. Market Definition
2.3.2 Countries and Regions Covered
2.3.3 Research Objective
2.3.4 Units, Currency, and Conversions
2.3.5 Industry Value Chain
2.4. Key Market Segments
2.5. Key Companies
2.6. Study Period
Chapter 3. Strategic Analysis Review
3.1. Low Moisture Food Pricing Analysis and Forecast
3.2. Porter’s Five Forces
3.3. Market Ecosystem
3.4. SWOT Analysis
3.5. Regulatory Scenario
3.3. Effects of Inflation, Russia-Ukraine War, moderating economic growth, and other macroeconomic factors
Chapter 4. Competitive Landscape
4.1. Market Share Analysis
4.1.1. Global Low Moisture Food Market Share by Company, 2023
4.1.2. Product Offerings of Leading Low Moisture Food Companies
4.2. Market Entropy
4.2.1. New Product Launches in the Industry
4.2.2. Mergers, Acquisitions, Joint ventures, and Partnerships
4.3. Key Strategies and Best Practices
Chapter 5. Global Market Projections: Best, Reference, and Low Case Scenarios
5.1. Growth Analysis- Case Scenario Definitions
5.2. Low Growth Case Scenario Forecasts
5.3. Reference Growth Case Scenario Forecasts
5.4. High Growth Case Scenario Forecasts
Chapter 6. Market Dynamics
6.1. Low Moisture Food Market Drivers
6.2. Low Moisture Food Market Challenges
6.6. Low Moisture Food Market Opportunities
6.4. Low Moisture Food Market Trends
Chapter 7. Global Low Moisture Food Market Outlook Trends
7.1. Global Low Moisture Food Revenue (USD Million) and CAGR (%) by Type (2021-2032)
7.2. Global Low Moisture Food Revenue (USD Million) and CAGR (%) by Application (2021-2032)
7.3. Global Low Moisture Food Revenue (USD Million) and CAGR (%) by Product (2021-2032)
By Type
Cereals and Grains
Confectionaries and Snacks
Dried Fruits and Vegetables
Others
By Application
Retail Sales
Direct Sales
Chapter 8. Global Low Moisture Food Regional Analysis and Outlook
8.1. Global Low Moisture Food Revenue (USD Million) By Regions (2021- 2032)
8.2. North America Low Moisture Food Revenue (USD Million) by Country (2021-2032)
8.2.1. United States Low Moisture Food Regional Analysis and Outlook
8.2.2. Canada Low Moisture Food Regional Analysis and Outlook
8.2.3. Mexico Low Moisture Food Regional Analysis and Outlook
8.3. Europe Low Moisture Food Revenue (USD Million), by Country (2021-2032)
8.3.1. Germany Low Moisture Food Regional Analysis and Outlook
8.3.2. France Low Moisture Food Regional Analysis and Outlook
8.3.3. United Kingdom Low Moisture Food Regional Analysis and Outlook
8.3.4. Spain Low Moisture Food Regional Analysis and Outlook
8.3.5. Italy Low Moisture Food Regional Analysis and Outlook
8.3.6. Russia Low Moisture Food Regional Analysis and Outlook
8.3.7. Rest of Europe Low Moisture Food Regional Analysis and Outlook
8.4. Asia Pacific Low Moisture Food Revenue (USD Million) by Country (2021-2032)
8.4.1. China Low Moisture Food Regional Analysis and Outlook
8.4.2. Japan Low Moisture Food Regional Analysis and Outlook
8.4.3. India Low Moisture Food Regional Analysis and Outlook
8.4.4. South Korea Low Moisture Food Regional Analysis and Outlook
8.4.5. Australia Low Moisture Food Regional Analysis and Outlook
8.4.6. South East Asia Low Moisture Food Regional Analysis and Outlook
8.4.7. Rest of Asia Pacific Low Moisture Food Regional Analysis and Outlook
8.5. South America Low Moisture Food Revenue (USD Million), by Country (2021-2032)
8.5.1. Brazil Low Moisture Food Regional Analysis and Outlook
8.5.2. Argentina Low Moisture Food Regional Analysis and Outlook
8.5.3. Rest of South America Low Moisture Food Regional Analysis and Outlook
8.6. Middle East and Africa Low Moisture Food Revenue (USD Million) by Country (2021-2032)
8.6.1. Middle East Low Moisture Food Regional Analysis and Outlook
8.6.2. Africa Low Moisture Food Regional Analysis and Outlook
Chapter 9. North America Low Moisture Food Analysis and Outlook
9.1. North America Low Moisture Food Revenue (USD Million) by Segments (2021-2032)
9.1.1. North America Low Moisture Food Revenue (USD Million) by Type (2021-2032)
9.1.2. North America Low Moisture Food Revenue (USD Million) by Application (2021-2032)
9.1.3. North America Low Moisture Food Revenue (USD Million) by Product (2021-2032)
By Type
Cereals and Grains
Confectionaries and Snacks
Dried Fruits and Vegetables
Others
By Application
Retail Sales
Direct Sales
Chapter 10. Europe Low Moisture Food Analysis and Outlook
10.1. Europe Low Moisture Food Revenue (USD Million), by Segments (USD Million) (2021-2032)
10.1.1. Europe Low Moisture Food Revenue (USD Million) by Type (2021-2032)
10.1.2. Europe Low Moisture Food Revenue (USD Million) by Application (2021-2032)
10.1.3. Europe Low Moisture Food Revenue (USD Million) by Product (2021-2032)
By Type
Cereals and Grains
Confectionaries and Snacks
Dried Fruits and Vegetables
Others
By Application
Retail Sales
Direct Sales
Chapter 11. Asia Pacific Low Moisture Food Analysis and Outlook
11.1. Asia Pacific Low Moisture Food Revenue (USD Million), and Revenue (USD Million) by Segments (2021-2032)
11.1.1. Asia Pacific Low Moisture Food Revenue (USD Million) by Type (2021-2032)
11.1.2. Asia Pacific Low Moisture Food Revenue (USD Million) by Application (2021-2032)
11.1.3. Asia Pacific Low Moisture Food Revenue (USD Million) by Product (2021-2032)
By Type
Cereals and Grains
Confectionaries and Snacks
Dried Fruits and Vegetables
Others
By Application
Retail Sales
Direct Sales
Chapter 12. South America Low Moisture Food Analysis and Outlook
12.1. South America Low Moisture Food Revenue (USD Million), by Segments (2021-2032)
12.1.1. South America Low Moisture Food Revenue (USD Million) by Type (2021-2032)
12.1.2. South America Low Moisture Food Revenue (USD Million) by Application (2021-2032)
12.1.3. South America Low Moisture Food Revenue (USD Million) by Product (2021-2032)
By Type
Cereals and Grains
Confectionaries and Snacks
Dried Fruits and Vegetables
Others
By Application
Retail Sales
Direct Sales
Chapter 13. Middle East and Africa Low Moisture Food Analysis and Outlook
13.1. Middle East and Africa Low Moisture Food Revenue (USD Million), by Segments (2021-2032)
13.1.1. Middle East and Africa Low Moisture Food Revenue (USD Million) by Type (2021-2032)
13.1.2. Middle East and Africa Low Moisture Food Revenue (USD Million) by Application (2021-2032)
13.1.3. Middle East and Africa Low Moisture Food Revenue (USD Million) by Product (2021-2032)
By Type
Cereals and Grains
Confectionaries and Snacks
Dried Fruits and Vegetables
Others
By Application
Retail Sales
Direct Sales
Chapter 14. Low Moisture Food Company Profiles
14.1 Business Overview
14.2 Product Profiles
14.3 SWOT Profiles
14.5 Recent Developments
14.6 Financial Profile
List of Companies
Cargill Inc
Conagra Brands, Inc.
General Mills Inc
Leprino Foods
Mondelez International
PepsiCo Inc
The Kraft Heinz Company
15. Methodology and Data Sources
15.1 Customization Offerings
15.2 Subscription Services
15.3 Related Reports
15.4 Publisher Expertise
LIST OF TABLES
Table 1 Market Segmentation Analysis
Table 2 Global Low Moisture Food Market Share of Leading Companies, 2023
Table 3 Product Offerings of Leading Companies
Table 4 Low Growth Scenario Forecasts
Table 5 Reference Case Growth Scenario
Table 6 High Growth Case Scenario
Table 7 Global Low Moisture Food Revenue (USD Million) And CAGR (%) By Type (2021-2032)
Table 8 Global Low Moisture Food Revenue (USD Million) And CAGR (%) By Application (2021-2032)
Table 9 Global Low Moisture Food Revenue (USD Million) And CAGR (%) By Product (2021-2032)
Table 10 Global Low Moisture Food Market Revenue (USD Million) By Regions (2021-2032)
Table 11 Global Low Moisture Food Market Share (%) By Regions (2021-2032)
Table 12 North America Low Moisture Food Revenue (USD Million) By Country (2021-2032)
Table 13 Europe Low Moisture Food Revenue (USD Million) By Country (2021-2032)
Table 14 Asia Pacific Low Moisture Food Revenue (USD Million) By Country (2021-2032)
Table 15 South America Low Moisture Food Revenue (USD Million) By Country (2021-2032)
Table 16 Middle East and Africa Low Moisture Food Revenue (USD Million) By Region (2021-2032)
Table 17 North America Low Moisture Food Revenue (USD Million) By Type (2021-2032)
Table 18 North America Low Moisture Food Revenue (USD Million) By Application (2021-2032)
Table 19 North America Low Moisture Food Revenue (USD Million) By Product (2021-2032)
Table 20 Europe Low Moisture Food Revenue (USD Million) By Type (2021-2032)
Table 21 Europe Low Moisture Food Revenue (USD Million) By Application (2021-2032)
Table 22 Europe Low Moisture Food Revenue (USD Million) By Product (2021-2032)
Table 23 Asia Pacific Low Moisture Food Revenue (USD Million) By Type (2021-2032)
Table 24 Asia Pacific Low Moisture Food Revenue (USD Million) By Application (2021-2032)
Table 25 Asia Pacific Low Moisture Food Revenue (USD Million) By Product (2021-2032)
Table 26 South America Low Moisture Food Revenue (USD Million) By Type (2021-2032)
Table 27 South America Low Moisture Food Revenue (USD Million) By Application (2021-2032)
Table 28 South America Low Moisture Food Revenue (USD Million) By Product (2021-2032)
Table 29 Middle East and Africa Low Moisture Food Revenue (USD Million) By Type (2021-2032)
Table 30 Middle East and Africa Low Moisture Food Revenue (USD Million) By Application (2021-2032)
Table 31 Middle East and Africa Low Moisture Food Revenue (USD Million) By Product (2021-2032)
LIST OF FIGURES
Figure 1. Market Scope
Figure 2. Pricing Forecasts Per Unit, 2023- 2032
Figure 3. Porter’s Five Forces
Figure 4. Global Low Moisture Food Market Revenue (USD Million) By Regions (2021-2032)
Figure 5. Global Low Moisture Food Market Share (%) By Regions (2023)
Figure 6. North America Low Moisture Food Revenue (USD Million) By Country (2021-2032)
Figure 7. United States Low Moisture Food Revenue (USD Million) By Country (2021-2032)
Figure 8. Canada Low Moisture Food Revenue (USD Million) By Country (2021-2032)
Figure 9. Mexico Low Moisture Food Revenue (USD Million) By Country (2021-2032)
Figure 10. Europe Low Moisture Food Revenue (USD Million) By Country (2021-2032)
Figure 11. Germany Low Moisture Food Revenue (USD Million) By Country (2021-2032)
Figure 12. France Low Moisture Food Revenue (USD Million) By Country (2021-2032)
Figure 13. United Kingdom Low Moisture Food Revenue (USD Million) By Country (2021-2032)
Figure 14. Spain Low Moisture Food Revenue (USD Million) By Country (2021-2032)
Figure 15. Italy Low Moisture Food Revenue (USD Million) By Country (2021-2032)
Figure 16. Russia Low Moisture Food Revenue (USD Million) By Country (2021-2032)
Figure 17. Rest of Europe Low Moisture Food Revenue (USD Million) By Country (2021-2032)
Figure 11. Asia Pacific Low Moisture Food Revenue (USD Million) By Country (2021-2032)
Figure 12. China Low Moisture Food Revenue (USD Million) By Country (2021-2032)
Figure 13. Japan Low Moisture Food Revenue (USD Million) By Country (2021-2032)
Figure 14. India Low Moisture Food Revenue (USD Million) By Country (2021-2032)
Figure 15. South Korea Low Moisture Food Revenue (USD Million) By Country (2021-2032)
Figure 16. Australia Low Moisture Food Revenue (USD Million) By Country (2021-2032)
Figure 17. South East Asia Low Moisture Food Revenue (USD Million) By Country (2021-2032)
Figure 18. South America Low Moisture Food Revenue (USD Million) By Country (2021-2032)
Figure 19. Brazil Low Moisture Food Revenue (USD Million) By Country (2021-2032)
Figure 20. Argentina Low Moisture Food Revenue (USD Million) By Country (2021-2032)
Figure 21. Rest of Asia Pacific Low Moisture Food Revenue (USD Million) By Country (2021-2032)
Figure 22. Middle East and Africa Low Moisture Food Revenue (USD Million) By Region (2021-2032)
Figure 23. Saudi Arabia Low Moisture Food Revenue (USD Million) By Region (2021-2032)
Figure 24. The UAE Low Moisture Food Revenue (USD Million) By Region (2021-2032)
Figure 25. Rest of Middle East Low Moisture Food Revenue (USD Million) By Region (2021-2032)
Figure 26. South Africa Low Moisture Food Revenue (USD Million) By Region (2021-2032)
Figure 27. Africa Low Moisture Food Revenue (USD Million) By Region (2021-2032)
Figure 28. North America Low Moisture Food Revenue (USD Million) By Type (2021-2032)
Figure 29. North America Low Moisture Food Revenue (USD Million) By Application (2021-2032)
Figure 30. North America Low Moisture Food Revenue (USD Million) By Product (2021-2032)
Figure 31. Europe Low Moisture Food Revenue (USD Million) By Type (2021-2032)
Figure 32. Europe Low Moisture Food Revenue (USD Million) By Application (2021-2032)
Figure 33. Europe Low Moisture Food Revenue (USD Million) By Product (2021-2032)
Figure 34. Asia Pacific Low Moisture Food Revenue (USD Million) By Type (2021-2032)
Figure 35. Asia Pacific Low Moisture Food Revenue (USD Million) By Application (2021-2032)
Figure 36. Asia Pacific Low Moisture Food Revenue (USD Million) By Product (2021-2032)
Figure 37. South America Low Moisture Food Revenue (USD Million) By Type (2021-2032)
Figure 38. South America Low Moisture Food Revenue (USD Million) By Application (2021-2032)
Figure 39. South America Low Moisture Food Revenue (USD Million) By Product (2021-2032)
Figure 40. Middle East and Africa Low Moisture Food Revenue (USD Million) By Type (2021-2032)
Figure 41. Middle East and Africa Low Moisture Food Revenue (USD Million) By Application (2021-2032)
Figure 42. Middle East and Africa Low Moisture Food Revenue (USD Million) By Product (2021-2032)
By Type
Cereals and Grains
Confectionaries and Snacks
Dried Fruits and Vegetables
Others
By Application
Retail Sales
Direct Sales
Countries Analyzed
North America (US, Canada, Mexico)
Europe (Germany, UK, France, Spain, Italy, Russia, Rest of Europe)
Asia Pacific (China, India, Japan, South Korea, Australia, South East Asia, Rest of Asia)
South America (Brazil, Argentina, Rest of South America)
Middle East and Africa (Saudi Arabia, UAE, Rest of Middle East, South Africa, Egypt, Rest of Africa)
