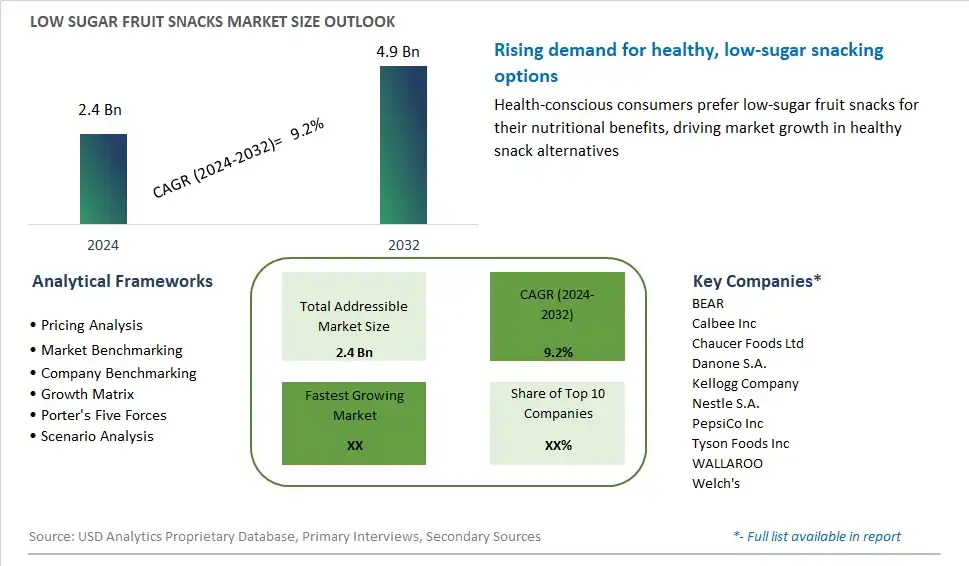
Global Low Sugar Fruit Snacks Market Size is valued at $2.4 Billion in 2024 and is forecast to register a growth rate (CAGR) of 9.2% to reach $4.9 Billion by 2032.
The global Low Sugar Fruit Snacks Market Comprehensive Study analyzes and forecasts the market size across 6 regions and 24 countries for diverse segments -By Product (Fruit Roll-ups, Fruit Bars, Dried Tropical Fruit, Others), By Distribution Channel (Hypermarket & Supermarket, Convenience Store, Online Retailers, Others)
An Introduction to Low Sugar Fruit Snacks Market
In 2024, the low-sugar fruit snacks market is experiencing significant growth, driven by increasing consumer awareness of the health risks associated with high sugar intake. These snacks offer a healthier alternative to traditional fruit snacks, with reduced sugar content achieved through the use of natural sweeteners, sugar alcohols, or innovative processing techniques that retain the natural sweetness of fruits without added sugars. The market includes a variety of products such as dried fruits, fruit bars, and gummies, all marketed as wholesome and nutritious snacks for both children and adults. The clean label movement, which emphasizes transparency in ingredients and minimal processing, is a significant driver of this market. Consumers are increasingly seeking snacks that are not only low in sugar but also free from artificial additives, preservatives, and GMOs. As health trends continue to evolve, the low-sugar fruit snacks market is expected to expand, with new product innovations and flavors appealing to a broad audience seeking healthier snacking options.
Low Sugar Fruit Snacks Competitive Landscape
The market report analyses the leading companies in the industry including BEAR, Calbee Inc, Chaucer Foods Ltd, Danone S.A., Kellogg Company, Nestle S.A., PepsiCo Inc, Tyson Foods Inc, WALLAROO, Welch's, and Others.
Low Sugar Fruit Snacks Market Dynamics
Low Sugar Fruit Snacks Market Trend: Rising Demand for Health-Conscious Snacking
In the low sugar fruit snacks market, a prominent trend is the rising demand for health-conscious snacking options. Consumers are increasingly seeking snacks that offer nutritional benefits while minimizing sugar content, aligning with broader health and wellness trends. This shift is driven by growing awareness of the negative health impacts of excessive sugar consumption, such as obesity, diabetes, and other metabolic disorders. As a result, manufacturers are innovating to create fruit snacks that are naturally sweetened or use alternative sweeteners like stevia or monk fruit, which do not spike blood sugar levels. This trend is further supported by the clean label movement, where consumers prefer products with transparent, minimal, and natural ingredient lists.
Market Driver: Growing Focus on Childhood Nutrition and Obesity Prevention
A key driver in the low sugar fruit snacks market is the growing focus on childhood nutrition and obesity prevention. Parents and caregivers are increasingly vigilant about the nutritional content of the snacks they provide to children, seeking healthier alternatives to traditional sugary snacks. This concern is heightened by alarming rates of childhood obesity and related health issues, prompting a shift towards low sugar options that can be included in school lunches or as convenient, on-the-go snacks. Public health initiatives and educational campaigns that emphasize the importance of reducing sugar intake for children are also contributing to this driver, encouraging both parents and schools to opt for healthier snack choices. Consequently, the demand for low sugar fruit snacks is expected to rise as a part of broader efforts to promote healthy eating habits from a young age.
Market Opportunity: Expansion Through Product Diversification and Functional Benefits
The low sugar fruit snacks market presents significant opportunities for expansion through product diversification and the addition of functional benefits. As consumers become more sophisticated in their snack choices, there is potential to develop a wider variety of low sugar fruit snacks that cater to different tastes and dietary needs. Innovations can include incorporating superfoods, vitamins, and minerals to enhance the nutritional profile of these snacks, making them not only low in sugar but also high in health benefits. Additionally, there is an opportunity to target specific consumer segments, such as sports enthusiasts looking for energy-boosting snacks or individuals seeking snacks with added probiotics for digestive health. By expanding product lines and focusing on functional enhancements, companies can attract a broader audience and differentiate themselves in the competitive snacking market.
Low Sugar Fruit Snacks Market Share Analysis: Dried Tropical Fruit held the dominant market share in 2024
Dried Tropical Fruit is the largest segment in the Low Sugar Fruit Snacks market by product. This dominance can be attributed to several factors. Firstly, dried tropical fruits offer a unique and exotic flavor profile that appeals to a broad consumer base. Additionally, they are perceived as healthier alternatives to traditional sugary snacks due to their natural sweetness and nutrient-rich content. Furthermore, dried tropical fruits have a longer shelf life compared to fresh fruits, making them convenient options for on-the-go snacking and for stocking at home. With increasing awareness of the health benefits associated with reducing sugar intake, consumers are actively seeking out snacks that offer both nutrition and taste, thereby driving the demand for dried tropical fruits. Further, the versatility of dried tropical fruits allows for various consumption occasions, ranging from standalone snacks to ingredients in baked goods and salads, further bolstering their market share. As consumer preferences continue to prioritize health and wellness, the dominance of dried tropical fruits in the low sugar fruit snacks market is expected to persist and even expand in the coming years.
Low Sugar Fruit Snacks Market Share Analysis: Online Retailers market is poised to register the fastest growth rae over the forecast period to 2032
Online Retailers emerge as the fastest-growing segment in the Low Sugar Fruit Snacks market by distribution channel. This rapid growth can be attributed to several key factors. Firstly, the increasing penetration of internet connectivity and the widespread adoption of smartphones have facilitated easier access to online shopping platforms, driving consumer preferences towards the convenience of purchasing groceries and snacks online. Further, the COVID-19 pandemic has accelerated the shift towards e-commerce as consumers prioritize safety and social distancing measures, further boosting online sales of food products. Additionally, online retailers offer a wide variety of low sugar fruit snacks, providing consumers with greater choice and convenience compared to traditional brick-and-mortar stores. Furthermore, the ability to read reviews, compare prices, and avail of doorstep delivery services enhances the overall shopping experience for consumers, contributing to the sustained growth of online retail in the low sugar fruit snacks market. As online shopping continues to evolve and innovate, with the integration of technologies such as AI and machine learning, the segment is poised for continued expansion in the foreseeable future.
Low Sugar Fruit Snacks Market Segmentation
By Product
Fruit Roll-ups
Fruit Bars
Dried Tropical Fruit
Others
By Distribution Channel
Hypermarket & Supermarket
Convenience Store
Online Retailers
Others
Countries Analyzed
North America (US, Canada, Mexico)
Europe (Germany, UK, France, Spain, Italy, Russia, Rest of Europe)
Asia Pacific (China, India, Japan, South Korea, Australia, South East Asia, Rest of Asia)
South America (Brazil, Argentina, Rest of South America)
Middle East and Africa (Saudi Arabia, UAE, Rest of Middle East, South Africa, Egypt, Rest of Africa)
Low Sugar Fruit Snacks Companies Profiled in the Study
BEAR
Calbee Inc
Chaucer Foods Ltd
Danone S.A.
Kellogg Company
Nestle S.A.
PepsiCo Inc
Tyson Foods Inc
WALLAROO
Welch's
*- List Not Exhaustive
Chapter 1. TABLE OF CONTENTS
Chapter 2. Introduction to Low Sugar Fruit Snacks Market
2.1. Market Overview
2.2. Key Statistics and Report Highlights
2.3. Scope of the Comprehensive Study
2.3.1. Market Definition
2.3.2 Countries and Regions Covered
2.3.3 Research Objective
2.3.4 Units, Currency, and Conversions
2.3.5 Industry Value Chain
2.4. Key Market Segments
2.5. Key Companies
2.6. Study Period
Chapter 3. Strategic Analysis Review
3.1. Low Sugar Fruit Snacks Pricing Analysis and Forecast
3.2. Porter’s Five Forces
3.3. Market Ecosystem
3.4. SWOT Analysis
3.5. Regulatory Scenario
3.3. Effects of Inflation, Russia-Ukraine War, moderating economic growth, and other macroeconomic factors
Chapter 4. Competitive Landscape
4.1. Market Share Analysis
4.1.1. Global Low Sugar Fruit Snacks Market Share by Company, 2023
4.1.2. Product Offerings of Leading Low Sugar Fruit Snacks Companies
4.2. Market Entropy
4.2.1. New Product Launches in the Industry
4.2.2. Mergers, Acquisitions, Joint ventures, and Partnerships
4.3. Key Strategies and Best Practices
Chapter 5. Global Market Projections: Best, Reference, and Low Case Scenarios
5.1. Growth Analysis- Case Scenario Definitions
5.2. Low Growth Case Scenario Forecasts
5.3. Reference Growth Case Scenario Forecasts
5.4. High Growth Case Scenario Forecasts
Chapter 6. Market Dynamics
6.1. Low Sugar Fruit Snacks Market Drivers
6.2. Low Sugar Fruit Snacks Market Challenges
6.6. Low Sugar Fruit Snacks Market Opportunities
6.4. Low Sugar Fruit Snacks Market Trends
Chapter 7. Global Low Sugar Fruit Snacks Market Outlook Trends
7.1. Global Low Sugar Fruit Snacks Revenue (USD Million) and CAGR (%) by Type (2021-2032)
7.2. Global Low Sugar Fruit Snacks Revenue (USD Million) and CAGR (%) by Application (2021-2032)
7.3. Global Low Sugar Fruit Snacks Revenue (USD Million) and CAGR (%) by Product (2021-2032)
By Product
Fruit Roll-ups
Fruit Bars
Dried Tropical Fruit
Others
By Distribution Channel
Hypermarket & Supermarket
Convenience Store
Online Retailers
Others
Chapter 8. Global Low Sugar Fruit Snacks Regional Analysis and Outlook
8.1. Global Low Sugar Fruit Snacks Revenue (USD Million) By Regions (2021- 2032)
8.2. North America Low Sugar Fruit Snacks Revenue (USD Million) by Country (2021-2032)
8.2.1. United States Low Sugar Fruit Snacks Regional Analysis and Outlook
8.2.2. Canada Low Sugar Fruit Snacks Regional Analysis and Outlook
8.2.3. Mexico Low Sugar Fruit Snacks Regional Analysis and Outlook
8.3. Europe Low Sugar Fruit Snacks Revenue (USD Million), by Country (2021-2032)
8.3.1. Germany Low Sugar Fruit Snacks Regional Analysis and Outlook
8.3.2. France Low Sugar Fruit Snacks Regional Analysis and Outlook
8.3.3. United Kingdom Low Sugar Fruit Snacks Regional Analysis and Outlook
8.3.4. Spain Low Sugar Fruit Snacks Regional Analysis and Outlook
8.3.5. Italy Low Sugar Fruit Snacks Regional Analysis and Outlook
8.3.6. Russia Low Sugar Fruit Snacks Regional Analysis and Outlook
8.3.7. Rest of Europe Low Sugar Fruit Snacks Regional Analysis and Outlook
8.4. Asia Pacific Low Sugar Fruit Snacks Revenue (USD Million) by Country (2021-2032)
8.4.1. China Low Sugar Fruit Snacks Regional Analysis and Outlook
8.4.2. Japan Low Sugar Fruit Snacks Regional Analysis and Outlook
8.4.3. India Low Sugar Fruit Snacks Regional Analysis and Outlook
8.4.4. South Korea Low Sugar Fruit Snacks Regional Analysis and Outlook
8.4.5. Australia Low Sugar Fruit Snacks Regional Analysis and Outlook
8.4.6. South East Asia Low Sugar Fruit Snacks Regional Analysis and Outlook
8.4.7. Rest of Asia Pacific Low Sugar Fruit Snacks Regional Analysis and Outlook
8.5. South America Low Sugar Fruit Snacks Revenue (USD Million), by Country (2021-2032)
8.5.1. Brazil Low Sugar Fruit Snacks Regional Analysis and Outlook
8.5.2. Argentina Low Sugar Fruit Snacks Regional Analysis and Outlook
8.5.3. Rest of South America Low Sugar Fruit Snacks Regional Analysis and Outlook
8.6. Middle East and Africa Low Sugar Fruit Snacks Revenue (USD Million) by Country (2021-2032)
8.6.1. Middle East Low Sugar Fruit Snacks Regional Analysis and Outlook
8.6.2. Africa Low Sugar Fruit Snacks Regional Analysis and Outlook
Chapter 9. North America Low Sugar Fruit Snacks Analysis and Outlook
9.1. North America Low Sugar Fruit Snacks Revenue (USD Million) by Segments (2021-2032)
9.1.1. North America Low Sugar Fruit Snacks Revenue (USD Million) by Type (2021-2032)
9.1.2. North America Low Sugar Fruit Snacks Revenue (USD Million) by Application (2021-2032)
9.1.3. North America Low Sugar Fruit Snacks Revenue (USD Million) by Product (2021-2032)
By Product
Fruit Roll-ups
Fruit Bars
Dried Tropical Fruit
Others
By Distribution Channel
Hypermarket & Supermarket
Convenience Store
Online Retailers
Others
Chapter 10. Europe Low Sugar Fruit Snacks Analysis and Outlook
10.1. Europe Low Sugar Fruit Snacks Revenue (USD Million), by Segments (USD Million) (2021-2032)
10.1.1. Europe Low Sugar Fruit Snacks Revenue (USD Million) by Type (2021-2032)
10.1.2. Europe Low Sugar Fruit Snacks Revenue (USD Million) by Application (2021-2032)
10.1.3. Europe Low Sugar Fruit Snacks Revenue (USD Million) by Product (2021-2032)
By Product
Fruit Roll-ups
Fruit Bars
Dried Tropical Fruit
Others
By Distribution Channel
Hypermarket & Supermarket
Convenience Store
Online Retailers
Others
Chapter 11. Asia Pacific Low Sugar Fruit Snacks Analysis and Outlook
11.1. Asia Pacific Low Sugar Fruit Snacks Revenue (USD Million), and Revenue (USD Million) by Segments (2021-2032)
11.1.1. Asia Pacific Low Sugar Fruit Snacks Revenue (USD Million) by Type (2021-2032)
11.1.2. Asia Pacific Low Sugar Fruit Snacks Revenue (USD Million) by Application (2021-2032)
11.1.3. Asia Pacific Low Sugar Fruit Snacks Revenue (USD Million) by Product (2021-2032)
By Product
Fruit Roll-ups
Fruit Bars
Dried Tropical Fruit
Others
By Distribution Channel
Hypermarket & Supermarket
Convenience Store
Online Retailers
Others
Chapter 12. South America Low Sugar Fruit Snacks Analysis and Outlook
12.1. South America Low Sugar Fruit Snacks Revenue (USD Million), by Segments (2021-2032)
12.1.1. South America Low Sugar Fruit Snacks Revenue (USD Million) by Type (2021-2032)
12.1.2. South America Low Sugar Fruit Snacks Revenue (USD Million) by Application (2021-2032)
12.1.3. South America Low Sugar Fruit Snacks Revenue (USD Million) by Product (2021-2032)
By Product
Fruit Roll-ups
Fruit Bars
Dried Tropical Fruit
Others
By Distribution Channel
Hypermarket & Supermarket
Convenience Store
Online Retailers
Others
Chapter 13. Middle East and Africa Low Sugar Fruit Snacks Analysis and Outlook
13.1. Middle East and Africa Low Sugar Fruit Snacks Revenue (USD Million), by Segments (2021-2032)
13.1.1. Middle East and Africa Low Sugar Fruit Snacks Revenue (USD Million) by Type (2021-2032)
13.1.2. Middle East and Africa Low Sugar Fruit Snacks Revenue (USD Million) by Application (2021-2032)
13.1.3. Middle East and Africa Low Sugar Fruit Snacks Revenue (USD Million) by Product (2021-2032)
By Product
Fruit Roll-ups
Fruit Bars
Dried Tropical Fruit
Others
By Distribution Channel
Hypermarket & Supermarket
Convenience Store
Online Retailers
Others
Chapter 14. Low Sugar Fruit Snacks Company Profiles
14.1 Business Overview
14.2 Product Profiles
14.3 SWOT Profiles
14.5 Recent Developments
14.6 Financial Profile
List of Companies
BEAR
Calbee Inc
Chaucer Foods Ltd
Danone S.A.
Kellogg Company
Nestle S.A.
PepsiCo Inc
Tyson Foods Inc
WALLAROO
Welch's
15. Methodology and Data Sources
15.1 Customization Offerings
15.2 Subscription Services
15.3 Related Reports
15.4 Publisher Expertise
LIST OF TABLES
Table 1 Market Segmentation Analysis
Table 2 Global Low Sugar Fruit Snacks Market Share of Leading Companies, 2023
Table 3 Product Offerings of Leading Companies
Table 4 Low Growth Scenario Forecasts
Table 5 Reference Case Growth Scenario
Table 6 High Growth Case Scenario
Table 7 Global Low Sugar Fruit Snacks Revenue (USD Million) And CAGR (%) By Type (2021-2032)
Table 8 Global Low Sugar Fruit Snacks Revenue (USD Million) And CAGR (%) By Application (2021-2032)
Table 9 Global Low Sugar Fruit Snacks Revenue (USD Million) And CAGR (%) By Product (2021-2032)
Table 10 Global Low Sugar Fruit Snacks Market Revenue (USD Million) By Regions (2021-2032)
Table 11 Global Low Sugar Fruit Snacks Market Share (%) By Regions (2021-2032)
Table 12 North America Low Sugar Fruit Snacks Revenue (USD Million) By Country (2021-2032)
Table 13 Europe Low Sugar Fruit Snacks Revenue (USD Million) By Country (2021-2032)
Table 14 Asia Pacific Low Sugar Fruit Snacks Revenue (USD Million) By Country (2021-2032)
Table 15 South America Low Sugar Fruit Snacks Revenue (USD Million) By Country (2021-2032)
Table 16 Middle East and Africa Low Sugar Fruit Snacks Revenue (USD Million) By Region (2021-2032)
Table 17 North America Low Sugar Fruit Snacks Revenue (USD Million) By Type (2021-2032)
Table 18 North America Low Sugar Fruit Snacks Revenue (USD Million) By Application (2021-2032)
Table 19 North America Low Sugar Fruit Snacks Revenue (USD Million) By Product (2021-2032)
Table 20 Europe Low Sugar Fruit Snacks Revenue (USD Million) By Type (2021-2032)
Table 21 Europe Low Sugar Fruit Snacks Revenue (USD Million) By Application (2021-2032)
Table 22 Europe Low Sugar Fruit Snacks Revenue (USD Million) By Product (2021-2032)
Table 23 Asia Pacific Low Sugar Fruit Snacks Revenue (USD Million) By Type (2021-2032)
Table 24 Asia Pacific Low Sugar Fruit Snacks Revenue (USD Million) By Application (2021-2032)
Table 25 Asia Pacific Low Sugar Fruit Snacks Revenue (USD Million) By Product (2021-2032)
Table 26 South America Low Sugar Fruit Snacks Revenue (USD Million) By Type (2021-2032)
Table 27 South America Low Sugar Fruit Snacks Revenue (USD Million) By Application (2021-2032)
Table 28 South America Low Sugar Fruit Snacks Revenue (USD Million) By Product (2021-2032)
Table 29 Middle East and Africa Low Sugar Fruit Snacks Revenue (USD Million) By Type (2021-2032)
Table 30 Middle East and Africa Low Sugar Fruit Snacks Revenue (USD Million) By Application (2021-2032)
Table 31 Middle East and Africa Low Sugar Fruit Snacks Revenue (USD Million) By Product (2021-2032)
LIST OF FIGURES
Figure 1. Market Scope
Figure 2. Pricing Forecasts Per Unit, 2023- 2032
Figure 3. Porter’s Five Forces
Figure 4. Global Low Sugar Fruit Snacks Market Revenue (USD Million) By Regions (2021-2032)
Figure 5. Global Low Sugar Fruit Snacks Market Share (%) By Regions (2023)
Figure 6. North America Low Sugar Fruit Snacks Revenue (USD Million) By Country (2021-2032)
Figure 7. United States Low Sugar Fruit Snacks Revenue (USD Million) By Country (2021-2032)
Figure 8. Canada Low Sugar Fruit Snacks Revenue (USD Million) By Country (2021-2032)
Figure 9. Mexico Low Sugar Fruit Snacks Revenue (USD Million) By Country (2021-2032)
Figure 10. Europe Low Sugar Fruit Snacks Revenue (USD Million) By Country (2021-2032)
Figure 11. Germany Low Sugar Fruit Snacks Revenue (USD Million) By Country (2021-2032)
Figure 12. France Low Sugar Fruit Snacks Revenue (USD Million) By Country (2021-2032)
Figure 13. United Kingdom Low Sugar Fruit Snacks Revenue (USD Million) By Country (2021-2032)
Figure 14. Spain Low Sugar Fruit Snacks Revenue (USD Million) By Country (2021-2032)
Figure 15. Italy Low Sugar Fruit Snacks Revenue (USD Million) By Country (2021-2032)
Figure 16. Russia Low Sugar Fruit Snacks Revenue (USD Million) By Country (2021-2032)
Figure 17. Rest of Europe Low Sugar Fruit Snacks Revenue (USD Million) By Country (2021-2032)
Figure 11. Asia Pacific Low Sugar Fruit Snacks Revenue (USD Million) By Country (2021-2032)
Figure 12. China Low Sugar Fruit Snacks Revenue (USD Million) By Country (2021-2032)
Figure 13. Japan Low Sugar Fruit Snacks Revenue (USD Million) By Country (2021-2032)
Figure 14. India Low Sugar Fruit Snacks Revenue (USD Million) By Country (2021-2032)
Figure 15. South Korea Low Sugar Fruit Snacks Revenue (USD Million) By Country (2021-2032)
Figure 16. Australia Low Sugar Fruit Snacks Revenue (USD Million) By Country (2021-2032)
Figure 17. South East Asia Low Sugar Fruit Snacks Revenue (USD Million) By Country (2021-2032)
Figure 18. South America Low Sugar Fruit Snacks Revenue (USD Million) By Country (2021-2032)
Figure 19. Brazil Low Sugar Fruit Snacks Revenue (USD Million) By Country (2021-2032)
Figure 20. Argentina Low Sugar Fruit Snacks Revenue (USD Million) By Country (2021-2032)
Figure 21. Rest of Asia Pacific Low Sugar Fruit Snacks Revenue (USD Million) By Country (2021-2032)
Figure 22. Middle East and Africa Low Sugar Fruit Snacks Revenue (USD Million) By Region (2021-2032)
Figure 23. Saudi Arabia Low Sugar Fruit Snacks Revenue (USD Million) By Region (2021-2032)
Figure 24. The UAE Low Sugar Fruit Snacks Revenue (USD Million) By Region (2021-2032)
Figure 25. Rest of Middle East Low Sugar Fruit Snacks Revenue (USD Million) By Region (2021-2032)
Figure 26. South Africa Low Sugar Fruit Snacks Revenue (USD Million) By Region (2021-2032)
Figure 27. Africa Low Sugar Fruit Snacks Revenue (USD Million) By Region (2021-2032)
Figure 28. North America Low Sugar Fruit Snacks Revenue (USD Million) By Type (2021-2032)
Figure 29. North America Low Sugar Fruit Snacks Revenue (USD Million) By Application (2021-2032)
Figure 30. North America Low Sugar Fruit Snacks Revenue (USD Million) By Product (2021-2032)
Figure 31. Europe Low Sugar Fruit Snacks Revenue (USD Million) By Type (2021-2032)
Figure 32. Europe Low Sugar Fruit Snacks Revenue (USD Million) By Application (2021-2032)
Figure 33. Europe Low Sugar Fruit Snacks Revenue (USD Million) By Product (2021-2032)
Figure 34. Asia Pacific Low Sugar Fruit Snacks Revenue (USD Million) By Type (2021-2032)
Figure 35. Asia Pacific Low Sugar Fruit Snacks Revenue (USD Million) By Application (2021-2032)
Figure 36. Asia Pacific Low Sugar Fruit Snacks Revenue (USD Million) By Product (2021-2032)
Figure 37. South America Low Sugar Fruit Snacks Revenue (USD Million) By Type (2021-2032)
Figure 38. South America Low Sugar Fruit Snacks Revenue (USD Million) By Application (2021-2032)
Figure 39. South America Low Sugar Fruit Snacks Revenue (USD Million) By Product (2021-2032)
Figure 40. Middle East and Africa Low Sugar Fruit Snacks Revenue (USD Million) By Type (2021-2032)
Figure 41. Middle East and Africa Low Sugar Fruit Snacks Revenue (USD Million) By Application (2021-2032)
Figure 42. Middle East and Africa Low Sugar Fruit Snacks Revenue (USD Million) By Product (2021-2032)
By Product
Fruit Roll-ups
Fruit Bars
Dried Tropical Fruit
Others
By Distribution Channel
Hypermarket & Supermarket
Convenience Store
Online Retailers
Others
Countries Analyzed
North America (US, Canada, Mexico)
Europe (Germany, UK, France, Spain, Italy, Russia, Rest of Europe)
Asia Pacific (China, India, Japan, South Korea, Australia, South East Asia, Rest of Asia)
South America (Brazil, Argentina, Rest of South America)
Middle East and Africa (Saudi Arabia, UAE, Rest of Middle East, South Africa, Egypt, Rest of Africa)
