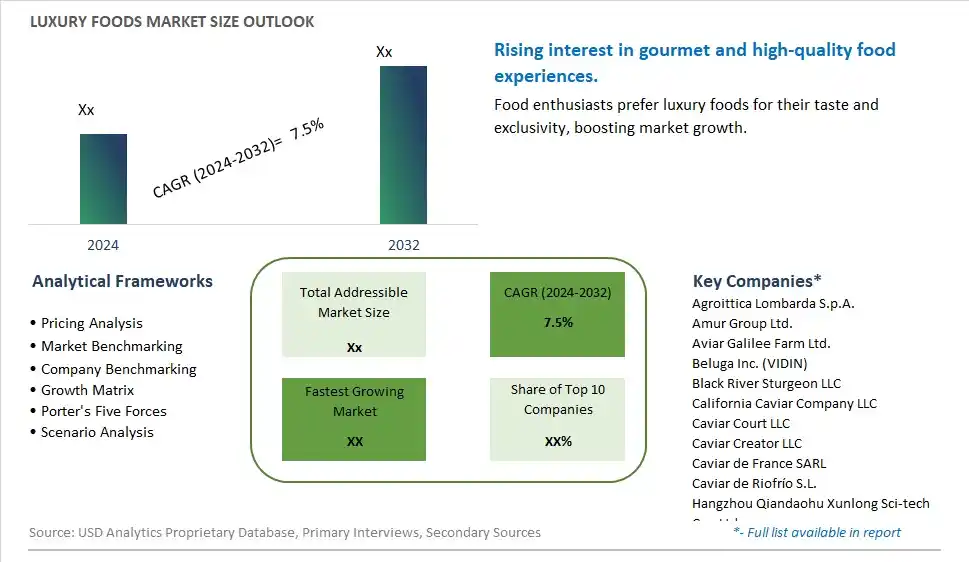
Global Luxury Foods Market Size is valued at $XX Million in 2024 and is forecast to register a growth rate (CAGR) of 7.5% to reach $XX Million by 2032.
The global Luxury Foods Market Comprehensive Study analyzes and forecasts the market size across 6 regions and 24 countries for diverse segments -By Type (Foie Gras, Caviar, Truffle), By Application (Direct Consumption, Food Processing Industry (FPI))
An Introduction to Luxury Foods Market
In 2024, the luxury foods market is thriving, fueled by the demand for high-end, artisanal, and gourmet food products that offer exceptional quality and exclusivity. Luxury foods, including fine cheeses, truffles, caviar, and premium meats, cater to consumers seeking unique and indulgent culinary experiences. The market benefits from innovations in food production and preservation techniques that ensure the highest standards of quality and taste. The trend towards ethical sourcing and sustainable production practices is influencing market dynamics. Increasing consumer interest in fine dining and the popularity of food tourism are further supporting market growth for luxury foods.
Luxury Foods Competitive Landscape
The market report analyses the leading companies in the industry including Agroittica Lombarda S.p.A., Amur Group Ltd., Aviar Galilee Farm Ltd., Beluga Inc. (VIDIN), Black River Sturgeon LLC, California Caviar Company LLC, Caviar Court LLC, Caviar Creator LLC, Caviar de France SARL, Caviar de Riofrío S.L., Hangzhou Qiandaohu Xunlong Sci-tech Co., Ltd., Hubei Tianxia Fisheries Co., Ltd., Osage Catfisheries Inc., Runzhao Fisheries Co., Ltd., Russian Caviar House LLC, Sterling Caviar LLC, Sturgeon Aquafarms LLC, and Others.
Luxury Foods Market Dynamics
Luxury Foods Market Trend: Growing Popularity of Gourmet and Specialty Foods
The most prominent trend in the Luxury Foods Market is the growing popularity of gourmet and specialty foods. Consumers are increasingly seeking high-quality, artisanal food products that offer unique and luxurious experiences. This trend is driven by the desire for premium and sophisticated food options that cater to discerning tastes.
Luxury Foods Market Driver: Rising Disposable Income and Affluent Consumer Base
A key driver in the Luxury Foods Market is rising disposable income and an affluent consumer base. As consumers have more spending power, they are willing to invest in high-quality and exclusive food products. This driver supports the growth of the luxury foods market as manufacturers cater to the demands of affluent and discerning consumers.
Luxury Foods Market Opportunity: Expansion into Emerging Markets
One significant opportunity in the Luxury Foods Market lies in expansion into emerging markets. As the middle class and affluent population continue to grow in developing regions, there is a rising demand for luxury and gourmet foods. Companies that invest in marketing and distribution in these markets can capture significant market share and drive growth .
Luxury Foods Market Share Analysis: Truffle segment generated the highest revenue share in the industry
The largest segment in the Luxury Foods Market by type is the Truffle segment. Truffles are highly prized in the culinary world for their unique aroma and flavor, which can elevate even the simplest of dishes. These fungi are considered a delicacy and are often used in gourmet cooking, making them a staple in high-end restaurants and luxury food markets. Truffles, particularly black and white varieties, command high prices due to their rarity and the difficulty involved in harvesting them. The growing demand for premium and exotic ingredients among food enthusiasts and chefs further drives the market for truffles. Their versatility in culinary applications, including truffle oil, truffle butter, and truffle-infused products, adds to their appeal. The combination of their esteemed status, distinctive taste, and high market value ensures that truffles remain the largest segment in the luxury foods market.
Luxury Foods Market Share Analysis: Direct Consumption is the fastest growing segment over the forecast period to 2032
The fastest-growing segment in the Luxury Foods Market by application is the Direct Consumption segment. The increasing consumer interest in high-quality, artisanal, and gourmet foods is driving the growth of this segment. Direct consumption of luxury foods such as truffles, foie gras, and caviar is becoming more popular as consumers seek unique and indulgent culinary experiences. The rise of food tourism, cooking shows, and the influence of social media have heightened consumer awareness and desire for luxury food products that were once primarily reserved for elite dining establishments. This trend is further supported by the availability of luxury foods in specialty stores, online retailers, and through direct-to-consumer channels, making it easier for consumers to access these premium products. As more people are willing to spend on exclusive and high-end food items for personal enjoyment or special occasions, the direct consumption segment is expected to experience significant growth, making it the fastest-growing application in the luxury foods market leading up to 2032.
Luxury Foods Market Segmentation
By Type
Foie Gras
Caviar
Truffle
By Application
Direct Consumption
Food Processing Industry (FPI)
Countries Analyzed
North America (US, Canada, Mexico)
Europe (Germany, UK, France, Spain, Italy, Russia, Rest of Europe)
Asia Pacific (China, India, Japan, South Korea, Australia, South East Asia, Rest of Asia)
South America (Brazil, Argentina, Rest of South America)
Middle East and Africa (Saudi Arabia, UAE, Rest of Middle East, South Africa, Egypt, Rest of Africa)
Luxury Foods Companies Profiled in the Study
Agroittica Lombarda S.p.A.
Amur Group Ltd.
Aviar Galilee Farm Ltd.
Beluga Inc. (VIDIN)
Black River Sturgeon LLC
California Caviar Company LLC
Caviar Court LLC
Caviar Creator LLC
Caviar de France SARL
Caviar de Riofrío S.L.
Hangzhou Qiandaohu Xunlong Sci-tech Co., Ltd.
Hubei Tianxia Fisheries Co., Ltd.
Osage Catfisheries Inc.
Runzhao Fisheries Co., Ltd.
Russian Caviar House LLC
Sterling Caviar LLC
Sturgeon Aquafarms LLC
*- List Not Exhaustive
Chapter 1. TABLE OF CONTENTS
Chapter 2. Introduction to Luxury Foods Market
2.1. Market Overview
2.2. Key Statistics and Report Highlights
2.3. Scope of the Comprehensive Study
2.3.1. Market Definition
2.3.2 Countries and Regions Covered
2.3.3 Research Objective
2.3.4 Units, Currency, and Conversions
2.3.5 Industry Value Chain
2.4. Key Market Segments
2.5. Key Companies
2.6. Study Period
Chapter 3. Strategic Analysis Review
3.1. Luxury Foods Pricing Analysis and Forecast
3.2. Porter’s Five Forces
3.3. Market Ecosystem
3.4. SWOT Analysis
3.5. Regulatory Scenario
3.3. Effects of Inflation, Russia-Ukraine War, moderating economic growth, and other macroeconomic factors
Chapter 4. Competitive Landscape
4.1. Market Share Analysis
4.1.1. Global Luxury Foods Market Share by Company, 2023
4.1.2. Product Offerings of Leading Luxury Foods Companies
4.2. Market Entropy
4.2.1. New Product Launches in the Industry
4.2.2. Mergers, Acquisitions, Joint ventures, and Partnerships
4.3. Key Strategies and Best Practices
Chapter 5. Global Market Projections: Best, Reference, and Low Case Scenarios
5.1. Growth Analysis- Case Scenario Definitions
5.2. Low Growth Case Scenario Forecasts
5.3. Reference Growth Case Scenario Forecasts
5.4. High Growth Case Scenario Forecasts
Chapter 6. Market Dynamics
6.1. Luxury Foods Market Drivers
6.2. Luxury Foods Market Challenges
6.6. Luxury Foods Market Opportunities
6.4. Luxury Foods Market Trends
Chapter 7. Global Luxury Foods Market Outlook Trends
7.1. Global Luxury Foods Revenue (USD Million) and CAGR (%) by Type (2021-2032)
7.2. Global Luxury Foods Revenue (USD Million) and CAGR (%) by Application (2021-2032)
7.3. Global Luxury Foods Revenue (USD Million) and CAGR (%) by Product (2021-2032)
By Type
Foie Gras
Caviar
Truffle
By Application
Direct Consumption
Food Processing Industry (FPI)
Chapter 8. Global Luxury Foods Regional Analysis and Outlook
8.1. Global Luxury Foods Revenue (USD Million) By Regions (2021- 2032)
8.2. North America Luxury Foods Revenue (USD Million) by Country (2021-2032)
8.2.1. United States Luxury Foods Regional Analysis and Outlook
8.2.2. Canada Luxury Foods Regional Analysis and Outlook
8.2.3. Mexico Luxury Foods Regional Analysis and Outlook
8.3. Europe Luxury Foods Revenue (USD Million), by Country (2021-2032)
8.3.1. Germany Luxury Foods Regional Analysis and Outlook
8.3.2. France Luxury Foods Regional Analysis and Outlook
8.3.3. United Kingdom Luxury Foods Regional Analysis and Outlook
8.3.4. Spain Luxury Foods Regional Analysis and Outlook
8.3.5. Italy Luxury Foods Regional Analysis and Outlook
8.3.6. Russia Luxury Foods Regional Analysis and Outlook
8.3.7. Rest of Europe Luxury Foods Regional Analysis and Outlook
8.4. Asia Pacific Luxury Foods Revenue (USD Million) by Country (2021-2032)
8.4.1. China Luxury Foods Regional Analysis and Outlook
8.4.2. Japan Luxury Foods Regional Analysis and Outlook
8.4.3. India Luxury Foods Regional Analysis and Outlook
8.4.4. South Korea Luxury Foods Regional Analysis and Outlook
8.4.5. Australia Luxury Foods Regional Analysis and Outlook
8.4.6. South East Asia Luxury Foods Regional Analysis and Outlook
8.4.7. Rest of Asia Pacific Luxury Foods Regional Analysis and Outlook
8.5. South America Luxury Foods Revenue (USD Million), by Country (2021-2032)
8.5.1. Brazil Luxury Foods Regional Analysis and Outlook
8.5.2. Argentina Luxury Foods Regional Analysis and Outlook
8.5.3. Rest of South America Luxury Foods Regional Analysis and Outlook
8.6. Middle East and Africa Luxury Foods Revenue (USD Million) by Country (2021-2032)
8.6.1. Middle East Luxury Foods Regional Analysis and Outlook
8.6.2. Africa Luxury Foods Regional Analysis and Outlook
Chapter 9. North America Luxury Foods Analysis and Outlook
9.1. North America Luxury Foods Revenue (USD Million) by Segments (2021-2032)
9.1.1. North America Luxury Foods Revenue (USD Million) by Type (2021-2032)
9.1.2. North America Luxury Foods Revenue (USD Million) by Application (2021-2032)
9.1.3. North America Luxury Foods Revenue (USD Million) by Product (2021-2032)
By Type
Foie Gras
Caviar
Truffle
By Application
Direct Consumption
Food Processing Industry (FPI)
Chapter 10. Europe Luxury Foods Analysis and Outlook
10.1. Europe Luxury Foods Revenue (USD Million), by Segments (USD Million) (2021-2032)
10.1.1. Europe Luxury Foods Revenue (USD Million) by Type (2021-2032)
10.1.2. Europe Luxury Foods Revenue (USD Million) by Application (2021-2032)
10.1.3. Europe Luxury Foods Revenue (USD Million) by Product (2021-2032)
By Type
Foie Gras
Caviar
Truffle
By Application
Direct Consumption
Food Processing Industry (FPI)
Chapter 11. Asia Pacific Luxury Foods Analysis and Outlook
11.1. Asia Pacific Luxury Foods Revenue (USD Million), and Revenue (USD Million) by Segments (2021-2032)
11.1.1. Asia Pacific Luxury Foods Revenue (USD Million) by Type (2021-2032)
11.1.2. Asia Pacific Luxury Foods Revenue (USD Million) by Application (2021-2032)
11.1.3. Asia Pacific Luxury Foods Revenue (USD Million) by Product (2021-2032)
By Type
Foie Gras
Caviar
Truffle
By Application
Direct Consumption
Food Processing Industry (FPI)
Chapter 12. South America Luxury Foods Analysis and Outlook
12.1. South America Luxury Foods Revenue (USD Million), by Segments (2021-2032)
12.1.1. South America Luxury Foods Revenue (USD Million) by Type (2021-2032)
12.1.2. South America Luxury Foods Revenue (USD Million) by Application (2021-2032)
12.1.3. South America Luxury Foods Revenue (USD Million) by Product (2021-2032)
By Type
Foie Gras
Caviar
Truffle
By Application
Direct Consumption
Food Processing Industry (FPI)
Chapter 13. Middle East and Africa Luxury Foods Analysis and Outlook
13.1. Middle East and Africa Luxury Foods Revenue (USD Million), by Segments (2021-2032)
13.1.1. Middle East and Africa Luxury Foods Revenue (USD Million) by Type (2021-2032)
13.1.2. Middle East and Africa Luxury Foods Revenue (USD Million) by Application (2021-2032)
13.1.3. Middle East and Africa Luxury Foods Revenue (USD Million) by Product (2021-2032)
By Type
Foie Gras
Caviar
Truffle
By Application
Direct Consumption
Food Processing Industry (FPI)
Chapter 14. Luxury Foods Company Profiles
14.1 Business Overview
14.2 Product Profiles
14.3 SWOT Profiles
14.5 Recent Developments
14.6 Financial Profile
List of Companies
Agroittica Lombarda S.p.A.
Amur Group Ltd.
Aviar Galilee Farm Ltd.
Beluga Inc. (VIDIN)
Black River Sturgeon LLC
California Caviar Company LLC
Caviar Court LLC
Caviar Creator LLC
Caviar de France SARL
Caviar de Riofrío S.L.
Hangzhou Qiandaohu Xunlong Sci-tech Co., Ltd.
Hubei Tianxia Fisheries Co., Ltd.
Osage Catfisheries Inc.
Runzhao Fisheries Co., Ltd.
Russian Caviar House LLC
Sterling Caviar LLC
Sturgeon Aquafarms LLC
15. Methodology and Data Sources
15.1 Customization Offerings
15.2 Subscription Services
15.3 Related Reports
15.4 Publisher Expertise
LIST OF TABLES
Table 1 Market Segmentation Analysis
Table 2 Global Luxury Foods Market Share of Leading Companies, 2023
Table 3 Product Offerings of Leading Companies
Table 4 Low Growth Scenario Forecasts
Table 5 Reference Case Growth Scenario
Table 6 High Growth Case Scenario
Table 7 Global Luxury Foods Revenue (USD Million) And CAGR (%) By Type (2021-2032)
Table 8 Global Luxury Foods Revenue (USD Million) And CAGR (%) By Application (2021-2032)
Table 9 Global Luxury Foods Revenue (USD Million) And CAGR (%) By Product (2021-2032)
Table 10 Global Luxury Foods Market Revenue (USD Million) By Regions (2021-2032)
Table 11 Global Luxury Foods Market Share (%) By Regions (2021-2032)
Table 12 North America Luxury Foods Revenue (USD Million) By Country (2021-2032)
Table 13 Europe Luxury Foods Revenue (USD Million) By Country (2021-2032)
Table 14 Asia Pacific Luxury Foods Revenue (USD Million) By Country (2021-2032)
Table 15 South America Luxury Foods Revenue (USD Million) By Country (2021-2032)
Table 16 Middle East and Africa Luxury Foods Revenue (USD Million) By Region (2021-2032)
Table 17 North America Luxury Foods Revenue (USD Million) By Type (2021-2032)
Table 18 North America Luxury Foods Revenue (USD Million) By Application (2021-2032)
Table 19 North America Luxury Foods Revenue (USD Million) By Product (2021-2032)
Table 20 Europe Luxury Foods Revenue (USD Million) By Type (2021-2032)
Table 21 Europe Luxury Foods Revenue (USD Million) By Application (2021-2032)
Table 22 Europe Luxury Foods Revenue (USD Million) By Product (2021-2032)
Table 23 Asia Pacific Luxury Foods Revenue (USD Million) By Type (2021-2032)
Table 24 Asia Pacific Luxury Foods Revenue (USD Million) By Application (2021-2032)
Table 25 Asia Pacific Luxury Foods Revenue (USD Million) By Product (2021-2032)
Table 26 South America Luxury Foods Revenue (USD Million) By Type (2021-2032)
Table 27 South America Luxury Foods Revenue (USD Million) By Application (2021-2032)
Table 28 South America Luxury Foods Revenue (USD Million) By Product (2021-2032)
Table 29 Middle East and Africa Luxury Foods Revenue (USD Million) By Type (2021-2032)
Table 30 Middle East and Africa Luxury Foods Revenue (USD Million) By Application (2021-2032)
Table 31 Middle East and Africa Luxury Foods Revenue (USD Million) By Product (2021-2032)
LIST OF FIGURES
Figure 1. Market Scope
Figure 2. Pricing Forecasts Per Unit, 2023- 2032
Figure 3. Porter’s Five Forces
Figure 4. Global Luxury Foods Market Revenue (USD Million) By Regions (2021-2032)
Figure 5. Global Luxury Foods Market Share (%) By Regions (2023)
Figure 6. North America Luxury Foods Revenue (USD Million) By Country (2021-2032)
Figure 7. United States Luxury Foods Revenue (USD Million) By Country (2021-2032)
Figure 8. Canada Luxury Foods Revenue (USD Million) By Country (2021-2032)
Figure 9. Mexico Luxury Foods Revenue (USD Million) By Country (2021-2032)
Figure 10. Europe Luxury Foods Revenue (USD Million) By Country (2021-2032)
Figure 11. Germany Luxury Foods Revenue (USD Million) By Country (2021-2032)
Figure 12. France Luxury Foods Revenue (USD Million) By Country (2021-2032)
Figure 13. United Kingdom Luxury Foods Revenue (USD Million) By Country (2021-2032)
Figure 14. Spain Luxury Foods Revenue (USD Million) By Country (2021-2032)
Figure 15. Italy Luxury Foods Revenue (USD Million) By Country (2021-2032)
Figure 16. Russia Luxury Foods Revenue (USD Million) By Country (2021-2032)
Figure 17. Rest of Europe Luxury Foods Revenue (USD Million) By Country (2021-2032)
Figure 11. Asia Pacific Luxury Foods Revenue (USD Million) By Country (2021-2032)
Figure 12. China Luxury Foods Revenue (USD Million) By Country (2021-2032)
Figure 13. Japan Luxury Foods Revenue (USD Million) By Country (2021-2032)
Figure 14. India Luxury Foods Revenue (USD Million) By Country (2021-2032)
Figure 15. South Korea Luxury Foods Revenue (USD Million) By Country (2021-2032)
Figure 16. Australia Luxury Foods Revenue (USD Million) By Country (2021-2032)
Figure 17. South East Asia Luxury Foods Revenue (USD Million) By Country (2021-2032)
Figure 18. South America Luxury Foods Revenue (USD Million) By Country (2021-2032)
Figure 19. Brazil Luxury Foods Revenue (USD Million) By Country (2021-2032)
Figure 20. Argentina Luxury Foods Revenue (USD Million) By Country (2021-2032)
Figure 21. Rest of Asia Pacific Luxury Foods Revenue (USD Million) By Country (2021-2032)
Figure 22. Middle East and Africa Luxury Foods Revenue (USD Million) By Region (2021-2032)
Figure 23. Saudi Arabia Luxury Foods Revenue (USD Million) By Region (2021-2032)
Figure 24. The UAE Luxury Foods Revenue (USD Million) By Region (2021-2032)
Figure 25. Rest of Middle East Luxury Foods Revenue (USD Million) By Region (2021-2032)
Figure 26. South Africa Luxury Foods Revenue (USD Million) By Region (2021-2032)
Figure 27. Africa Luxury Foods Revenue (USD Million) By Region (2021-2032)
Figure 28. North America Luxury Foods Revenue (USD Million) By Type (2021-2032)
Figure 29. North America Luxury Foods Revenue (USD Million) By Application (2021-2032)
Figure 30. North America Luxury Foods Revenue (USD Million) By Product (2021-2032)
Figure 31. Europe Luxury Foods Revenue (USD Million) By Type (2021-2032)
Figure 32. Europe Luxury Foods Revenue (USD Million) By Application (2021-2032)
Figure 33. Europe Luxury Foods Revenue (USD Million) By Product (2021-2032)
Figure 34. Asia Pacific Luxury Foods Revenue (USD Million) By Type (2021-2032)
Figure 35. Asia Pacific Luxury Foods Revenue (USD Million) By Application (2021-2032)
Figure 36. Asia Pacific Luxury Foods Revenue (USD Million) By Product (2021-2032)
Figure 37. South America Luxury Foods Revenue (USD Million) By Type (2021-2032)
Figure 38. South America Luxury Foods Revenue (USD Million) By Application (2021-2032)
Figure 39. South America Luxury Foods Revenue (USD Million) By Product (2021-2032)
Figure 40. Middle East and Africa Luxury Foods Revenue (USD Million) By Type (2021-2032)
Figure 41. Middle East and Africa Luxury Foods Revenue (USD Million) By Application (2021-2032)
Figure 42. Middle East and Africa Luxury Foods Revenue (USD Million) By Product (2021-2032)
By Type
Foie Gras
Caviar
Truffle
By Application
Direct Consumption
Food Processing Industry (FPI)
Countries Analyzed
North America (US, Canada, Mexico)
Europe (Germany, UK, France, Spain, Italy, Russia, Rest of Europe)
Asia Pacific (China, India, Japan, South Korea, Australia, South East Asia, Rest of Asia)
South America (Brazil, Argentina, Rest of South America)
Middle East and Africa (Saudi Arabia, UAE, Rest of Middle East, South Africa, Egypt, Rest of Africa)
