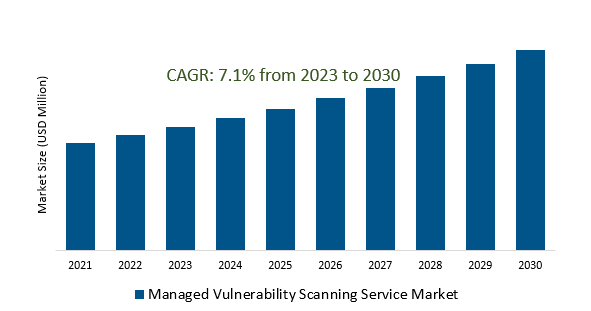
The Managed Vulnerability Scanning Service Market Size is estimated to register 7.1% growth over the forecast period from 2023 to 2030.
Managed Vulnerability Scanning Service Market Overview
The continuously evolving and sophisticated cyber threat landscape are heightening the demand for managed vulnerability scanning services. Organizations, seeking proactive measures to identify and mitigate vulnerabilities in their systems before cyber threats exploit them are driving the market growth. Compliance requirements, such as GDPR, HIPAA, and PCI DSS, among others are fueling the demand. Managed services that offer continuous vulnerability scanning and monitoring, helping organizations to stay updated in real-time and respond promptly to emerging threats are increasing the market. The acceleration of remote work trends and digital transformation initiatives are expanded the attack surface for cyber threats, leading to the market growth. Managed services offering scalable and automated scanning tools to efficiently identify, assess, and remediate vulnerabilities across large and complex environments are driving the market.
Managed Vulnerability Scanning Service Market Dynamics
Market Trends- Cloud Adoption Dynamics in the Managed Vulnerability Scanning Service Market.
The escalating reliance on cloud infrastructure across enterprises is propelling the demand for tailored vulnerability scanning services capable of effectively securing and monitoring these intricate cloud environments.
Integrating automation and artificial intelligence capabilities into cloud-based vulnerability scanning services optimizes scanning processes, expediting vulnerability detection, analysis, and resolution.
Further, the evolution of cloud technology, focusing on improved agility, cost-effectiveness, and advanced features, acting as a catalyst for businesses is contributing to the market growth.
Market Driver- Demand for Enhancing Business Security Posture through Managed Vulnerability Scanning Services.
Organizations, confronted with evolving cyber risks are seeking robust vulnerability scanning services to fortify their security postures.
This pursuit is further fueled by stringent regulatory mandates and compliance standards, compelling businesses to invest in comprehensive vulnerability scanning solutions to meet compliance requirements and avoid potential penalties.
The amalgamation of evolving cyber threats, regulatory pressures, IT complexity, digital transformation dynamics, and the integration of advanced technologies collectively drives the market demand.
Market Opportunity - Addressing the Escalating Complexity of IT Environments in Managed Vulnerability Scanning Services.
The pervasive trend towards hybrid and multi-cloud infrastructures contributes to the intricate IT landscapes, requiring advanced scanning services capable of adapting to these diverse environments.
Additionally, the proliferation of IoT devices, edge computing, and interconnected networks amplifies the complexity, driving the need for comprehensive vulnerability scanning solutions tailored to these varied and dynamic elements.
Technologies optimizing vulnerability detection, accelerating threat response, and aiding in proactive identification and resolution of vulnerabilities are driving the market growth.
Market Share Analysis - Commercial Valuation will register the fastest growth.
The Managed Vulnerability Scanning Service Market is analyzed across Commercial Valuation, Real Estate Valuation, Patent Valuation & Others. Commercial Valuation is poised to register the fastest growth. MVSS providers assist investors in making informed decisions by conducting investment analyses for commercial properties. They assess the potential risks and returns associated with different investment opportunities, providing valuable insights for strategic decision-making. They provide lenders with accurate valuations, enabling them to make informed lending decisions and mitigate potential risks. Utilizing advanced valuation methodologies and market research, MVSS providers conduct thorough property appraisals to determine the fair market value of commercial assets. This involves analyzing factors such as location, property condition, comparable sales, and current market trends. Further, they advise clients on tax implications and assist in navigating complex legal processes
Market Share Analysis- Enterprise held a significant market share in 2023
The Managed Vulnerability Scanning Service Market is analyzed across various applications including Individual, Group & Enterprise. Of these, Enterprise held a significant market share in 2023.
Managed Vulnerability Scanning Service Market Segmentation
By Type
- Commercial Valuation
- Real Estate Valuation
- Patent Valuation
- Others
By Application
- Individual
- Group
- Enterprise
By Region
- North America (United States, Canada, Mexico)
- Europe (Germany, France, United Kingdom, Spain, Italy, Others)
- Asia Pacific (China, India, Japan, South Korea, Australia, Others)
- Latin America (Brazil, Argentina, Others)
- Middle East and Africa (Saudi Arabia, UAE, Kuwait, Other Middle East, South Africa, Nigeria, Other Africa)
Managed Vulnerability Scanning Service Market Companies
- Bytes Software Services
- Cyphere
- DigitalXRAID
- Acumera
- Adarma
- Trapp Technology
- Fujitsu
- IBM
- Ivanti
- Kudelski Security
- NCC Group
- Nettitude
- eSentire
- Oracle
- Pratum
- Redscan
- Root Group
- NTT Global Networks
*List not exhaustive
Managed Vulnerability Scanning Service Market Outlook 2023
1 Market Overview
1.1 Introduction to the Managed Vulnerability Scanning Service Market
1.2 Scope of the Study
1.3 Research Objective
1.3.1 Key Market Scope and Segments
1.3.2 Players Covered
1.3.3 Years Considered
2 Executive Summary
2.1 2023 Managed Vulnerability Scanning Service Industry- Market Statistics
3 Market Dynamics
3.1 Market Drivers
3.2 Market Challenges
3.3 Market Opportunities
3.4 Market Trends
4 Market Factor Analysis
4.1 Porter’s Five Forces
4.2 Market Entropy
4.2.1 Global Managed Vulnerability Scanning Service Market Companies with Area Served
4.2.2 Products Offerings Global Managed Vulnerability Scanning Service Market
5 COVID-19 Impact Analysis and Outlook Scenarios
5.1.1 Covid-19 Impact Analysis
5.1.2 post-COVID-19 Scenario- Low Growth Case
5.1.3 post-COVID-19 Scenario- Reference Growth Case
5.1.4 post-COVID-19 Scenario- Low Growth Case
6 Global Managed Vulnerability Scanning Service Market Trends
6.1 Global Managed Vulnerability Scanning Service Revenue (USD Million) and CAGR (%) by Type (2018-2030)
6.2 Global Managed Vulnerability Scanning Service Revenue (USD Million) and CAGR (%) by Applications (2018-2030)
6.3 Global Managed Vulnerability Scanning Service Revenue (USD Million) and CAGR (%) by regions (2018-2030)
7 Global Managed Vulnerability Scanning Service Market Revenue (USD Million) by Type, and Applications (2018-2022)
7.1 Global Managed Vulnerability Scanning Service Revenue (USD Million) by Type (2018-2022)
7.1.1 Global Managed Vulnerability Scanning Service Revenue (USD Million), Market Share (%) by Type (2018-2022)
7.2 Global Managed Vulnerability Scanning Service Revenue (USD Million) by Applications (2018-2022)
7.2.1 Global Managed Vulnerability Scanning Service Revenue (USD Million), Market Share (%) by Applications (2018-2022)
8 Global Managed Vulnerability Scanning Service Development Regional Status and Outlook
8.1 Global Managed Vulnerability Scanning Service Revenue (USD Million) By Regions (2018-2022)
8.2 North America Managed Vulnerability Scanning Service Revenue (USD Million) by Type, and Application (2018-2022)
8.2.1 North America Managed Vulnerability Scanning Service Revenue (USD Million) by Country (2018-2022)
8.2.2 North America Managed Vulnerability Scanning Service Revenue (USD Million) by Type (2018-2022)
8.2.3 North America Managed Vulnerability Scanning Service Revenue (USD Million) by Applications (2018-2022)
8.3 Europe Managed Vulnerability Scanning Service Revenue (USD Million), by Type, and Applications (USD Million) (2018-2022)
8.3.1 Europe Managed Vulnerability Scanning Service Revenue (USD Million), by Country (2018-2022)
8.3.2 Europe Managed Vulnerability Scanning Service Revenue (USD Million) by Type (2018-2022)
8.3.3 Europe Managed Vulnerability Scanning Service Revenue (USD Million) by Applications (2018-2022)
8.4 Asia Pacific Managed Vulnerability Scanning Service Revenue (USD Million), and Revenue (USD Million) by Type, and Applications (2018-2022)
8.4.1 Asia Pacific Managed Vulnerability Scanning Service Revenue (USD Million) by Country (2018-2022)
8.4.2 Asia Pacific Managed Vulnerability Scanning Service Revenue (USD Million) by Type (2018-2022)
8.4.3 Asia Pacific Managed Vulnerability Scanning Service Revenue (USD Million) by Applications (2018-2022)
8.5 South America Managed Vulnerability Scanning Service Revenue (USD Million), by Type, and Applications (2018-2022)
8.5.1 South America Managed Vulnerability Scanning Service Revenue (USD Million), by Country (2018-2022)
8.5.2 South America Managed Vulnerability Scanning Service Revenue (USD Million) by Type (2018-2022)
8.5.3 South America Managed Vulnerability Scanning Service Revenue (USD Million) by Applications (2018-2022)
8.6 Middle East and Africa Managed Vulnerability Scanning Service Revenue (USD Million), by Type, Technology, Application, Thickness (2018-2022)
8.6.1 Middle East and Africa Managed Vulnerability Scanning Service Revenue (USD Million) by Country (2018-2022)
8.6.2 Middle East and Africa Managed Vulnerability Scanning Service Revenue (USD Million) by Type (2018-2022)
8.6.3 Middle East and Africa Managed Vulnerability Scanning Service Revenue (USD Million) by Applications (2018-2022)
9 Company Profiles
10 Global Managed Vulnerability Scanning Service Market Revenue (USD Million), by Type, and Applications (2023-2030)
10.1 Global Managed Vulnerability Scanning Service Revenue (USD Million) and Market Share (%) by Type (2023-2030)
10.1.1 Global Managed Vulnerability Scanning Service Revenue (USD Million), and Market Share (%) by Type (2023-2030)
10.2 Global Managed Vulnerability Scanning Service Revenue (USD Million) and Market Share (%) by Applications (2023-2030)
10.2.1 Global Managed Vulnerability Scanning Service Revenue (USD Million), and Market Share (%) by Applications (2023-2030)
11 Global Managed Vulnerability Scanning Service Development Regional Status and Outlook Forecast
11.1 Global Managed Vulnerability Scanning Service Revenue (USD Million) By Regions (2023-2030)
11.2 North America Managed Vulnerability Scanning Service Revenue (USD Million) by Type, and Applications (2023-2030)
11.2.1 North America Managed Vulnerability Scanning Service Revenue (USD) Million by Country (2023-2030)
11.2.2 North America Managed Vulnerability Scanning Service Revenue (USD Million), by Type (2023-2030)
11.2.3 North America Managed Vulnerability Scanning Service Revenue (USD Million), Market Share (%) by Applications (2023-2030)
11.3 Europe Managed Vulnerability Scanning Service Revenue (USD Million), by Type, and Applications (2023-2030)
11.3.1 Europe Managed Vulnerability Scanning Service Revenue (USD Million), by Country (2023-2030)
11.3.2 Europe Managed Vulnerability Scanning Service Revenue (USD Million), by Type (2023-2030)
11.3.3 Europe Managed Vulnerability Scanning Service Revenue (USD Million), by Applications (2023-2030)
11.4 Asia Pacific Managed Vulnerability Scanning Service Revenue (USD Million) by Type, and Applications (2023-2030)
11.4.1 Asia Pacific Managed Vulnerability Scanning Service Revenue (USD Million), by Country (2023-2030)
11.4.2 Asia Pacific Managed Vulnerability Scanning Service Revenue (USD Million), by Type (2023-2030)
11.4.3 Asia Pacific Managed Vulnerability Scanning Service Revenue (USD Million), by Applications (2023-2030)
11.5 South America Managed Vulnerability Scanning Service Revenue (USD Million), by Type, and Applications (2023-2030)
11.5.1 South America Managed Vulnerability Scanning Service Revenue (USD Million), by Country (2023-2030)
11.5.2 South America Managed Vulnerability Scanning Service Revenue (USD Million), by Type (2023-2030)
11.5.3 South America Managed Vulnerability Scanning Service Revenue (USD Million), by Applications (2023-2030)
11.6 Middle East and Africa Managed Vulnerability Scanning Service Revenue (USD Million), by Type, and Applications (2023-2030)
11.6.1 Middle East and Africa Managed Vulnerability Scanning Service Revenue (USD Million), by region (2023-2030)
11.6.2 Middle East and Africa Managed Vulnerability Scanning Service Revenue (USD Million), by Type (2023-2030)
11.6.3 Middle East and Africa Managed Vulnerability Scanning Service Revenue (USD Million), by Applications (2023-2030)
12 Methodology and Data Sources
12.1 Methodology/Research Approach
12.1.1 Research Programs/Design
12.1.2 Market Size Estimation
12.1.3 Market Breakdown and Data Triangulation
12.2 Data Sources
12.2.1 Secondary Sources
12.2.2 Primary Sources
12.3 Disclaimer
List of Tables
Table 1 Market Segmentation Analysis
Table 2 Global Managed Vulnerability Scanning Service Market Companies with Areas Served
Table 3 Products Offerings Global Managed Vulnerability Scanning Service Market
Table 4 Low Growth Scenario Forecasts
Table 5 Reference Case Growth Scenario
Table 6 High Growth Case Scenario
Table 7 Global Managed Vulnerability Scanning Service Revenue (USD Million) And CAGR (%) By Type (2018-2030)
Table 8 Global Managed Vulnerability Scanning Service Revenue (USD Million) And CAGR (%) By Applications (2018-2030)
Table 9 Global Managed Vulnerability Scanning Service Revenue (USD Million) And CAGR (%) By Regions (2018-2030)
Table 10 Global Managed Vulnerability Scanning Service Revenue (USD Million) By Type (2018-2022)
Table 11 Global Managed Vulnerability Scanning Service Revenue Market Share (%) By Type (2018-2022)
Table 12 Global Managed Vulnerability Scanning Service Revenue (USD Million) By Applications (2018-2022)
Table 13 Global Managed Vulnerability Scanning Service Revenue Market Share (%) By Applications (2018-2022)
Table 14 Global Managed Vulnerability Scanning Service Market Revenue (USD Million) By Regions (2018-2022)
Table 15 Global Managed Vulnerability Scanning Service Market Share (%) By Regions (2018-2022)
Table 16 North America Managed Vulnerability Scanning Service Revenue (USD Million) By Country (2018-2022)
Table 17 North America Managed Vulnerability Scanning Service Revenue (USD Million) By Type (2018-2022)
Table 18 North America Managed Vulnerability Scanning Service Revenue (USD Million) By Applications (2018-2022)
Table 19 Europe Managed Vulnerability Scanning Service Revenue (USD Million) By Country (2018-2022)
Table 20 Europe Managed Vulnerability Scanning Service Revenue (USD Million) By Type (2018-2022)
Table 21 Europe Managed Vulnerability Scanning Service Revenue (USD Million) By Applications (2018-2022)
Table 22 Asia Pacific Managed Vulnerability Scanning Service Revenue (USD Million) By Country (2018-2022)
Table 23 Asia Pacific Managed Vulnerability Scanning Service Revenue (USD Million) By Type (2018-2022)
Table 24 Asia Pacific Managed Vulnerability Scanning Service Revenue (USD Million) By Applications (2018-2022)
Table 25 South America Managed Vulnerability Scanning Service Revenue (USD Million) By Country (2018-2022)
Table 26 South America Managed Vulnerability Scanning Service Revenue (USD Million) By Type (2018-2022)
Table 27 South America Managed Vulnerability Scanning Service Revenue (USD Million) By Applications (2018-2022)
Table 28 Middle East and Africa Managed Vulnerability Scanning Service Revenue (USD Million) By Region (2018-2022)
Table 29 Middle East and Africa Managed Vulnerability Scanning Service Revenue (USD Million) By Type (2018-2022)
Table 30 Middle East and Africa Managed Vulnerability Scanning Service Revenue (USD Million) By Applications (2018-2022)
Table 31 Financial Analysis
Table 32 Global Managed Vulnerability Scanning Service Revenue (USD Million) By Type (2023-2030)
Table 33 Global Managed Vulnerability Scanning Service Revenue Market Share (%) By Type (2023-2030)
Table 34 Global Managed Vulnerability Scanning Service Revenue (USD Million) By Applications (2023-2030)
Table 35 Global Managed Vulnerability Scanning Service Revenue Market Share (%) By Applications (2023-2030)
Table 36 Global Managed Vulnerability Scanning Service Market Revenue (USD Million), And Revenue (USD Million) By Regions (2023-2030)
Table 37 North America Managed Vulnerability Scanning Service Revenue (USD)By Country (2023-2030)
Table 38 North America Managed Vulnerability Scanning Service Revenue (USD Million) By Type (2023-2030)
Table 39 North America Managed Vulnerability Scanning Service Revenue (USD Million) By Applications (2023-2030)
Table 40 Europe Managed Vulnerability Scanning Service Revenue (USD Million) By Country (2023-2030)
Table 41 Europe Managed Vulnerability Scanning Service Revenue (USD Million) By Type (2023-2030)
Table 42 Europe Managed Vulnerability Scanning Service Revenue (USD Million) By Applications (2023-2030)
Table 43 Asia Pacific Managed Vulnerability Scanning Service Revenue (USD Million) By Country (2023-2030)
Table 44 Asia Pacific Managed Vulnerability Scanning Service Revenue (USD Million) By Type (2023-2030)
Table 45 Asia Pacific Managed Vulnerability Scanning Service Revenue (USD Million) By Applications (2023-2030)
Table 46 South America Managed Vulnerability Scanning Service Revenue (USD Million) By Country (2023-2030)
Table 47 South America Managed Vulnerability Scanning Service Revenue (USD Million) By Type (2023-2030)
Table 48 South America Managed Vulnerability Scanning Service Revenue (USD Million) By Applications (2023-2030)
Table 49 Middle East and Africa Managed Vulnerability Scanning Service Revenue (USD Million) By Region (2023-2030)
Table 50 Middle East and Africa Managed Vulnerability Scanning Service Revenue (USD Million) By Region (2023-2030)
Table 51 Middle East and Africa Managed Vulnerability Scanning Service Revenue (USD Million) By Type (2023-2030)
Table 52 Middle East and Africa Managed Vulnerability Scanning Service Revenue (USD Million) By Applications (2023-2030)
Table 53 Research Programs/Design for This Report
Table 54 Key Data Information from Secondary Sources
Table 55 Key Data Information from Primary Sources
List of Figures
Figure 1 Market Scope
Figure 2 Porter’s Five Forces
Figure 3 Global Managed Vulnerability Scanning Service Revenue (USD Million) By Type (2018-2022)
Figure 4 Global Managed Vulnerability Scanning Service Revenue Market Share (%) By Type (2022)
Figure 5 Global Managed Vulnerability Scanning Service Revenue (USD Million) By Applications (2018-2022)
Figure 6 Global Managed Vulnerability Scanning Service Revenue Market Share (%) By Applications (2022)
Figure 7 Global Managed Vulnerability Scanning Service Market Revenue (USD Million) By Regions (2018-2022)
Figure 8 Global Managed Vulnerability Scanning Service Market Share (%) By Regions (2022)
Figure 9 North America Managed Vulnerability Scanning Service Revenue (USD Million) By Country (2018-2022)
Figure 10 North America Managed Vulnerability Scanning Service Revenue (USD Million) By Type (2018-2022)
Figure 11 North America Managed Vulnerability Scanning Service Revenue (USD Million) By Applications (2018-2022)
Figure 12 Europe Managed Vulnerability Scanning Service Revenue (USD Million) By Country (2018-2022)
Figure 13 Europe Managed Vulnerability Scanning Service Revenue (USD Million) By Type (2018-2022)
Figure 14 Europe Managed Vulnerability Scanning Service Revenue (USD Million) By Applications (2018-2022)
Figure 15 Asia Pacific Managed Vulnerability Scanning Service Revenue (USD Million) By Country (2018-2022)
Figure 16 Asia Pacific Managed Vulnerability Scanning Service Revenue (USD Million) By Type (2018-2022)
Figure 17 Asia Pacific Managed Vulnerability Scanning Service Revenue (USD Million) By Applications (2018-2022)
Figure 18 South America Managed Vulnerability Scanning Service Revenue (USD Million) By Country (2018-2022)
Figure 19 South America Managed Vulnerability Scanning Service Revenue (USD Million) By Type (2018-2022)
Figure 20 South America Managed Vulnerability Scanning Service Revenue (USD Million) By Applications (2018-2022)
Figure 21 Middle East and Africa Managed Vulnerability Scanning Service Revenue (USD Million) By Region (2018-2022)
Figure 22 Middle East and Africa Managed Vulnerability Scanning Service Revenue (USD Million) By Type (2018-2022)
Figure 23 Middle East and Africa Managed Vulnerability Scanning Service Revenue (USD Million) By Applications (2018-2022)
Figure 24 Global Managed Vulnerability Scanning Service Revenue (USD Million) By Type (2023-2030)
Figure 25 Global Managed Vulnerability Scanning Service Revenue Market Share (%) By Type (2030)
Figure 26 Global Managed Vulnerability Scanning Service Revenue (USD Million) By Applications (2023-2030)
Figure 27 Global Managed Vulnerability Scanning Service Revenue Market Share (%) By Applications (2030)
Figure 28 Global Managed Vulnerability Scanning Service Market Revenue (USD Million) By Regions (2023-2030)
Figure 29 North America Managed Vulnerability Scanning Service Revenue (USD Million) By Country (2023-2030)
Figure 30 North America Managed Vulnerability Scanning Service Revenue (USD Million) By Type (2023-2030)
Figure 31 North America Managed Vulnerability Scanning Service Revenue (USD Million) By Applications (2023-2030)
Figure 32 Europe Managed Vulnerability Scanning Service Revenue (USD Million) By Country (2023-2030)
Figure 33 Europe Managed Vulnerability Scanning Service Revenue (USD Million) By Type (2023-2030)
Figure 34 Europe Managed Vulnerability Scanning Service Revenue (USD Million) By Applications (2023-2030)
Figure 35 Asia Pacific Managed Vulnerability Scanning Service Revenue (USD Million) By Country (2023-2030)
Figure 36 Asia Pacific Managed Vulnerability Scanning Service Revenue (USD Million) By Type (2023-2030)
Figure 37 Asia Pacific Managed Vulnerability Scanning Service Revenue (USD Million) By Applications (2023-2030)
Figure 38 South America Managed Vulnerability Scanning Service Revenue (USD Million) By Country (2023-2030)
Figure 39 South America Managed Vulnerability Scanning Service Revenue (USD Million) By Type (2023-2030)
Figure 40 South America Managed Vulnerability Scanning Service Revenue (USD Million) By Applications (2023-2030)
Figure 41 Middle East and Africa Managed Vulnerability Scanning Service Revenue (USD Million) By Region (2023-2030)
Figure 42 Middle East and Africa Managed Vulnerability Scanning Service Revenue (USD Million) By Region (2023-2030)
Figure 43 Middle East and Africa Managed Vulnerability Scanning Service Revenue (USD Million) By Type (2023-2030)
Figure 44 Middle East and Africa Managed Vulnerability Scanning Service Revenue (USD Million) By Applications (2023-2030)
Figure 45 Bottom-Up and Top-Down Approaches for This Report
Figure 46 Data Triangulation
