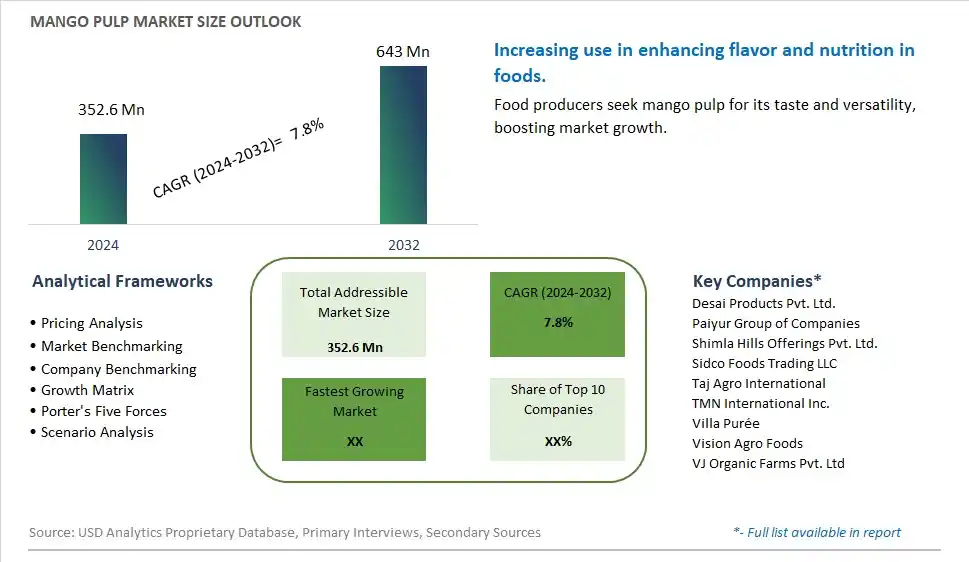
Global Mango Pulp Market Size is valued at $352.6 Million in 2024 and is forecast to register a growth rate (CAGR) of 7.8% to reach $643 Million by 2032.
The global Mango Pulp Market Comprehensive Study analyzes and forecasts the market size across 6 regions and 24 countries for diverse segments -By Type (Organic, Conventional), By Application (Beverages, Dairy & Frozen Products, Baby Foods, Bakery, Confectionery, Others), By Packaging (Cans, PET Jars and Bottles, Pouches)
An Introduction to Mango Pulp Market
In 2024, the mango pulp market is expanding rapidly, driven by the demand for high-quality, natural fruit ingredients in the food and beverage industry. Mango pulp, known for its rich flavor and nutritional content, is widely used in juices, desserts, and culinary applications. The market benefits from innovations in processing and packaging techniques that preserve the freshness and flavor of mango pulp. The trend towards clean label and natural ingredients is influencing market dynamics. Increasing consumer interest in exotic fruit flavors and the popularity of tropical fruit-based products are further propelling demand for mango pulp.
Mango Pulp Competitive Landscape
The market report analyses the leading companies in the industry including Desai Products Pvt. Ltd., Paiyur Group of Companies, Shimla Hills Offerings Pvt. Ltd., Sidco Foods Trading LLC, Taj Agro International, TMN International Inc., Villa Purée, Vision Agro Foods, VJ Organic Farms Pvt. Ltd, and Others.
Mango Pulp Market Dynamics
Mango Pulp Market Trend: Increasing Use of Mango Pulp in Food and Beverage Products
The most prominent trend in the Mango Pulp Market is the increasing use of mango pulp in food and beverage products. Mango pulp, known for its rich flavor and nutritional benefits, is becoming a popular ingredient in a variety of products, including juices, smoothies, and desserts. This trend is driven by the demand for natural and flavorful ingredients that enhance the taste and quality of food and beverages.
Mango Pulp Market Driver: Growth of the Food and Beverage Industry
A key driver in the Mango Pulp Market is the growth of the food and beverage industry. As the demand for processed and convenience foods continues to rise, there is an increasing need for high-quality fruit pulp that enhances the flavor and nutritional profile of products. Mango pulp, which provides a versatile and nutritious ingredient, caters to this demand and supports market growth.
Mango Pulp Market Opportunity: Expansion into Health and Wellness Products
One significant opportunity in the Mango Pulp Market lies in the expansion into health and wellness products. Companies can innovate by incorporating mango pulp into dietary supplements, health beverages, and functional foods that highlight its benefits. By offering diverse and health-focused products, manufacturers can attract a broader consumer base and drive market growth .
Mango Pulp Market Share Analysis: Conventional segment generated the highest revenue share in the industry
In the Mango Pulp market, the largest segment is "Conventional." Conventional mango pulp refers to the standard processing method used for mangoes without organic certification. This segment dominates the market due to its wider availability, lower production costs, and established supply chains compared to organic mango pulp. Conventional mango pulp is extensively used by food and beverage manufacturers for its consistent quality, versatility in applications, and competitive pricing, catering to a broad range of consumer preferences globally. The market for conventional mango pulp benefits from its accessibility to large-scale production facilities and distribution networks, ensuring a steady supply to meet the growing demand across various industries.
Mango Pulp Market Share Analysis: Beverages is the fastest growing segment over the forecast period to 2032
The fastest-growing segment in the Mango Pulp market through 2032 is "Beverages." Mango pulp is increasingly utilized in the beverage industry for its natural sweetness, tropical flavor profile, and nutritional benefits. Mango-based beverages, including juices, smoothies, nectars, and mango-flavored drinks, are gaining popularity among consumers seeking refreshing and healthful alternatives to carbonated and sugary beverages. The versatility of mango pulp in beverage formulations allows manufacturers to create premium products that appeal to diverse consumer preferences and dietary trends. As the demand for natural and fruit-based beverages continues to rise globally, driven by shifting consumer lifestyles and preferences towards healthier options, the beverage application of mango pulp is poised for significant growth, supported by continuous product innovation and market expansion strategies.
Mango Pulp Market Share Analysis: Cans segment generated the highest revenue share in the industry
Among the packaging options for Mango Pulp, the largest segment is "Cans." Canned mango pulp offers convenience, long shelf life, and preservation of flavor and nutritional properties. Cans are widely preferred in the mango pulp market due to their ability to protect the contents from light, air, and moisture, thereby ensuring product freshness and quality over an extended period. Canned mango pulp is popular among consumers and foodservice operators for its ease of storage, transportation efficiency, and suitability for both retail and institutional use. The dominance of cans in the mango pulp packaging segment reflects their established market presence, robust distribution networks, and consumer preference for packaged foods that offer convenience and product integrity.
Mango Pulp Market Segmentation
By Type
Organic
Conventional
By Application
Beverages
Dairy & Frozen Products
Baby Foods
Bakery
Confectionery
Others
By Packaging
Cans
PET Jars and Bottles
Pouches
Countries Analyzed
North America (US, Canada, Mexico)
Europe (Germany, UK, France, Spain, Italy, Russia, Rest of Europe)
Asia Pacific (China, India, Japan, South Korea, Australia, South East Asia, Rest of Asia)
South America (Brazil, Argentina, Rest of South America)
Middle East and Africa (Saudi Arabia, UAE, Rest of Middle East, South Africa, Egypt, Rest of Africa)
Mango Pulp Companies Profiled in the Study
Desai Products Pvt. Ltd.
Paiyur Group of Companies
Shimla Hills Offerings Pvt. Ltd.
Sidco Foods Trading LLC
Taj Agro International
TMN International Inc.
Villa Purée
Vision Agro Foods
VJ Organic Farms Pvt. Ltd
*- List Not Exhaustive
Chapter 1. TABLE OF CONTENTS
Chapter 2. Introduction to Mango Pulp Market
2.1. Market Overview
2.2. Key Statistics and Report Highlights
2.3. Scope of the Comprehensive Study
2.3.1. Market Definition
2.3.2 Countries and Regions Covered
2.3.3 Research Objective
2.3.4 Units, Currency, and Conversions
2.3.5 Industry Value Chain
2.4. Key Market Segments
2.5. Key Companies
2.6. Study Period
Chapter 3. Strategic Analysis Review
3.1. Mango Pulp Pricing Analysis and Forecast
3.2. Porter’s Five Forces
3.3. Market Ecosystem
3.4. SWOT Analysis
3.5. Regulatory Scenario
3.3. Effects of Inflation, Russia-Ukraine War, moderating economic growth, and other macroeconomic factors
Chapter 4. Competitive Landscape
4.1. Market Share Analysis
4.1.1. Global Mango Pulp Market Share by Company, 2023
4.1.2. Product Offerings of Leading Mango Pulp Companies
4.2. Market Entropy
4.2.1. New Product Launches in the Industry
4.2.2. Mergers, Acquisitions, Joint ventures, and Partnerships
4.3. Key Strategies and Best Practices
Chapter 5. Global Market Projections: Best, Reference, and Low Case Scenarios
5.1. Growth Analysis- Case Scenario Definitions
5.2. Low Growth Case Scenario Forecasts
5.3. Reference Growth Case Scenario Forecasts
5.4. High Growth Case Scenario Forecasts
Chapter 6. Market Dynamics
6.1. Mango Pulp Market Drivers
6.2. Mango Pulp Market Challenges
6.6. Mango Pulp Market Opportunities
6.4. Mango Pulp Market Trends
Chapter 7. Global Mango Pulp Market Outlook Trends
7.1. Global Mango Pulp Revenue (USD Million) and CAGR (%) by Type (2021-2032)
7.2. Global Mango Pulp Revenue (USD Million) and CAGR (%) by Application (2021-2032)
7.3. Global Mango Pulp Revenue (USD Million) and CAGR (%) by Product (2021-2032)
By Type
Organic
Conventional
By Application
Beverages
Dairy & Frozen Products
Baby Foods
Bakery
Confectionery
Others
By Packaging
Cans
PET Jars and Bottles
Pouches
Chapter 8. Global Mango Pulp Regional Analysis and Outlook
8.1. Global Mango Pulp Revenue (USD Million) By Regions (2021- 2032)
8.2. North America Mango Pulp Revenue (USD Million) by Country (2021-2032)
8.2.1. United States Mango Pulp Regional Analysis and Outlook
8.2.2. Canada Mango Pulp Regional Analysis and Outlook
8.2.3. Mexico Mango Pulp Regional Analysis and Outlook
8.3. Europe Mango Pulp Revenue (USD Million), by Country (2021-2032)
8.3.1. Germany Mango Pulp Regional Analysis and Outlook
8.3.2. France Mango Pulp Regional Analysis and Outlook
8.3.3. United Kingdom Mango Pulp Regional Analysis and Outlook
8.3.4. Spain Mango Pulp Regional Analysis and Outlook
8.3.5. Italy Mango Pulp Regional Analysis and Outlook
8.3.6. Russia Mango Pulp Regional Analysis and Outlook
8.3.7. Rest of Europe Mango Pulp Regional Analysis and Outlook
8.4. Asia Pacific Mango Pulp Revenue (USD Million) by Country (2021-2032)
8.4.1. China Mango Pulp Regional Analysis and Outlook
8.4.2. Japan Mango Pulp Regional Analysis and Outlook
8.4.3. India Mango Pulp Regional Analysis and Outlook
8.4.4. South Korea Mango Pulp Regional Analysis and Outlook
8.4.5. Australia Mango Pulp Regional Analysis and Outlook
8.4.6. South East Asia Mango Pulp Regional Analysis and Outlook
8.4.7. Rest of Asia Pacific Mango Pulp Regional Analysis and Outlook
8.5. South America Mango Pulp Revenue (USD Million), by Country (2021-2032)
8.5.1. Brazil Mango Pulp Regional Analysis and Outlook
8.5.2. Argentina Mango Pulp Regional Analysis and Outlook
8.5.3. Rest of South America Mango Pulp Regional Analysis and Outlook
8.6. Middle East and Africa Mango Pulp Revenue (USD Million) by Country (2021-2032)
8.6.1. Middle East Mango Pulp Regional Analysis and Outlook
8.6.2. Africa Mango Pulp Regional Analysis and Outlook
Chapter 9. North America Mango Pulp Analysis and Outlook
9.1. North America Mango Pulp Revenue (USD Million) by Segments (2021-2032)
9.1.1. North America Mango Pulp Revenue (USD Million) by Type (2021-2032)
9.1.2. North America Mango Pulp Revenue (USD Million) by Application (2021-2032)
9.1.3. North America Mango Pulp Revenue (USD Million) by Product (2021-2032)
By Type
Organic
Conventional
By Application
Beverages
Dairy & Frozen Products
Baby Foods
Bakery
Confectionery
Others
By Packaging
Cans
PET Jars and Bottles
Pouches
Chapter 10. Europe Mango Pulp Analysis and Outlook
10.1. Europe Mango Pulp Revenue (USD Million), by Segments (USD Million) (2021-2032)
10.1.1. Europe Mango Pulp Revenue (USD Million) by Type (2021-2032)
10.1.2. Europe Mango Pulp Revenue (USD Million) by Application (2021-2032)
10.1.3. Europe Mango Pulp Revenue (USD Million) by Product (2021-2032)
By Type
Organic
Conventional
By Application
Beverages
Dairy & Frozen Products
Baby Foods
Bakery
Confectionery
Others
By Packaging
Cans
PET Jars and Bottles
Pouches
Chapter 11. Asia Pacific Mango Pulp Analysis and Outlook
11.1. Asia Pacific Mango Pulp Revenue (USD Million), and Revenue (USD Million) by Segments (2021-2032)
11.1.1. Asia Pacific Mango Pulp Revenue (USD Million) by Type (2021-2032)
11.1.2. Asia Pacific Mango Pulp Revenue (USD Million) by Application (2021-2032)
11.1.3. Asia Pacific Mango Pulp Revenue (USD Million) by Product (2021-2032)
By Type
Organic
Conventional
By Application
Beverages
Dairy & Frozen Products
Baby Foods
Bakery
Confectionery
Others
By Packaging
Cans
PET Jars and Bottles
Pouches
Chapter 12. South America Mango Pulp Analysis and Outlook
12.1. South America Mango Pulp Revenue (USD Million), by Segments (2021-2032)
12.1.1. South America Mango Pulp Revenue (USD Million) by Type (2021-2032)
12.1.2. South America Mango Pulp Revenue (USD Million) by Application (2021-2032)
12.1.3. South America Mango Pulp Revenue (USD Million) by Product (2021-2032)
By Type
Organic
Conventional
By Application
Beverages
Dairy & Frozen Products
Baby Foods
Bakery
Confectionery
Others
By Packaging
Cans
PET Jars and Bottles
Pouches
Chapter 13. Middle East and Africa Mango Pulp Analysis and Outlook
13.1. Middle East and Africa Mango Pulp Revenue (USD Million), by Segments (2021-2032)
13.1.1. Middle East and Africa Mango Pulp Revenue (USD Million) by Type (2021-2032)
13.1.2. Middle East and Africa Mango Pulp Revenue (USD Million) by Application (2021-2032)
13.1.3. Middle East and Africa Mango Pulp Revenue (USD Million) by Product (2021-2032)
By Type
Organic
Conventional
By Application
Beverages
Dairy & Frozen Products
Baby Foods
Bakery
Confectionery
Others
By Packaging
Cans
PET Jars and Bottles
Pouches
Chapter 14. Mango Pulp Company Profiles
14.1 Business Overview
14.2 Product Profiles
14.3 SWOT Profiles
14.5 Recent Developments
14.6 Financial Profile
List of Companies
Desai Products Pvt. Ltd.
Paiyur Group of Companies
Shimla Hills Offerings Pvt. Ltd.
Sidco Foods Trading LLC
Taj Agro International
TMN International Inc.
Villa Purée
Vision Agro Foods
VJ Organic Farms Pvt. Ltd
15. Methodology and Data Sources
15.1 Customization Offerings
15.2 Subscription Services
15.3 Related Reports
15.4 Publisher Expertise
LIST OF TABLES
Table 1 Market Segmentation Analysis
Table 2 Global Mango Pulp Market Share of Leading Companies, 2023
Table 3 Product Offerings of Leading Companies
Table 4 Low Growth Scenario Forecasts
Table 5 Reference Case Growth Scenario
Table 6 High Growth Case Scenario
Table 7 Global Mango Pulp Revenue (USD Million) And CAGR (%) By Type (2021-2032)
Table 8 Global Mango Pulp Revenue (USD Million) And CAGR (%) By Application (2021-2032)
Table 9 Global Mango Pulp Revenue (USD Million) And CAGR (%) By Product (2021-2032)
Table 10 Global Mango Pulp Market Revenue (USD Million) By Regions (2021-2032)
Table 11 Global Mango Pulp Market Share (%) By Regions (2021-2032)
Table 12 North America Mango Pulp Revenue (USD Million) By Country (2021-2032)
Table 13 Europe Mango Pulp Revenue (USD Million) By Country (2021-2032)
Table 14 Asia Pacific Mango Pulp Revenue (USD Million) By Country (2021-2032)
Table 15 South America Mango Pulp Revenue (USD Million) By Country (2021-2032)
Table 16 Middle East and Africa Mango Pulp Revenue (USD Million) By Region (2021-2032)
Table 17 North America Mango Pulp Revenue (USD Million) By Type (2021-2032)
Table 18 North America Mango Pulp Revenue (USD Million) By Application (2021-2032)
Table 19 North America Mango Pulp Revenue (USD Million) By Product (2021-2032)
Table 20 Europe Mango Pulp Revenue (USD Million) By Type (2021-2032)
Table 21 Europe Mango Pulp Revenue (USD Million) By Application (2021-2032)
Table 22 Europe Mango Pulp Revenue (USD Million) By Product (2021-2032)
Table 23 Asia Pacific Mango Pulp Revenue (USD Million) By Type (2021-2032)
Table 24 Asia Pacific Mango Pulp Revenue (USD Million) By Application (2021-2032)
Table 25 Asia Pacific Mango Pulp Revenue (USD Million) By Product (2021-2032)
Table 26 South America Mango Pulp Revenue (USD Million) By Type (2021-2032)
Table 27 South America Mango Pulp Revenue (USD Million) By Application (2021-2032)
Table 28 South America Mango Pulp Revenue (USD Million) By Product (2021-2032)
Table 29 Middle East and Africa Mango Pulp Revenue (USD Million) By Type (2021-2032)
Table 30 Middle East and Africa Mango Pulp Revenue (USD Million) By Application (2021-2032)
Table 31 Middle East and Africa Mango Pulp Revenue (USD Million) By Product (2021-2032)
LIST OF FIGURES
Figure 1. Market Scope
Figure 2. Pricing Forecasts Per Unit, 2023- 2032
Figure 3. Porter’s Five Forces
Figure 4. Global Mango Pulp Market Revenue (USD Million) By Regions (2021-2032)
Figure 5. Global Mango Pulp Market Share (%) By Regions (2023)
Figure 6. North America Mango Pulp Revenue (USD Million) By Country (2021-2032)
Figure 7. United States Mango Pulp Revenue (USD Million) By Country (2021-2032)
Figure 8. Canada Mango Pulp Revenue (USD Million) By Country (2021-2032)
Figure 9. Mexico Mango Pulp Revenue (USD Million) By Country (2021-2032)
Figure 10. Europe Mango Pulp Revenue (USD Million) By Country (2021-2032)
Figure 11. Germany Mango Pulp Revenue (USD Million) By Country (2021-2032)
Figure 12. France Mango Pulp Revenue (USD Million) By Country (2021-2032)
Figure 13. United Kingdom Mango Pulp Revenue (USD Million) By Country (2021-2032)
Figure 14. Spain Mango Pulp Revenue (USD Million) By Country (2021-2032)
Figure 15. Italy Mango Pulp Revenue (USD Million) By Country (2021-2032)
Figure 16. Russia Mango Pulp Revenue (USD Million) By Country (2021-2032)
Figure 17. Rest of Europe Mango Pulp Revenue (USD Million) By Country (2021-2032)
Figure 11. Asia Pacific Mango Pulp Revenue (USD Million) By Country (2021-2032)
Figure 12. China Mango Pulp Revenue (USD Million) By Country (2021-2032)
Figure 13. Japan Mango Pulp Revenue (USD Million) By Country (2021-2032)
Figure 14. India Mango Pulp Revenue (USD Million) By Country (2021-2032)
Figure 15. South Korea Mango Pulp Revenue (USD Million) By Country (2021-2032)
Figure 16. Australia Mango Pulp Revenue (USD Million) By Country (2021-2032)
Figure 17. South East Asia Mango Pulp Revenue (USD Million) By Country (2021-2032)
Figure 18. South America Mango Pulp Revenue (USD Million) By Country (2021-2032)
Figure 19. Brazil Mango Pulp Revenue (USD Million) By Country (2021-2032)
Figure 20. Argentina Mango Pulp Revenue (USD Million) By Country (2021-2032)
Figure 21. Rest of Asia Pacific Mango Pulp Revenue (USD Million) By Country (2021-2032)
Figure 22. Middle East and Africa Mango Pulp Revenue (USD Million) By Region (2021-2032)
Figure 23. Saudi Arabia Mango Pulp Revenue (USD Million) By Region (2021-2032)
Figure 24. The UAE Mango Pulp Revenue (USD Million) By Region (2021-2032)
Figure 25. Rest of Middle East Mango Pulp Revenue (USD Million) By Region (2021-2032)
Figure 26. South Africa Mango Pulp Revenue (USD Million) By Region (2021-2032)
Figure 27. Africa Mango Pulp Revenue (USD Million) By Region (2021-2032)
Figure 28. North America Mango Pulp Revenue (USD Million) By Type (2021-2032)
Figure 29. North America Mango Pulp Revenue (USD Million) By Application (2021-2032)
Figure 30. North America Mango Pulp Revenue (USD Million) By Product (2021-2032)
Figure 31. Europe Mango Pulp Revenue (USD Million) By Type (2021-2032)
Figure 32. Europe Mango Pulp Revenue (USD Million) By Application (2021-2032)
Figure 33. Europe Mango Pulp Revenue (USD Million) By Product (2021-2032)
Figure 34. Asia Pacific Mango Pulp Revenue (USD Million) By Type (2021-2032)
Figure 35. Asia Pacific Mango Pulp Revenue (USD Million) By Application (2021-2032)
Figure 36. Asia Pacific Mango Pulp Revenue (USD Million) By Product (2021-2032)
Figure 37. South America Mango Pulp Revenue (USD Million) By Type (2021-2032)
Figure 38. South America Mango Pulp Revenue (USD Million) By Application (2021-2032)
Figure 39. South America Mango Pulp Revenue (USD Million) By Product (2021-2032)
Figure 40. Middle East and Africa Mango Pulp Revenue (USD Million) By Type (2021-2032)
Figure 41. Middle East and Africa Mango Pulp Revenue (USD Million) By Application (2021-2032)
Figure 42. Middle East and Africa Mango Pulp Revenue (USD Million) By Product (2021-2032)
By Type
Organic
Conventional
By Application
Beverages
Dairy & Frozen Products
Baby Foods
Bakery
Confectionery
Others
By Packaging
Cans
PET Jars and Bottles
Pouches
Countries Analyzed
North America (US, Canada, Mexico)
Europe (Germany, UK, France, Spain, Italy, Russia, Rest of Europe)
Asia Pacific (China, India, Japan, South Korea, Australia, South East Asia, Rest of Asia)
South America (Brazil, Argentina, Rest of South America)
Middle East and Africa (Saudi Arabia, UAE, Rest of Middle East, South Africa, Egypt, Rest of Africa)
