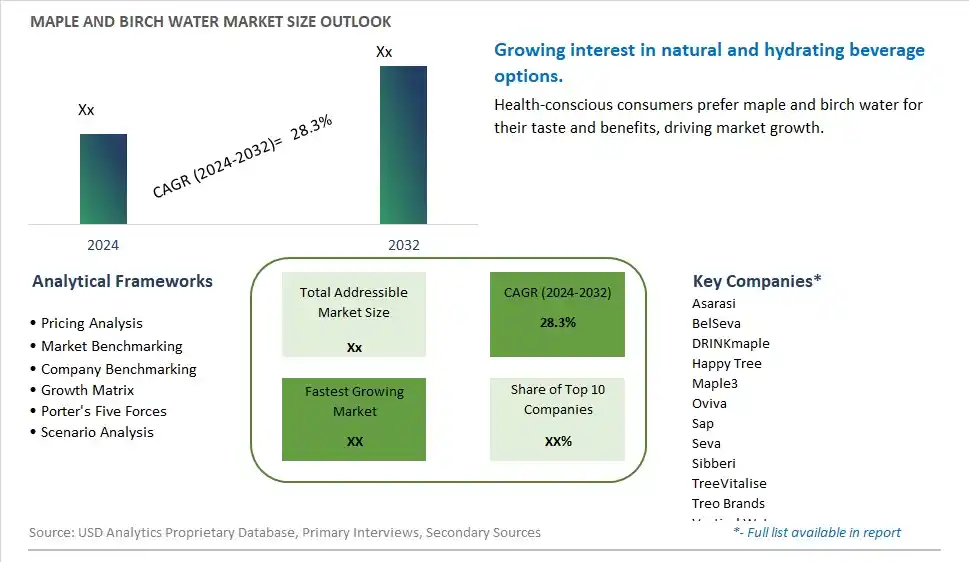
Global Maple and Birch Water Market Size is valued at $XX Million in 2024 and is forecast to register a growth rate (CAGR) of 28.3% to reach $XX Million by 2032.
The global Maple and Birch Water Market Comprehensive Study analyzes and forecasts the market size across 6 regions and 24 countries for diverse segments -By Package (250ML, 300ML, 330ML, 500ML, 1 Liter), By Application (Hypermarkets/Supermarkets, Food & Drink Specialists, Convenience Stores, Online Shop, Others)
An Introduction to Maple and Birch Water Market
The maple and birch water market in 2024 is experiencing robust growth, driven by the demand for natural, low-calorie beverages with health benefits. Maple and birch water, harvested from the sap of maple and birch trees, is valued for its hydrating properties and trace minerals. The market benefits from innovations in harvesting and packaging techniques that enhance product quality and shelf life. The trend towards clean label, organic, and natural beverages is influencing market dynamics. Increasing consumer interest in functional and plant-based drinks is further supporting demand for maple and birch water.
Maple and Birch Water Competitive Landscape
The market report analyses the leading companies in the industry including Asarasi, BelSeva, DRINKmaple, Happy Tree, Maple3, Oviva, Sap, Seva, Sibberi, TreeVitalise, Treo Brands, Vertical Water, and Others.
Maple and Birch Water Market Dynamics
Maple and Birch Water Market Trend: Growing Popularity of Plant-Based Waters
The most prominent trend in the Maple and Birch Water Market is the growing popularity of plant-based waters. Maple and birch water, known for their natural sweetness and hydrating properties, are gaining popularity among consumers seeking healthier and more natural beverage options. This trend is driven by the desire for functional and refreshing drinks that offer unique flavors and health benefits.
Maple and Birch Water Market Driver: Increasing Health Consciousness and Demand for Natural Beverages
A key driver in the Maple and Birch Water Market is increasing health consciousness and the demand for natural beverages. As more consumers focus on improving their hydration and overall health, there is a growing preference for plant-based waters that offer natural hydration and added nutrients. Maple and birch water, with their natural composition and health benefits, cater to this demand and support market growth.
Maple and Birch Water Market Opportunity: Innovation in Product Formulations and Flavors
One significant opportunity in the Maple and Birch Water Market lies in innovation in product formulations and flavors. Companies can develop new maple and birch water products that incorporate additional flavors, such as fruit infusions or herbal extracts, and highlight their health benefits. By offering diverse and appealing options, manufacturers can attract a broader consumer base and drive market growth .
Maple and Birch Water Market Share Analysis: 500ML segment generated the highest revenue share in the industry
Among the packaging options for Maple and Birch Water, the largest segment is "500ML." This size is popular due to its balance between portability and volume, making it convenient for consumers to carry and consume maple and birch water on the go. The 500ml package size appeals to a broad demographic, from individual consumers to families, seeking hydrating beverages with natural flavors and nutritional benefits. Its popularity is supported by its versatility in usage scenarios, whether as a standalone refreshment or as an ingredient in various culinary and beverage applications. Manufacturers favor this size for its market acceptance and practicality, ensuring steady demand across retail channels.
Maple and Birch Water Market Share Analysis: Online Shop is the fastest growing segment over the forecast period to 2032
The fastest-growing segment in the Maple and Birch Water market through 2032 is "Online Shop." The shift towards online shopping platforms has accelerated the demand for maple and birch water due to their natural hydration properties and perceived health benefits. Online shops provide consumers with convenient access to a diverse range of maple and birch water products, offering choices that cater to different tastes and preferences. The growing trend of e-commerce in the food and beverage sector, coupled with increasing consumer awareness of healthy beverage options, drives the rapid growth of maple and birch water sales online. Manufacturers and retailers are leveraging digital marketing strategies and e-commerce platforms to expand their market reach and capture the attention of health-conscious consumers seeking convenient and sustainable beverage choices online.
Maple and Birch Water Market Segmentation
By Package
250ML
300ML
330ML
500ML
1 Liter
By Application
Hypermarkets/Supermarkets
Food & Drink Specialists
Convenience Stores
Online Shop
Others
Countries Analyzed
North America (US, Canada, Mexico)
Europe (Germany, UK, France, Spain, Italy, Russia, Rest of Europe)
Asia Pacific (China, India, Japan, South Korea, Australia, South East Asia, Rest of Asia)
South America (Brazil, Argentina, Rest of South America)
Middle East and Africa (Saudi Arabia, UAE, Rest of Middle East, South Africa, Egypt, Rest of Africa)
Maple and Birch Water Companies Profiled in the Study
Asarasi
BelSeva
DRINKmaple
Happy Tree
Maple3
Oviva
Sap
Seva
Sibberi
TreeVitalise
Treo Brands
Vertical Water
*- List Not Exhaustive
Chapter 1. TABLE OF CONTENTS
Chapter 2. Introduction to Maple and Birch Water Market
2.1. Market Overview
2.2. Key Statistics and Report Highlights
2.3. Scope of the Comprehensive Study
2.3.1. Market Definition
2.3.2 Countries and Regions Covered
2.3.3 Research Objective
2.3.4 Units, Currency, and Conversions
2.3.5 Industry Value Chain
2.4. Key Market Segments
2.5. Key Companies
2.6. Study Period
Chapter 3. Strategic Analysis Review
3.1. Maple and Birch Water Pricing Analysis and Forecast
3.2. Porter’s Five Forces
3.3. Market Ecosystem
3.4. SWOT Analysis
3.5. Regulatory Scenario
3.3. Effects of Inflation, Russia-Ukraine War, moderating economic growth, and other macroeconomic factors
Chapter 4. Competitive Landscape
4.1. Market Share Analysis
4.1.1. Global Maple and Birch Water Market Share by Company, 2023
4.1.2. Product Offerings of Leading Maple and Birch Water Companies
4.2. Market Entropy
4.2.1. New Product Launches in the Industry
4.2.2. Mergers, Acquisitions, Joint ventures, and Partnerships
4.3. Key Strategies and Best Practices
Chapter 5. Global Market Projections: Best, Reference, and Low Case Scenarios
5.1. Growth Analysis- Case Scenario Definitions
5.2. Low Growth Case Scenario Forecasts
5.3. Reference Growth Case Scenario Forecasts
5.4. High Growth Case Scenario Forecasts
Chapter 6. Market Dynamics
6.1. Maple and Birch Water Market Drivers
6.2. Maple and Birch Water Market Challenges
6.6. Maple and Birch Water Market Opportunities
6.4. Maple and Birch Water Market Trends
Chapter 7. Global Maple and Birch Water Market Outlook Trends
7.1. Global Maple and Birch Water Revenue (USD Million) and CAGR (%) by Type (2021-2032)
7.2. Global Maple and Birch Water Revenue (USD Million) and CAGR (%) by Application (2021-2032)
7.3. Global Maple and Birch Water Revenue (USD Million) and CAGR (%) by Product (2021-2032)
By Package
250ML
300ML
330ML
500ML
1 Liter
By Application
Hypermarkets/Supermarkets
Food & Drink Specialists
Convenience Stores
Online Shop
Others
Chapter 8. Global Maple and Birch Water Regional Analysis and Outlook
8.1. Global Maple and Birch Water Revenue (USD Million) By Regions (2021- 2032)
8.2. North America Maple and Birch Water Revenue (USD Million) by Country (2021-2032)
8.2.1. United States Maple and Birch Water Regional Analysis and Outlook
8.2.2. Canada Maple and Birch Water Regional Analysis and Outlook
8.2.3. Mexico Maple and Birch Water Regional Analysis and Outlook
8.3. Europe Maple and Birch Water Revenue (USD Million), by Country (2021-2032)
8.3.1. Germany Maple and Birch Water Regional Analysis and Outlook
8.3.2. France Maple and Birch Water Regional Analysis and Outlook
8.3.3. United Kingdom Maple and Birch Water Regional Analysis and Outlook
8.3.4. Spain Maple and Birch Water Regional Analysis and Outlook
8.3.5. Italy Maple and Birch Water Regional Analysis and Outlook
8.3.6. Russia Maple and Birch Water Regional Analysis and Outlook
8.3.7. Rest of Europe Maple and Birch Water Regional Analysis and Outlook
8.4. Asia Pacific Maple and Birch Water Revenue (USD Million) by Country (2021-2032)
8.4.1. China Maple and Birch Water Regional Analysis and Outlook
8.4.2. Japan Maple and Birch Water Regional Analysis and Outlook
8.4.3. India Maple and Birch Water Regional Analysis and Outlook
8.4.4. South Korea Maple and Birch Water Regional Analysis and Outlook
8.4.5. Australia Maple and Birch Water Regional Analysis and Outlook
8.4.6. South East Asia Maple and Birch Water Regional Analysis and Outlook
8.4.7. Rest of Asia Pacific Maple and Birch Water Regional Analysis and Outlook
8.5. South America Maple and Birch Water Revenue (USD Million), by Country (2021-2032)
8.5.1. Brazil Maple and Birch Water Regional Analysis and Outlook
8.5.2. Argentina Maple and Birch Water Regional Analysis and Outlook
8.5.3. Rest of South America Maple and Birch Water Regional Analysis and Outlook
8.6. Middle East and Africa Maple and Birch Water Revenue (USD Million) by Country (2021-2032)
8.6.1. Middle East Maple and Birch Water Regional Analysis and Outlook
8.6.2. Africa Maple and Birch Water Regional Analysis and Outlook
Chapter 9. North America Maple and Birch Water Analysis and Outlook
9.1. North America Maple and Birch Water Revenue (USD Million) by Segments (2021-2032)
9.1.1. North America Maple and Birch Water Revenue (USD Million) by Type (2021-2032)
9.1.2. North America Maple and Birch Water Revenue (USD Million) by Application (2021-2032)
9.1.3. North America Maple and Birch Water Revenue (USD Million) by Product (2021-2032)
By Package
250ML
300ML
330ML
500ML
1 Liter
By Application
Hypermarkets/Supermarkets
Food & Drink Specialists
Convenience Stores
Online Shop
Others
Chapter 10. Europe Maple and Birch Water Analysis and Outlook
10.1. Europe Maple and Birch Water Revenue (USD Million), by Segments (USD Million) (2021-2032)
10.1.1. Europe Maple and Birch Water Revenue (USD Million) by Type (2021-2032)
10.1.2. Europe Maple and Birch Water Revenue (USD Million) by Application (2021-2032)
10.1.3. Europe Maple and Birch Water Revenue (USD Million) by Product (2021-2032)
By Package
250ML
300ML
330ML
500ML
1 Liter
By Application
Hypermarkets/Supermarkets
Food & Drink Specialists
Convenience Stores
Online Shop
Others
Chapter 11. Asia Pacific Maple and Birch Water Analysis and Outlook
11.1. Asia Pacific Maple and Birch Water Revenue (USD Million), and Revenue (USD Million) by Segments (2021-2032)
11.1.1. Asia Pacific Maple and Birch Water Revenue (USD Million) by Type (2021-2032)
11.1.2. Asia Pacific Maple and Birch Water Revenue (USD Million) by Application (2021-2032)
11.1.3. Asia Pacific Maple and Birch Water Revenue (USD Million) by Product (2021-2032)
By Package
250ML
300ML
330ML
500ML
1 Liter
By Application
Hypermarkets/Supermarkets
Food & Drink Specialists
Convenience Stores
Online Shop
Others
Chapter 12. South America Maple and Birch Water Analysis and Outlook
12.1. South America Maple and Birch Water Revenue (USD Million), by Segments (2021-2032)
12.1.1. South America Maple and Birch Water Revenue (USD Million) by Type (2021-2032)
12.1.2. South America Maple and Birch Water Revenue (USD Million) by Application (2021-2032)
12.1.3. South America Maple and Birch Water Revenue (USD Million) by Product (2021-2032)
By Package
250ML
300ML
330ML
500ML
1 Liter
By Application
Hypermarkets/Supermarkets
Food & Drink Specialists
Convenience Stores
Online Shop
Others
Chapter 13. Middle East and Africa Maple and Birch Water Analysis and Outlook
13.1. Middle East and Africa Maple and Birch Water Revenue (USD Million), by Segments (2021-2032)
13.1.1. Middle East and Africa Maple and Birch Water Revenue (USD Million) by Type (2021-2032)
13.1.2. Middle East and Africa Maple and Birch Water Revenue (USD Million) by Application (2021-2032)
13.1.3. Middle East and Africa Maple and Birch Water Revenue (USD Million) by Product (2021-2032)
By Package
250ML
300ML
330ML
500ML
1 Liter
By Application
Hypermarkets/Supermarkets
Food & Drink Specialists
Convenience Stores
Online Shop
Others
Chapter 14. Maple and Birch Water Company Profiles
14.1 Business Overview
14.2 Product Profiles
14.3 SWOT Profiles
14.5 Recent Developments
14.6 Financial Profile
List of Companies
Asarasi
BelSeva
DRINKmaple
Happy Tree
Maple3
Oviva
Sap
Seva
Sibberi
TreeVitalise
Treo Brands
Vertical Water
15. Methodology and Data Sources
15.1 Customization Offerings
15.2 Subscription Services
15.3 Related Reports
15.4 Publisher Expertise
LIST OF TABLES
Table 1 Market Segmentation Analysis
Table 2 Global Maple and Birch Water Market Share of Leading Companies, 2023
Table 3 Product Offerings of Leading Companies
Table 4 Low Growth Scenario Forecasts
Table 5 Reference Case Growth Scenario
Table 6 High Growth Case Scenario
Table 7 Global Maple and Birch Water Revenue (USD Million) And CAGR (%) By Type (2021-2032)
Table 8 Global Maple and Birch Water Revenue (USD Million) And CAGR (%) By Application (2021-2032)
Table 9 Global Maple and Birch Water Revenue (USD Million) And CAGR (%) By Product (2021-2032)
Table 10 Global Maple and Birch Water Market Revenue (USD Million) By Regions (2021-2032)
Table 11 Global Maple and Birch Water Market Share (%) By Regions (2021-2032)
Table 12 North America Maple and Birch Water Revenue (USD Million) By Country (2021-2032)
Table 13 Europe Maple and Birch Water Revenue (USD Million) By Country (2021-2032)
Table 14 Asia Pacific Maple and Birch Water Revenue (USD Million) By Country (2021-2032)
Table 15 South America Maple and Birch Water Revenue (USD Million) By Country (2021-2032)
Table 16 Middle East and Africa Maple and Birch Water Revenue (USD Million) By Region (2021-2032)
Table 17 North America Maple and Birch Water Revenue (USD Million) By Type (2021-2032)
Table 18 North America Maple and Birch Water Revenue (USD Million) By Application (2021-2032)
Table 19 North America Maple and Birch Water Revenue (USD Million) By Product (2021-2032)
Table 20 Europe Maple and Birch Water Revenue (USD Million) By Type (2021-2032)
Table 21 Europe Maple and Birch Water Revenue (USD Million) By Application (2021-2032)
Table 22 Europe Maple and Birch Water Revenue (USD Million) By Product (2021-2032)
Table 23 Asia Pacific Maple and Birch Water Revenue (USD Million) By Type (2021-2032)
Table 24 Asia Pacific Maple and Birch Water Revenue (USD Million) By Application (2021-2032)
Table 25 Asia Pacific Maple and Birch Water Revenue (USD Million) By Product (2021-2032)
Table 26 South America Maple and Birch Water Revenue (USD Million) By Type (2021-2032)
Table 27 South America Maple and Birch Water Revenue (USD Million) By Application (2021-2032)
Table 28 South America Maple and Birch Water Revenue (USD Million) By Product (2021-2032)
Table 29 Middle East and Africa Maple and Birch Water Revenue (USD Million) By Type (2021-2032)
Table 30 Middle East and Africa Maple and Birch Water Revenue (USD Million) By Application (2021-2032)
Table 31 Middle East and Africa Maple and Birch Water Revenue (USD Million) By Product (2021-2032)
LIST OF FIGURES
Figure 1. Market Scope
Figure 2. Pricing Forecasts Per Unit, 2023- 2032
Figure 3. Porter’s Five Forces
Figure 4. Global Maple and Birch Water Market Revenue (USD Million) By Regions (2021-2032)
Figure 5. Global Maple and Birch Water Market Share (%) By Regions (2023)
Figure 6. North America Maple and Birch Water Revenue (USD Million) By Country (2021-2032)
Figure 7. United States Maple and Birch Water Revenue (USD Million) By Country (2021-2032)
Figure 8. Canada Maple and Birch Water Revenue (USD Million) By Country (2021-2032)
Figure 9. Mexico Maple and Birch Water Revenue (USD Million) By Country (2021-2032)
Figure 10. Europe Maple and Birch Water Revenue (USD Million) By Country (2021-2032)
Figure 11. Germany Maple and Birch Water Revenue (USD Million) By Country (2021-2032)
Figure 12. France Maple and Birch Water Revenue (USD Million) By Country (2021-2032)
Figure 13. United Kingdom Maple and Birch Water Revenue (USD Million) By Country (2021-2032)
Figure 14. Spain Maple and Birch Water Revenue (USD Million) By Country (2021-2032)
Figure 15. Italy Maple and Birch Water Revenue (USD Million) By Country (2021-2032)
Figure 16. Russia Maple and Birch Water Revenue (USD Million) By Country (2021-2032)
Figure 17. Rest of Europe Maple and Birch Water Revenue (USD Million) By Country (2021-2032)
Figure 11. Asia Pacific Maple and Birch Water Revenue (USD Million) By Country (2021-2032)
Figure 12. China Maple and Birch Water Revenue (USD Million) By Country (2021-2032)
Figure 13. Japan Maple and Birch Water Revenue (USD Million) By Country (2021-2032)
Figure 14. India Maple and Birch Water Revenue (USD Million) By Country (2021-2032)
Figure 15. South Korea Maple and Birch Water Revenue (USD Million) By Country (2021-2032)
Figure 16. Australia Maple and Birch Water Revenue (USD Million) By Country (2021-2032)
Figure 17. South East Asia Maple and Birch Water Revenue (USD Million) By Country (2021-2032)
Figure 18. South America Maple and Birch Water Revenue (USD Million) By Country (2021-2032)
Figure 19. Brazil Maple and Birch Water Revenue (USD Million) By Country (2021-2032)
Figure 20. Argentina Maple and Birch Water Revenue (USD Million) By Country (2021-2032)
Figure 21. Rest of Asia Pacific Maple and Birch Water Revenue (USD Million) By Country (2021-2032)
Figure 22. Middle East and Africa Maple and Birch Water Revenue (USD Million) By Region (2021-2032)
Figure 23. Saudi Arabia Maple and Birch Water Revenue (USD Million) By Region (2021-2032)
Figure 24. The UAE Maple and Birch Water Revenue (USD Million) By Region (2021-2032)
Figure 25. Rest of Middle East Maple and Birch Water Revenue (USD Million) By Region (2021-2032)
Figure 26. South Africa Maple and Birch Water Revenue (USD Million) By Region (2021-2032)
Figure 27. Africa Maple and Birch Water Revenue (USD Million) By Region (2021-2032)
Figure 28. North America Maple and Birch Water Revenue (USD Million) By Type (2021-2032)
Figure 29. North America Maple and Birch Water Revenue (USD Million) By Application (2021-2032)
Figure 30. North America Maple and Birch Water Revenue (USD Million) By Product (2021-2032)
Figure 31. Europe Maple and Birch Water Revenue (USD Million) By Type (2021-2032)
Figure 32. Europe Maple and Birch Water Revenue (USD Million) By Application (2021-2032)
Figure 33. Europe Maple and Birch Water Revenue (USD Million) By Product (2021-2032)
Figure 34. Asia Pacific Maple and Birch Water Revenue (USD Million) By Type (2021-2032)
Figure 35. Asia Pacific Maple and Birch Water Revenue (USD Million) By Application (2021-2032)
Figure 36. Asia Pacific Maple and Birch Water Revenue (USD Million) By Product (2021-2032)
Figure 37. South America Maple and Birch Water Revenue (USD Million) By Type (2021-2032)
Figure 38. South America Maple and Birch Water Revenue (USD Million) By Application (2021-2032)
Figure 39. South America Maple and Birch Water Revenue (USD Million) By Product (2021-2032)
Figure 40. Middle East and Africa Maple and Birch Water Revenue (USD Million) By Type (2021-2032)
Figure 41. Middle East and Africa Maple and Birch Water Revenue (USD Million) By Application (2021-2032)
Figure 42. Middle East and Africa Maple and Birch Water Revenue (USD Million) By Product (2021-2032)
By Package
250ML
300ML
330ML
500ML
1 Liter
By Application
Hypermarkets/Supermarkets
Food & Drink Specialists
Convenience Stores
Online Shop
Others
Countries Analyzed
North America (US, Canada, Mexico)
Europe (Germany, UK, France, Spain, Italy, Russia, Rest of Europe)
Asia Pacific (China, India, Japan, South Korea, Australia, South East Asia, Rest of Asia)
South America (Brazil, Argentina, Rest of South America)
Middle East and Africa (Saudi Arabia, UAE, Rest of Middle East, South Africa, Egypt, Rest of Africa)
