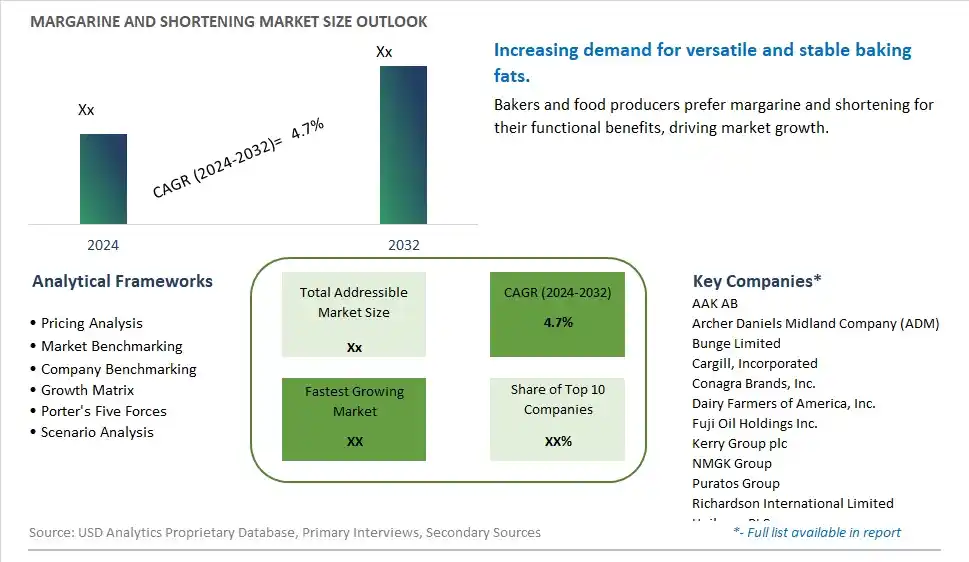
Global Margarine and Shortening Market Size is valued at $XX Million in 2024 and is forecast to register a growth rate (CAGR) of 4.7% to reach $XX Million by 2032.
The global Margarine and Shortening Market Comprehensive Study analyzes and forecasts the market size across 6 regions and 24 countries for diverse segments -By Product (Margarine, Shortening), By Source (Plant-based, Animal-based), By Form (Solid, Liquid), By Application (Baking and Pastry, Cooking and Frying, Spreads and Toppings, Industrial), By End-User (Retail, Food Service, Industrial)
An Introduction to Margarine and Shortening Market
The margarine and shortening market in 2024 is expanding, driven by the demand for versatile, plant-based fat products in baking and cooking. Margarine and shortening are widely used as alternatives to butter, offering similar functionality with lower saturated fat content. The market benefits from innovations in fat processing and formulation that enhance the quality and performance of margarine and shortening. The trend towards clean label and natural ingredients is influencing product development. Increasing consumer interest in plant-based diets and the popularity of vegan and dairy-free products are further supporting market growth.
Margarine and Shortening Competitive Landscape
The market report analyses the leading companies in the industry including AAK AB, Archer Daniels Midland Company (ADM), Bunge Limited, Cargill, Incorporated, Conagra Brands, Inc., Dairy Farmers of America, Inc., Fuji Oil Holdings Inc., Kerry Group plc, NMGK Group, Puratos Group, Richardson International Limited, Unilever PLC, Upfield Holdings B.V., Vandemoortele NV, Wilmar International Limited, and Others.
Margarine and Shortening Market Dynamics
Margarine and Shortening Market Trend: Shift Towards Healthier Fats
The most prominent trend in the Margarine and Shortening Market is the shift towards healthier fats. Consumers are increasingly opting for margarine and shortening products that contain lower levels of trans fats and are made with healthier oils, such as olive oil and avocado oil. This trend is driven by growing health consciousness and the desire to reduce the risk of heart disease.
Margarine and Shortening Market Driver: Increasing Demand for Baked Goods
A key driver in the Margarine and Shortening Market is the increasing demand for baked goods. As the consumption of pastries, cakes, and other baked products continues to rise, there is a growing need for high-quality margarine and shortening that enhance the texture and flavor of these items. This driver supports the expansion of the market as manufacturers cater to the bakery industry.
Margarine and Shortening Market Opportunity: Innovation in Functional Ingredients
One significant opportunity in the Margarine and Shortening Market lies in innovation in functional ingredients. Companies can develop new margarine and shortening products that incorporate functional ingredients, such as plant sterols and omega-3 fatty acids, to offer added health benefits. By focusing on health-enhancing formulations, manufacturers can attract a broader consumer base and drive market growth.
Margarine and Shortening Market Share Analysis: Margarine segment generated the highest revenue share in the industry
The largest segment in the Margarine and Shortening market, categorized by product, is "Margarine." Margarine holds a significant share in the market due to its widespread use as a butter substitute in baking, cooking, and spreading applications. It is favored for its lower cost compared to butter, longer shelf life, and versatility in culinary uses. Margarine's ability to mimic the texture and flavor of butter while offering various formulations catering to dietary preferences, such as reduced-fat or plant-based options, contributes to its popularity among consumers and foodservice operators alike.
Margarine and Shortening Market Share Analysis: Plant-based is the fastest growing segment over the forecast period to 2032
The fastest-growing segment in the Margarine and Shortening market through 2032 is "Plant-based." There is a notable shift towards plant-based sources in margarine and shortening production, driven by increasing consumer preference for healthier and sustainable food choices. Plant-based margarines and shortenings are derived from oils such as soybean, palm, sunflower, or coconut, offering a vegan-friendly alternative to animal-based products. This trend is amplified by growing awareness of environmental impact and health benefits associated with plant-based diets. Manufacturers are responding to this demand by innovating with new formulations that replicate the functionality and flavor profile of traditional margarines and shortenings, thereby expanding the market for plant-based options across baking, cooking, and industrial applications.
Margarine and Shortening Market Share Analysis: Soild segment generated the highest revenue share in the industry
Within the Margarine and Shortening market, the largest segment categorized by form is "Solid." Solid margarine and shortening products dominate the market due to their practicality and versatility in various culinary applications. Solid forms of margarine and shortening are preferred for baking and pastry-making, where precise measurements and consistency are crucial for achieving desired textures and flavors in finished products. Solid margarine is also popular for spreading on bread and toast, providing a convenient alternative to butter with extended shelf life and stable performance in both home and commercial kitchens.
Margarine and Shortening Market Share Analysis: Spreads and Toppings is the fastest growing segment over the forecast period to 2032
The fastest-growing segment in the Margarine and Shortening market to 2032 is "Spreads and Toppings." This segment is experiencing rapid growth driven by changing consumer preferences towards convenience and health-conscious choices. Margarine and shortening-based spreads and toppings are increasingly popular as they offer a versatile option for enhancing the flavor and texture of bread, toast, and other baked goods. Consumers are seeking alternatives to traditional butter and are attracted to margarine-based spreads for their lower saturated fat content and ability to incorporate additional flavors and functional ingredients like omega-3 fatty acids or plant sterols. The versatility of margarine and shortening in spreads and toppings aligns with current trends in quick and nutritious meal options, driving innovation and expansion within this segment of the market.
Margarine and Shortening Market Segmentation
By Product
Margarine
Shortening
By Source
Plant-based
Animal-based
By Form
Solid
Liquid
By Application
Baking and Pastry
Cooking and Frying
Spreads and Toppings
Industrial
By End-User
Retail
Food Service
Industrial
Countries Analyzed
North America (US, Canada, Mexico)
Europe (Germany, UK, France, Spain, Italy, Russia, Rest of Europe)
Asia Pacific (China, India, Japan, South Korea, Australia, South East Asia, Rest of Asia)
South America (Brazil, Argentina, Rest of South America)
Middle East and Africa (Saudi Arabia, UAE, Rest of Middle East, South Africa, Egypt, Rest of Africa)
Margarine and Shortening Companies Profiled in the Study
AAK AB
Archer Daniels Midland Company (ADM)
Bunge Limited
Cargill, Incorporated
Conagra Brands, Inc.
Dairy Farmers of America, Inc.
Fuji Oil Holdings Inc.
Kerry Group plc
NMGK Group
Puratos Group
Richardson International Limited
Unilever PLC
Upfield Holdings B.V.
Vandemoortele NV
Wilmar International Limited
*- List Not Exhaustive
Chapter 1. TABLE OF CONTENTS
Chapter 2. Introduction to Margarine and Shortening Market
2.1. Market Overview
2.2. Key Statistics and Report Highlights
2.3. Scope of the Comprehensive Study
2.3.1. Market Definition
2.3.2 Countries and Regions Covered
2.3.3 Research Objective
2.3.4 Units, Currency, and Conversions
2.3.5 Industry Value Chain
2.4. Key Market Segments
2.5. Key Companies
2.6. Study Period
Chapter 3. Strategic Analysis Review
3.1. Margarine and Shortening Pricing Analysis and Forecast
3.2. Porter’s Five Forces
3.3. Market Ecosystem
3.4. SWOT Analysis
3.5. Regulatory Scenario
3.3. Effects of Inflation, Russia-Ukraine War, moderating economic growth, and other macroeconomic factors
Chapter 4. Competitive Landscape
4.1. Market Share Analysis
4.1.1. Global Margarine and Shortening Market Share by Company, 2023
4.1.2. Product Offerings of Leading Margarine and Shortening Companies
4.2. Market Entropy
4.2.1. New Product Launches in the Industry
4.2.2. Mergers, Acquisitions, Joint ventures, and Partnerships
4.3. Key Strategies and Best Practices
Chapter 5. Global Market Projections: Best, Reference, and Low Case Scenarios
5.1. Growth Analysis- Case Scenario Definitions
5.2. Low Growth Case Scenario Forecasts
5.3. Reference Growth Case Scenario Forecasts
5.4. High Growth Case Scenario Forecasts
Chapter 6. Market Dynamics
6.1. Margarine and Shortening Market Drivers
6.2. Margarine and Shortening Market Challenges
6.6. Margarine and Shortening Market Opportunities
6.4. Margarine and Shortening Market Trends
Chapter 7. Global Margarine and Shortening Market Outlook Trends
7.1. Global Margarine and Shortening Revenue (USD Million) and CAGR (%) by Type (2021-2032)
7.2. Global Margarine and Shortening Revenue (USD Million) and CAGR (%) by Application (2021-2032)
7.3. Global Margarine and Shortening Revenue (USD Million) and CAGR (%) by Product (2021-2032)
By Product
Margarine
Shortening
By Source
Plant-based
Animal-based
By Form
Solid
Liquid
By Application
Baking and Pastry
Cooking and Frying
Spreads and Toppings
Industrial
By End-User
Retail
Food Service
Industrial
Chapter 8. Global Margarine and Shortening Regional Analysis and Outlook
8.1. Global Margarine and Shortening Revenue (USD Million) By Regions (2021- 2032)
8.2. North America Margarine and Shortening Revenue (USD Million) by Country (2021-2032)
8.2.1. United States Margarine and Shortening Regional Analysis and Outlook
8.2.2. Canada Margarine and Shortening Regional Analysis and Outlook
8.2.3. Mexico Margarine and Shortening Regional Analysis and Outlook
8.3. Europe Margarine and Shortening Revenue (USD Million), by Country (2021-2032)
8.3.1. Germany Margarine and Shortening Regional Analysis and Outlook
8.3.2. France Margarine and Shortening Regional Analysis and Outlook
8.3.3. United Kingdom Margarine and Shortening Regional Analysis and Outlook
8.3.4. Spain Margarine and Shortening Regional Analysis and Outlook
8.3.5. Italy Margarine and Shortening Regional Analysis and Outlook
8.3.6. Russia Margarine and Shortening Regional Analysis and Outlook
8.3.7. Rest of Europe Margarine and Shortening Regional Analysis and Outlook
8.4. Asia Pacific Margarine and Shortening Revenue (USD Million) by Country (2021-2032)
8.4.1. China Margarine and Shortening Regional Analysis and Outlook
8.4.2. Japan Margarine and Shortening Regional Analysis and Outlook
8.4.3. India Margarine and Shortening Regional Analysis and Outlook
8.4.4. South Korea Margarine and Shortening Regional Analysis and Outlook
8.4.5. Australia Margarine and Shortening Regional Analysis and Outlook
8.4.6. South East Asia Margarine and Shortening Regional Analysis and Outlook
8.4.7. Rest of Asia Pacific Margarine and Shortening Regional Analysis and Outlook
8.5. South America Margarine and Shortening Revenue (USD Million), by Country (2021-2032)
8.5.1. Brazil Margarine and Shortening Regional Analysis and Outlook
8.5.2. Argentina Margarine and Shortening Regional Analysis and Outlook
8.5.3. Rest of South America Margarine and Shortening Regional Analysis and Outlook
8.6. Middle East and Africa Margarine and Shortening Revenue (USD Million) by Country (2021-2032)
8.6.1. Middle East Margarine and Shortening Regional Analysis and Outlook
8.6.2. Africa Margarine and Shortening Regional Analysis and Outlook
Chapter 9. North America Margarine and Shortening Analysis and Outlook
9.1. North America Margarine and Shortening Revenue (USD Million) by Segments (2021-2032)
9.1.1. North America Margarine and Shortening Revenue (USD Million) by Type (2021-2032)
9.1.2. North America Margarine and Shortening Revenue (USD Million) by Application (2021-2032)
9.1.3. North America Margarine and Shortening Revenue (USD Million) by Product (2021-2032)
By Product
Margarine
Shortening
By Source
Plant-based
Animal-based
By Form
Solid
Liquid
By Application
Baking and Pastry
Cooking and Frying
Spreads and Toppings
Industrial
By End-User
Retail
Food Service
Industrial
Chapter 10. Europe Margarine and Shortening Analysis and Outlook
10.1. Europe Margarine and Shortening Revenue (USD Million), by Segments (USD Million) (2021-2032)
10.1.1. Europe Margarine and Shortening Revenue (USD Million) by Type (2021-2032)
10.1.2. Europe Margarine and Shortening Revenue (USD Million) by Application (2021-2032)
10.1.3. Europe Margarine and Shortening Revenue (USD Million) by Product (2021-2032)
By Product
Margarine
Shortening
By Source
Plant-based
Animal-based
By Form
Solid
Liquid
By Application
Baking and Pastry
Cooking and Frying
Spreads and Toppings
Industrial
By End-User
Retail
Food Service
Industrial
Chapter 11. Asia Pacific Margarine and Shortening Analysis and Outlook
11.1. Asia Pacific Margarine and Shortening Revenue (USD Million), and Revenue (USD Million) by Segments (2021-2032)
11.1.1. Asia Pacific Margarine and Shortening Revenue (USD Million) by Type (2021-2032)
11.1.2. Asia Pacific Margarine and Shortening Revenue (USD Million) by Application (2021-2032)
11.1.3. Asia Pacific Margarine and Shortening Revenue (USD Million) by Product (2021-2032)
By Product
Margarine
Shortening
By Source
Plant-based
Animal-based
By Form
Solid
Liquid
By Application
Baking and Pastry
Cooking and Frying
Spreads and Toppings
Industrial
By End-User
Retail
Food Service
Industrial
Chapter 12. South America Margarine and Shortening Analysis and Outlook
12.1. South America Margarine and Shortening Revenue (USD Million), by Segments (2021-2032)
12.1.1. South America Margarine and Shortening Revenue (USD Million) by Type (2021-2032)
12.1.2. South America Margarine and Shortening Revenue (USD Million) by Application (2021-2032)
12.1.3. South America Margarine and Shortening Revenue (USD Million) by Product (2021-2032)
By Product
Margarine
Shortening
By Source
Plant-based
Animal-based
By Form
Solid
Liquid
By Application
Baking and Pastry
Cooking and Frying
Spreads and Toppings
Industrial
By End-User
Retail
Food Service
Industrial
Chapter 13. Middle East and Africa Margarine and Shortening Analysis and Outlook
13.1. Middle East and Africa Margarine and Shortening Revenue (USD Million), by Segments (2021-2032)
13.1.1. Middle East and Africa Margarine and Shortening Revenue (USD Million) by Type (2021-2032)
13.1.2. Middle East and Africa Margarine and Shortening Revenue (USD Million) by Application (2021-2032)
13.1.3. Middle East and Africa Margarine and Shortening Revenue (USD Million) by Product (2021-2032)
By Product
Margarine
Shortening
By Source
Plant-based
Animal-based
By Form
Solid
Liquid
By Application
Baking and Pastry
Cooking and Frying
Spreads and Toppings
Industrial
By End-User
Retail
Food Service
Industrial
Chapter 14. Margarine and Shortening Company Profiles
14.1 Business Overview
14.2 Product Profiles
14.3 SWOT Profiles
14.5 Recent Developments
14.6 Financial Profile
List of Companies
AAK AB
Archer Daniels Midland Company (ADM)
Bunge Limited
Cargill, Incorporated
Conagra Brands, Inc.
Dairy Farmers of America, Inc.
Fuji Oil Holdings Inc.
Kerry Group plc
NMGK Group
Puratos Group
Richardson International Limited
Unilever PLC
Upfield Holdings B.V.
Vandemoortele NV
Wilmar International Limited
15. Methodology and Data Sources
15.1 Customization Offerings
15.2 Subscription Services
15.3 Related Reports
15.4 Publisher Expertise
LIST OF TABLES
Table 1 Market Segmentation Analysis
Table 2 Global Margarine and Shortening Market Share of Leading Companies, 2023
Table 3 Product Offerings of Leading Companies
Table 4 Low Growth Scenario Forecasts
Table 5 Reference Case Growth Scenario
Table 6 High Growth Case Scenario
Table 7 Global Margarine and Shortening Revenue (USD Million) And CAGR (%) By Type (2021-2032)
Table 8 Global Margarine and Shortening Revenue (USD Million) And CAGR (%) By Application (2021-2032)
Table 9 Global Margarine and Shortening Revenue (USD Million) And CAGR (%) By Product (2021-2032)
Table 10 Global Margarine and Shortening Market Revenue (USD Million) By Regions (2021-2032)
Table 11 Global Margarine and Shortening Market Share (%) By Regions (2021-2032)
Table 12 North America Margarine and Shortening Revenue (USD Million) By Country (2021-2032)
Table 13 Europe Margarine and Shortening Revenue (USD Million) By Country (2021-2032)
Table 14 Asia Pacific Margarine and Shortening Revenue (USD Million) By Country (2021-2032)
Table 15 South America Margarine and Shortening Revenue (USD Million) By Country (2021-2032)
Table 16 Middle East and Africa Margarine and Shortening Revenue (USD Million) By Region (2021-2032)
Table 17 North America Margarine and Shortening Revenue (USD Million) By Type (2021-2032)
Table 18 North America Margarine and Shortening Revenue (USD Million) By Application (2021-2032)
Table 19 North America Margarine and Shortening Revenue (USD Million) By Product (2021-2032)
Table 20 Europe Margarine and Shortening Revenue (USD Million) By Type (2021-2032)
Table 21 Europe Margarine and Shortening Revenue (USD Million) By Application (2021-2032)
Table 22 Europe Margarine and Shortening Revenue (USD Million) By Product (2021-2032)
Table 23 Asia Pacific Margarine and Shortening Revenue (USD Million) By Type (2021-2032)
Table 24 Asia Pacific Margarine and Shortening Revenue (USD Million) By Application (2021-2032)
Table 25 Asia Pacific Margarine and Shortening Revenue (USD Million) By Product (2021-2032)
Table 26 South America Margarine and Shortening Revenue (USD Million) By Type (2021-2032)
Table 27 South America Margarine and Shortening Revenue (USD Million) By Application (2021-2032)
Table 28 South America Margarine and Shortening Revenue (USD Million) By Product (2021-2032)
Table 29 Middle East and Africa Margarine and Shortening Revenue (USD Million) By Type (2021-2032)
Table 30 Middle East and Africa Margarine and Shortening Revenue (USD Million) By Application (2021-2032)
Table 31 Middle East and Africa Margarine and Shortening Revenue (USD Million) By Product (2021-2032)
LIST OF FIGURES
Figure 1. Market Scope
Figure 2. Pricing Forecasts Per Unit, 2023- 2032
Figure 3. Porter’s Five Forces
Figure 4. Global Margarine and Shortening Market Revenue (USD Million) By Regions (2021-2032)
Figure 5. Global Margarine and Shortening Market Share (%) By Regions (2023)
Figure 6. North America Margarine and Shortening Revenue (USD Million) By Country (2021-2032)
Figure 7. United States Margarine and Shortening Revenue (USD Million) By Country (2021-2032)
Figure 8. Canada Margarine and Shortening Revenue (USD Million) By Country (2021-2032)
Figure 9. Mexico Margarine and Shortening Revenue (USD Million) By Country (2021-2032)
Figure 10. Europe Margarine and Shortening Revenue (USD Million) By Country (2021-2032)
Figure 11. Germany Margarine and Shortening Revenue (USD Million) By Country (2021-2032)
Figure 12. France Margarine and Shortening Revenue (USD Million) By Country (2021-2032)
Figure 13. United Kingdom Margarine and Shortening Revenue (USD Million) By Country (2021-2032)
Figure 14. Spain Margarine and Shortening Revenue (USD Million) By Country (2021-2032)
Figure 15. Italy Margarine and Shortening Revenue (USD Million) By Country (2021-2032)
Figure 16. Russia Margarine and Shortening Revenue (USD Million) By Country (2021-2032)
Figure 17. Rest of Europe Margarine and Shortening Revenue (USD Million) By Country (2021-2032)
Figure 11. Asia Pacific Margarine and Shortening Revenue (USD Million) By Country (2021-2032)
Figure 12. China Margarine and Shortening Revenue (USD Million) By Country (2021-2032)
Figure 13. Japan Margarine and Shortening Revenue (USD Million) By Country (2021-2032)
Figure 14. India Margarine and Shortening Revenue (USD Million) By Country (2021-2032)
Figure 15. South Korea Margarine and Shortening Revenue (USD Million) By Country (2021-2032)
Figure 16. Australia Margarine and Shortening Revenue (USD Million) By Country (2021-2032)
Figure 17. South East Asia Margarine and Shortening Revenue (USD Million) By Country (2021-2032)
Figure 18. South America Margarine and Shortening Revenue (USD Million) By Country (2021-2032)
Figure 19. Brazil Margarine and Shortening Revenue (USD Million) By Country (2021-2032)
Figure 20. Argentina Margarine and Shortening Revenue (USD Million) By Country (2021-2032)
Figure 21. Rest of Asia Pacific Margarine and Shortening Revenue (USD Million) By Country (2021-2032)
Figure 22. Middle East and Africa Margarine and Shortening Revenue (USD Million) By Region (2021-2032)
Figure 23. Saudi Arabia Margarine and Shortening Revenue (USD Million) By Region (2021-2032)
Figure 24. The UAE Margarine and Shortening Revenue (USD Million) By Region (2021-2032)
Figure 25. Rest of Middle East Margarine and Shortening Revenue (USD Million) By Region (2021-2032)
Figure 26. South Africa Margarine and Shortening Revenue (USD Million) By Region (2021-2032)
Figure 27. Africa Margarine and Shortening Revenue (USD Million) By Region (2021-2032)
Figure 28. North America Margarine and Shortening Revenue (USD Million) By Type (2021-2032)
Figure 29. North America Margarine and Shortening Revenue (USD Million) By Application (2021-2032)
Figure 30. North America Margarine and Shortening Revenue (USD Million) By Product (2021-2032)
Figure 31. Europe Margarine and Shortening Revenue (USD Million) By Type (2021-2032)
Figure 32. Europe Margarine and Shortening Revenue (USD Million) By Application (2021-2032)
Figure 33. Europe Margarine and Shortening Revenue (USD Million) By Product (2021-2032)
Figure 34. Asia Pacific Margarine and Shortening Revenue (USD Million) By Type (2021-2032)
Figure 35. Asia Pacific Margarine and Shortening Revenue (USD Million) By Application (2021-2032)
Figure 36. Asia Pacific Margarine and Shortening Revenue (USD Million) By Product (2021-2032)
Figure 37. South America Margarine and Shortening Revenue (USD Million) By Type (2021-2032)
Figure 38. South America Margarine and Shortening Revenue (USD Million) By Application (2021-2032)
Figure 39. South America Margarine and Shortening Revenue (USD Million) By Product (2021-2032)
Figure 40. Middle East and Africa Margarine and Shortening Revenue (USD Million) By Type (2021-2032)
Figure 41. Middle East and Africa Margarine and Shortening Revenue (USD Million) By Application (2021-2032)
Figure 42. Middle East and Africa Margarine and Shortening Revenue (USD Million) By Product (2021-2032)
By Product
Margarine
Shortening
By Source
Plant-based
Animal-based
By Form
Solid
Liquid
By Application
Baking and Pastry
Cooking and Frying
Spreads and Toppings
Industrial
By End-User
Retail
Food Service
Industrial
Countries Analyzed
North America (US, Canada, Mexico)
Europe (Germany, UK, France, Spain, Italy, Russia, Rest of Europe)
Asia Pacific (China, India, Japan, South Korea, Australia, South East Asia, Rest of Asia)
South America (Brazil, Argentina, Rest of South America)
Middle East and Africa (Saudi Arabia, UAE, Rest of Middle East, South Africa, Egypt, Rest of Africa)
