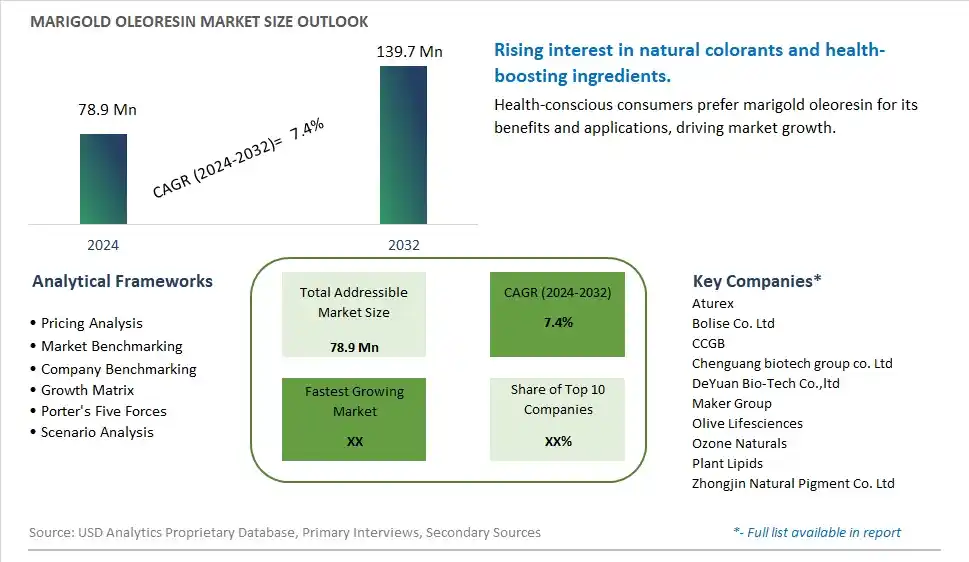
Global Marigold Oleoresin Market Size is valued at $78.9 Million in 2024 and is forecast to register a growth rate (CAGR) of 7.4% to reach $139.7 Million by 2032.
The global Marigold Oleoresin Market Comprehensive Study analyzes and forecasts the market size across 6 regions and 24 countries for diverse segments -By Type (Food Grade, Medicine Grade), By Application (Pharmaceutical, Food and Beverage, Cosmetic, Feed Industries)
An Introduction to Marigold Oleoresin Market
The marigold oleoresin market in 2024 is expanding rapidly, driven by the increasing demand for natural colorants and antioxidants in the food, pharmaceutical, and cosmetics industries. Marigold oleoresin, extracted from marigold flowers, is valued for its lutein content and vibrant yellow color. The market benefits from innovations in extraction and processing techniques that enhance the purity and efficacy of marigold oleoresin. The trend towards clean label and natural ingredients is influencing product development. Increasing consumer interest in natural health products and the popularity of plant-based colorants are further propelling market growth.
Marigold Oleoresin Competitive Landscape
The market report analyses the leading companies in the industry including Aturex, Bolise Co. Ltd, CCGB, Chenguang biotech group co. Ltd, DeYuan Bio-Tech Co.,ltd, Maker Group, Olive Lifesciences, Ozone Naturals, Plant Lipids, Zhongjin Natural Pigment Co. Ltd, and Others.
Marigold Oleoresin Market Dynamics
Marigold Oleoresin Market Trend: Rising Demand for Natural Colorants
The most prominent trend in the Marigold Oleoresin Market is the rising demand for natural colorants. Marigold oleoresin, known for its vibrant yellow to orange color, is increasingly used as a natural coloring agent in food, cosmetics, and pharmaceuticals. This trend is driven by the growing consumer preference for natural and clean label ingredients over synthetic alternatives.
Marigold Oleoresin Market Driver: Health Benefits and Nutritional Value
A key driver in the Marigold Oleoresin Market is the health benefits and nutritional value of marigold oleoresin. Rich in antioxidants, particularly lutein and zeaxanthin, marigold oleoresin is recognized for its potential to support eye health and protect against age-related macular degeneration. This awareness supports the demand for marigold oleoresin in dietary supplements and functional foods, driving market growth.
Marigold Oleoresin Market Opportunity: Expansion into Functional Food and Beverage Applications
One significant opportunity in the Marigold Oleoresin Market lies in the expansion into functional food and beverage applications. Companies can innovate by incorporating marigold oleoresin into a variety of health-focused products, such as fortified beverages, nutritional bars, and dietary supplements. By leveraging the health benefits and vibrant color of marigold oleoresin, manufacturers can attract health-conscious consumers and drive market growth.
Marigold Oleoresin Market Share Analysis: Pharmaceutical Applications is the fastest growing segment over the forecast period to 2032
Marigold oleoresin in pharmaceutical applications is poised to be the fastest growing segment within the Marigold Oleoresin Market through 2032. This growth is driven by the increasing utilization of marigold oleoresin in pharmaceutical formulations, particularly in nutraceuticals and medicinal products. Marigold oleoresin is rich in bioactive compounds like lutein and zeaxanthin, which are renowned for their antioxidant properties and benefits for eye health. As global health awareness rises and aging populations seek natural remedies for age-related macular degeneration and other eye disorders, the demand for marigold oleoresin in pharmaceuticals is expected to surge. Additionally, regulatory approvals and advancements in extraction technologies are facilitating broader applications of marigold oleoresin in pharmaceutical formulations, further driving market growth. The pharmaceutical segment's robust expansion underscores marigold oleoresin's pivotal role in supporting eye health and overall well-being, positioning it as a key ingredient in the pharmaceutical industry's quest for natural and effective solutions.
Marigold Oleoresin Market Segmentation
By Type
Food Grade
Medicine Grade
By Application
Pharmaceutical
Food and Beverage
Cosmetic
Feed Industries
Countries Analyzed
North America (US, Canada, Mexico)
Europe (Germany, UK, France, Spain, Italy, Russia, Rest of Europe)
Asia Pacific (China, India, Japan, South Korea, Australia, South East Asia, Rest of Asia)
South America (Brazil, Argentina, Rest of South America)
Middle East and Africa (Saudi Arabia, UAE, Rest of Middle East, South Africa, Egypt, Rest of Africa)
Marigold Oleoresin Companies Profiled in the Study
Aturex
Bolise Co. Ltd
CCGB
Chenguang biotech group co. Ltd
DeYuan Bio-Tech Co.,ltd
Maker Group
Olive Lifesciences
Ozone Naturals
Plant Lipids
Zhongjin Natural Pigment Co. Ltd
*- List Not Exhaustive
Chapter 1. TABLE OF CONTENTS
Chapter 2. Introduction to Marigold Oleoresin Market
2.1. Market Overview
2.2. Key Statistics and Report Highlights
2.3. Scope of the Comprehensive Study
2.3.1. Market Definition
2.3.2 Countries and Regions Covered
2.3.3 Research Objective
2.3.4 Units, Currency, and Conversions
2.3.5 Industry Value Chain
2.4. Key Market Segments
2.5. Key Companies
2.6. Study Period
Chapter 3. Strategic Analysis Review
3.1. Marigold Oleoresin Pricing Analysis and Forecast
3.2. Porter’s Five Forces
3.3. Market Ecosystem
3.4. SWOT Analysis
3.5. Regulatory Scenario
3.3. Effects of Inflation, Russia-Ukraine War, moderating economic growth, and other macroeconomic factors
Chapter 4. Competitive Landscape
4.1. Market Share Analysis
4.1.1. Global Marigold Oleoresin Market Share by Company, 2023
4.1.2. Product Offerings of Leading Marigold Oleoresin Companies
4.2. Market Entropy
4.2.1. New Product Launches in the Industry
4.2.2. Mergers, Acquisitions, Joint ventures, and Partnerships
4.3. Key Strategies and Best Practices
Chapter 5. Global Market Projections: Best, Reference, and Low Case Scenarios
5.1. Growth Analysis- Case Scenario Definitions
5.2. Low Growth Case Scenario Forecasts
5.3. Reference Growth Case Scenario Forecasts
5.4. High Growth Case Scenario Forecasts
Chapter 6. Market Dynamics
6.1. Marigold Oleoresin Market Drivers
6.2. Marigold Oleoresin Market Challenges
6.6. Marigold Oleoresin Market Opportunities
6.4. Marigold Oleoresin Market Trends
Chapter 7. Global Marigold Oleoresin Market Outlook Trends
7.1. Global Marigold Oleoresin Revenue (USD Million) and CAGR (%) by Type (2021-2032)
7.2. Global Marigold Oleoresin Revenue (USD Million) and CAGR (%) by Application (2021-2032)
7.3. Global Marigold Oleoresin Revenue (USD Million) and CAGR (%) by Product (2021-2032)
By Type
Food Grade
Medicine Grade
By Application
Pharmaceutical
Food and Beverage
Cosmetic
Feed Industries
Chapter 8. Global Marigold Oleoresin Regional Analysis and Outlook
8.1. Global Marigold Oleoresin Revenue (USD Million) By Regions (2021- 2032)
8.2. North America Marigold Oleoresin Revenue (USD Million) by Country (2021-2032)
8.2.1. United States Marigold Oleoresin Regional Analysis and Outlook
8.2.2. Canada Marigold Oleoresin Regional Analysis and Outlook
8.2.3. Mexico Marigold Oleoresin Regional Analysis and Outlook
8.3. Europe Marigold Oleoresin Revenue (USD Million), by Country (2021-2032)
8.3.1. Germany Marigold Oleoresin Regional Analysis and Outlook
8.3.2. France Marigold Oleoresin Regional Analysis and Outlook
8.3.3. United Kingdom Marigold Oleoresin Regional Analysis and Outlook
8.3.4. Spain Marigold Oleoresin Regional Analysis and Outlook
8.3.5. Italy Marigold Oleoresin Regional Analysis and Outlook
8.3.6. Russia Marigold Oleoresin Regional Analysis and Outlook
8.3.7. Rest of Europe Marigold Oleoresin Regional Analysis and Outlook
8.4. Asia Pacific Marigold Oleoresin Revenue (USD Million) by Country (2021-2032)
8.4.1. China Marigold Oleoresin Regional Analysis and Outlook
8.4.2. Japan Marigold Oleoresin Regional Analysis and Outlook
8.4.3. India Marigold Oleoresin Regional Analysis and Outlook
8.4.4. South Korea Marigold Oleoresin Regional Analysis and Outlook
8.4.5. Australia Marigold Oleoresin Regional Analysis and Outlook
8.4.6. South East Asia Marigold Oleoresin Regional Analysis and Outlook
8.4.7. Rest of Asia Pacific Marigold Oleoresin Regional Analysis and Outlook
8.5. South America Marigold Oleoresin Revenue (USD Million), by Country (2021-2032)
8.5.1. Brazil Marigold Oleoresin Regional Analysis and Outlook
8.5.2. Argentina Marigold Oleoresin Regional Analysis and Outlook
8.5.3. Rest of South America Marigold Oleoresin Regional Analysis and Outlook
8.6. Middle East and Africa Marigold Oleoresin Revenue (USD Million) by Country (2021-2032)
8.6.1. Middle East Marigold Oleoresin Regional Analysis and Outlook
8.6.2. Africa Marigold Oleoresin Regional Analysis and Outlook
Chapter 9. North America Marigold Oleoresin Analysis and Outlook
9.1. North America Marigold Oleoresin Revenue (USD Million) by Segments (2021-2032)
9.1.1. North America Marigold Oleoresin Revenue (USD Million) by Type (2021-2032)
9.1.2. North America Marigold Oleoresin Revenue (USD Million) by Application (2021-2032)
9.1.3. North America Marigold Oleoresin Revenue (USD Million) by Product (2021-2032)
By Type
Food Grade
Medicine Grade
By Application
Pharmaceutical
Food and Beverage
Cosmetic
Feed Industries
Chapter 10. Europe Marigold Oleoresin Analysis and Outlook
10.1. Europe Marigold Oleoresin Revenue (USD Million), by Segments (USD Million) (2021-2032)
10.1.1. Europe Marigold Oleoresin Revenue (USD Million) by Type (2021-2032)
10.1.2. Europe Marigold Oleoresin Revenue (USD Million) by Application (2021-2032)
10.1.3. Europe Marigold Oleoresin Revenue (USD Million) by Product (2021-2032)
By Type
Food Grade
Medicine Grade
By Application
Pharmaceutical
Food and Beverage
Cosmetic
Feed Industries
Chapter 11. Asia Pacific Marigold Oleoresin Analysis and Outlook
11.1. Asia Pacific Marigold Oleoresin Revenue (USD Million), and Revenue (USD Million) by Segments (2021-2032)
11.1.1. Asia Pacific Marigold Oleoresin Revenue (USD Million) by Type (2021-2032)
11.1.2. Asia Pacific Marigold Oleoresin Revenue (USD Million) by Application (2021-2032)
11.1.3. Asia Pacific Marigold Oleoresin Revenue (USD Million) by Product (2021-2032)
By Type
Food Grade
Medicine Grade
By Application
Pharmaceutical
Food and Beverage
Cosmetic
Feed Industries
Chapter 12. South America Marigold Oleoresin Analysis and Outlook
12.1. South America Marigold Oleoresin Revenue (USD Million), by Segments (2021-2032)
12.1.1. South America Marigold Oleoresin Revenue (USD Million) by Type (2021-2032)
12.1.2. South America Marigold Oleoresin Revenue (USD Million) by Application (2021-2032)
12.1.3. South America Marigold Oleoresin Revenue (USD Million) by Product (2021-2032)
By Type
Food Grade
Medicine Grade
By Application
Pharmaceutical
Food and Beverage
Cosmetic
Feed Industries
Chapter 13. Middle East and Africa Marigold Oleoresin Analysis and Outlook
13.1. Middle East and Africa Marigold Oleoresin Revenue (USD Million), by Segments (2021-2032)
13.1.1. Middle East and Africa Marigold Oleoresin Revenue (USD Million) by Type (2021-2032)
13.1.2. Middle East and Africa Marigold Oleoresin Revenue (USD Million) by Application (2021-2032)
13.1.3. Middle East and Africa Marigold Oleoresin Revenue (USD Million) by Product (2021-2032)
By Type
Food Grade
Medicine Grade
By Application
Pharmaceutical
Food and Beverage
Cosmetic
Feed Industries
Chapter 14. Marigold Oleoresin Company Profiles
14.1 Business Overview
14.2 Product Profiles
14.3 SWOT Profiles
14.5 Recent Developments
14.6 Financial Profile
List of Companies
Aturex
Bolise Co. Ltd
CCGB
Chenguang biotech group co. Ltd
DeYuan Bio-Tech Co.,ltd
Maker Group
Olive Lifesciences
Ozone Naturals
Plant Lipids
Zhongjin Natural Pigment Co. Ltd
15. Methodology and Data Sources
15.1 Customization Offerings
15.2 Subscription Services
15.3 Related Reports
15.4 Publisher Expertise
LIST OF TABLES
Table 1 Market Segmentation Analysis
Table 2 Global Marigold Oleoresin Market Share of Leading Companies, 2023
Table 3 Product Offerings of Leading Companies
Table 4 Low Growth Scenario Forecasts
Table 5 Reference Case Growth Scenario
Table 6 High Growth Case Scenario
Table 7 Global Marigold Oleoresin Revenue (USD Million) And CAGR (%) By Type (2021-2032)
Table 8 Global Marigold Oleoresin Revenue (USD Million) And CAGR (%) By Application (2021-2032)
Table 9 Global Marigold Oleoresin Revenue (USD Million) And CAGR (%) By Product (2021-2032)
Table 10 Global Marigold Oleoresin Market Revenue (USD Million) By Regions (2021-2032)
Table 11 Global Marigold Oleoresin Market Share (%) By Regions (2021-2032)
Table 12 North America Marigold Oleoresin Revenue (USD Million) By Country (2021-2032)
Table 13 Europe Marigold Oleoresin Revenue (USD Million) By Country (2021-2032)
Table 14 Asia Pacific Marigold Oleoresin Revenue (USD Million) By Country (2021-2032)
Table 15 South America Marigold Oleoresin Revenue (USD Million) By Country (2021-2032)
Table 16 Middle East and Africa Marigold Oleoresin Revenue (USD Million) By Region (2021-2032)
Table 17 North America Marigold Oleoresin Revenue (USD Million) By Type (2021-2032)
Table 18 North America Marigold Oleoresin Revenue (USD Million) By Application (2021-2032)
Table 19 North America Marigold Oleoresin Revenue (USD Million) By Product (2021-2032)
Table 20 Europe Marigold Oleoresin Revenue (USD Million) By Type (2021-2032)
Table 21 Europe Marigold Oleoresin Revenue (USD Million) By Application (2021-2032)
Table 22 Europe Marigold Oleoresin Revenue (USD Million) By Product (2021-2032)
Table 23 Asia Pacific Marigold Oleoresin Revenue (USD Million) By Type (2021-2032)
Table 24 Asia Pacific Marigold Oleoresin Revenue (USD Million) By Application (2021-2032)
Table 25 Asia Pacific Marigold Oleoresin Revenue (USD Million) By Product (2021-2032)
Table 26 South America Marigold Oleoresin Revenue (USD Million) By Type (2021-2032)
Table 27 South America Marigold Oleoresin Revenue (USD Million) By Application (2021-2032)
Table 28 South America Marigold Oleoresin Revenue (USD Million) By Product (2021-2032)
Table 29 Middle East and Africa Marigold Oleoresin Revenue (USD Million) By Type (2021-2032)
Table 30 Middle East and Africa Marigold Oleoresin Revenue (USD Million) By Application (2021-2032)
Table 31 Middle East and Africa Marigold Oleoresin Revenue (USD Million) By Product (2021-2032)
LIST OF FIGURES
Figure 1. Market Scope
Figure 2. Pricing Forecasts Per Unit, 2023- 2032
Figure 3. Porter’s Five Forces
Figure 4. Global Marigold Oleoresin Market Revenue (USD Million) By Regions (2021-2032)
Figure 5. Global Marigold Oleoresin Market Share (%) By Regions (2023)
Figure 6. North America Marigold Oleoresin Revenue (USD Million) By Country (2021-2032)
Figure 7. United States Marigold Oleoresin Revenue (USD Million) By Country (2021-2032)
Figure 8. Canada Marigold Oleoresin Revenue (USD Million) By Country (2021-2032)
Figure 9. Mexico Marigold Oleoresin Revenue (USD Million) By Country (2021-2032)
Figure 10. Europe Marigold Oleoresin Revenue (USD Million) By Country (2021-2032)
Figure 11. Germany Marigold Oleoresin Revenue (USD Million) By Country (2021-2032)
Figure 12. France Marigold Oleoresin Revenue (USD Million) By Country (2021-2032)
Figure 13. United Kingdom Marigold Oleoresin Revenue (USD Million) By Country (2021-2032)
Figure 14. Spain Marigold Oleoresin Revenue (USD Million) By Country (2021-2032)
Figure 15. Italy Marigold Oleoresin Revenue (USD Million) By Country (2021-2032)
Figure 16. Russia Marigold Oleoresin Revenue (USD Million) By Country (2021-2032)
Figure 17. Rest of Europe Marigold Oleoresin Revenue (USD Million) By Country (2021-2032)
Figure 11. Asia Pacific Marigold Oleoresin Revenue (USD Million) By Country (2021-2032)
Figure 12. China Marigold Oleoresin Revenue (USD Million) By Country (2021-2032)
Figure 13. Japan Marigold Oleoresin Revenue (USD Million) By Country (2021-2032)
Figure 14. India Marigold Oleoresin Revenue (USD Million) By Country (2021-2032)
Figure 15. South Korea Marigold Oleoresin Revenue (USD Million) By Country (2021-2032)
Figure 16. Australia Marigold Oleoresin Revenue (USD Million) By Country (2021-2032)
Figure 17. South East Asia Marigold Oleoresin Revenue (USD Million) By Country (2021-2032)
Figure 18. South America Marigold Oleoresin Revenue (USD Million) By Country (2021-2032)
Figure 19. Brazil Marigold Oleoresin Revenue (USD Million) By Country (2021-2032)
Figure 20. Argentina Marigold Oleoresin Revenue (USD Million) By Country (2021-2032)
Figure 21. Rest of Asia Pacific Marigold Oleoresin Revenue (USD Million) By Country (2021-2032)
Figure 22. Middle East and Africa Marigold Oleoresin Revenue (USD Million) By Region (2021-2032)
Figure 23. Saudi Arabia Marigold Oleoresin Revenue (USD Million) By Region (2021-2032)
Figure 24. The UAE Marigold Oleoresin Revenue (USD Million) By Region (2021-2032)
Figure 25. Rest of Middle East Marigold Oleoresin Revenue (USD Million) By Region (2021-2032)
Figure 26. South Africa Marigold Oleoresin Revenue (USD Million) By Region (2021-2032)
Figure 27. Africa Marigold Oleoresin Revenue (USD Million) By Region (2021-2032)
Figure 28. North America Marigold Oleoresin Revenue (USD Million) By Type (2021-2032)
Figure 29. North America Marigold Oleoresin Revenue (USD Million) By Application (2021-2032)
Figure 30. North America Marigold Oleoresin Revenue (USD Million) By Product (2021-2032)
Figure 31. Europe Marigold Oleoresin Revenue (USD Million) By Type (2021-2032)
Figure 32. Europe Marigold Oleoresin Revenue (USD Million) By Application (2021-2032)
Figure 33. Europe Marigold Oleoresin Revenue (USD Million) By Product (2021-2032)
Figure 34. Asia Pacific Marigold Oleoresin Revenue (USD Million) By Type (2021-2032)
Figure 35. Asia Pacific Marigold Oleoresin Revenue (USD Million) By Application (2021-2032)
Figure 36. Asia Pacific Marigold Oleoresin Revenue (USD Million) By Product (2021-2032)
Figure 37. South America Marigold Oleoresin Revenue (USD Million) By Type (2021-2032)
Figure 38. South America Marigold Oleoresin Revenue (USD Million) By Application (2021-2032)
Figure 39. South America Marigold Oleoresin Revenue (USD Million) By Product (2021-2032)
Figure 40. Middle East and Africa Marigold Oleoresin Revenue (USD Million) By Type (2021-2032)
Figure 41. Middle East and Africa Marigold Oleoresin Revenue (USD Million) By Application (2021-2032)
Figure 42. Middle East and Africa Marigold Oleoresin Revenue (USD Million) By Product (2021-2032)
By Type
Food Grade
Medicine Grade
By Application
Pharmaceutical
Food and Beverage
Cosmetic
Feed Industries
Countries Analyzed
North America (US, Canada, Mexico)
Europe (Germany, UK, France, Spain, Italy, Russia, Rest of Europe)
Asia Pacific (China, India, Japan, South Korea, Australia, South East Asia, Rest of Asia)
South America (Brazil, Argentina, Rest of South America)
Middle East and Africa (Saudi Arabia, UAE, Rest of Middle East, South Africa, Egypt, Rest of Africa)
