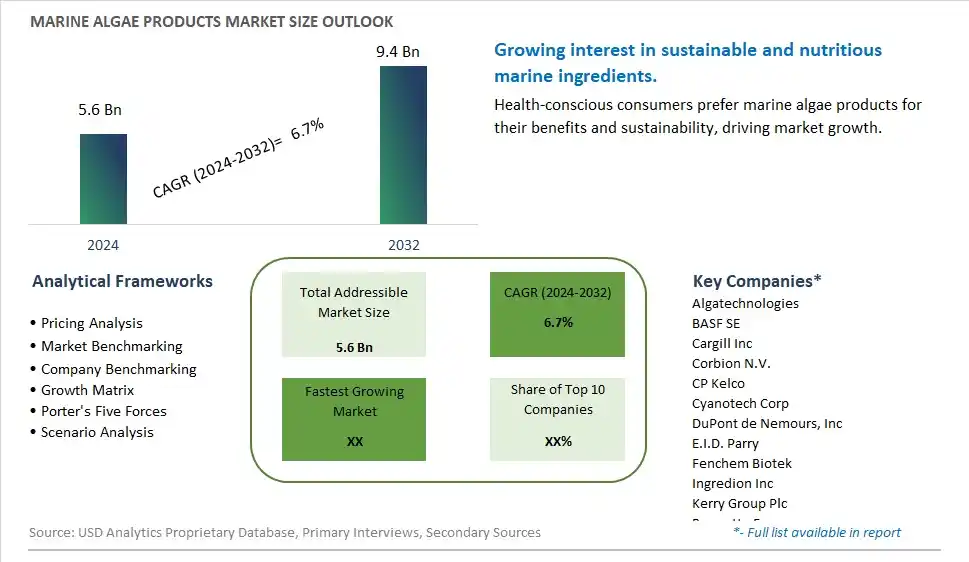
Global Marine Algae Products Market Size is valued at $5.6 Billion in 2024 and is forecast to register a growth rate (CAGR) of 6.7% to reach $9.4 Billion by 2032.
The global Marine Algae Products Market Comprehensive Study analyzes and forecasts the market size across 6 regions and 24 countries for diverse segments -By Type (Lipids, Carrageenan, Carotenoids, Algal protein, Alginate, Others), By Application (Food & Beverages, Nutraceuticals & Dietary Supplements, Feed, Personal Care Products, Pharmaceuticals, Others)
An Introduction to Marine Algae Products Market
The marine algae products market in 2024 is expanding rapidly, driven by the rising demand for sustainable and nutritious ingredients in food, cosmetics, and nutraceuticals. Marine algae, including seaweed and microalgae, are valued for their high content of vitamins, minerals, and bioactive compounds. The market benefits from innovations in algae cultivation and processing that enhance product quality and functionality. The trend towards clean label, natural, and sustainable ingredients is influencing market dynamics. Increasing consumer awareness of the health benefits of marine algae and the popularity of plant-based and functional foods are further propelling market growth.
Marine Algae Products Competitive Landscape
The market report analyses the leading companies in the industry including Algatechnologies, BASF SE, Cargill Inc, Corbion N.V., CP Kelco, Cyanotech Corp, DuPont de Nemours, Inc, E.I.D. Parry, Fenchem Biotek, Ingredion Inc, Kerry Group Plc, Roquette Freres, and Others.
Marine Algae Products Market Dynamics
Marine Algae Products Market Trend: Growing Interest in Sustainable and Plant-Based Ingredients
The most prominent trend in the Marine Algae Products Market is the growing interest in sustainable and plant-based ingredients. Marine algae, known for their nutritional and environmental benefits, are increasingly used in a variety of products, including food, supplements, and cosmetics. This trend is driven by the demand for sustainable and eco-friendly ingredients that support health and wellness.
Marine Algae Products Market Driver: Nutritional Benefits and Functional Properties
A key driver in the Marine Algae Products Market is the nutritional benefits and functional properties of marine algae. Rich in essential nutrients, such as omega-3 fatty acids, vitamins, and minerals, marine algae are valued for their potential to support overall health and well-being. This awareness supports the demand for marine algae products in dietary supplements, functional foods, and personal care products, driving market growth.
Marine Algae Products Market Opportunity: Expansion into Innovative Applications
One significant opportunity in the Marine Algae Products Market lies in the expansion into innovative applications. Companies can explore incorporating marine algae into a variety of products, such as plant-based meats, biofuels, and biodegradable plastics. By leveraging the versatility and sustainability of marine algae, manufacturers can attract environmentally conscious consumers and drive market growth.
Marine Algae Products Market Share Analysis: Algal Protein segment generated the highest revenue share in the industry
Algal protein stands out as the largest segment within the Marine Algae Products Market. This prominence is driven by the increasing adoption of plant-based protein sources in various industries, including food, beverages, and dietary supplements. Algal protein offers a sustainable alternative to animal-derived proteins, catering to the rising demand for vegan and vegetarian products. It is rich in essential amino acids, making it a valuable nutritional supplement and ingredient in functional foods. The versatility of algal protein allows its incorporation into a wide array of products, from protein bars to plant-based meat substitutes, appealing to health-conscious consumers seeking sustainable protein options. As dietary trends favor plant-based diets and sustainability becomes a priority for consumers and manufacturers alike, algal protein continues to dominate the marine algae products market.
Marine Algae Products Market Share Analysis: Nutraceuticals & Dietary Supplements is the fastest growing segment over the forecast period to 2032
Marine algae products in nutraceuticals and dietary supplements are projected to be the fastest growing segment in the Marine Algae Products Market by 2032. This growth is propelled by the increasing recognition of algae-derived compounds such as omega-3 fatty acids, carotenoids, and antioxidants for their health benefits. Nutraceuticals and dietary supplements formulated with marine algae are gaining popularity due to their potential to support cardiovascular health, cognitive function, and overall well-being. The natural origin and bioactive properties of marine algae products appeal to consumers seeking natural and effective alternatives to synthetic supplements. Further, advancements in extraction technologies and research into novel bioactives from marine algae are expanding the application possibilities in the nutraceutical sector, driving growth opportunities in this segment.
Marine Algae Products Market Segmentation
By Type
Lipids
Carrageenan
Carotenoids
Algal protein
Alginate
Others
By Application
Food & Beverages
Nutraceuticals & Dietary Supplements
Feed
Personal Care Products
Pharmaceuticals
Others
Countries Analyzed
North America (US, Canada, Mexico)
Europe (Germany, UK, France, Spain, Italy, Russia, Rest of Europe)
Asia Pacific (China, India, Japan, South Korea, Australia, South East Asia, Rest of Asia)
South America (Brazil, Argentina, Rest of South America)
Middle East and Africa (Saudi Arabia, UAE, Rest of Middle East, South Africa, Egypt, Rest of Africa)
Marine Algae Products Companies Profiled in the Study
Algatechnologies
BASF SE
Cargill Inc
Corbion N.V.
CP Kelco
Cyanotech Corp
DuPont de Nemours, Inc
E.I.D. Parry
Fenchem Biotek
Ingredion Inc
Kerry Group Plc
Roquette Freres
*- List Not Exhaustive
Chapter 1. TABLE OF CONTENTS
Chapter 2. Introduction to Marine Algae Products Market
2.1. Market Overview
2.2. Key Statistics and Report Highlights
2.3. Scope of the Comprehensive Study
2.3.1. Market Definition
2.3.2 Countries and Regions Covered
2.3.3 Research Objective
2.3.4 Units, Currency, and Conversions
2.3.5 Industry Value Chain
2.4. Key Market Segments
2.5. Key Companies
2.6. Study Period
Chapter 3. Strategic Analysis Review
3.1. Marine Algae Products Pricing Analysis and Forecast
3.2. Porter’s Five Forces
3.3. Market Ecosystem
3.4. SWOT Analysis
3.5. Regulatory Scenario
3.3. Effects of Inflation, Russia-Ukraine War, moderating economic growth, and other macroeconomic factors
Chapter 4. Competitive Landscape
4.1. Market Share Analysis
4.1.1. Global Marine Algae Products Market Share by Company, 2023
4.1.2. Product Offerings of Leading Marine Algae Products Companies
4.2. Market Entropy
4.2.1. New Product Launches in the Industry
4.2.2. Mergers, Acquisitions, Joint ventures, and Partnerships
4.3. Key Strategies and Best Practices
Chapter 5. Global Market Projections: Best, Reference, and Low Case Scenarios
5.1. Growth Analysis- Case Scenario Definitions
5.2. Low Growth Case Scenario Forecasts
5.3. Reference Growth Case Scenario Forecasts
5.4. High Growth Case Scenario Forecasts
Chapter 6. Market Dynamics
6.1. Marine Algae Products Market Drivers
6.2. Marine Algae Products Market Challenges
6.6. Marine Algae Products Market Opportunities
6.4. Marine Algae Products Market Trends
Chapter 7. Global Marine Algae Products Market Outlook Trends
7.1. Global Marine Algae Products Revenue (USD Million) and CAGR (%) by Type (2021-2032)
7.2. Global Marine Algae Products Revenue (USD Million) and CAGR (%) by Application (2021-2032)
7.3. Global Marine Algae Products Revenue (USD Million) and CAGR (%) by Product (2021-2032)
By Type
Lipids
Carrageenan
Carotenoids
Algal protein
Alginate
Others
By Application
Food & Beverages
Nutraceuticals & Dietary Supplements
Feed
Personal Care Products
Pharmaceuticals
Others
Chapter 8. Global Marine Algae Products Regional Analysis and Outlook
8.1. Global Marine Algae Products Revenue (USD Million) By Regions (2021- 2032)
8.2. North America Marine Algae Products Revenue (USD Million) by Country (2021-2032)
8.2.1. United States Marine Algae Products Regional Analysis and Outlook
8.2.2. Canada Marine Algae Products Regional Analysis and Outlook
8.2.3. Mexico Marine Algae Products Regional Analysis and Outlook
8.3. Europe Marine Algae Products Revenue (USD Million), by Country (2021-2032)
8.3.1. Germany Marine Algae Products Regional Analysis and Outlook
8.3.2. France Marine Algae Products Regional Analysis and Outlook
8.3.3. United Kingdom Marine Algae Products Regional Analysis and Outlook
8.3.4. Spain Marine Algae Products Regional Analysis and Outlook
8.3.5. Italy Marine Algae Products Regional Analysis and Outlook
8.3.6. Russia Marine Algae Products Regional Analysis and Outlook
8.3.7. Rest of Europe Marine Algae Products Regional Analysis and Outlook
8.4. Asia Pacific Marine Algae Products Revenue (USD Million) by Country (2021-2032)
8.4.1. China Marine Algae Products Regional Analysis and Outlook
8.4.2. Japan Marine Algae Products Regional Analysis and Outlook
8.4.3. India Marine Algae Products Regional Analysis and Outlook
8.4.4. South Korea Marine Algae Products Regional Analysis and Outlook
8.4.5. Australia Marine Algae Products Regional Analysis and Outlook
8.4.6. South East Asia Marine Algae Products Regional Analysis and Outlook
8.4.7. Rest of Asia Pacific Marine Algae Products Regional Analysis and Outlook
8.5. South America Marine Algae Products Revenue (USD Million), by Country (2021-2032)
8.5.1. Brazil Marine Algae Products Regional Analysis and Outlook
8.5.2. Argentina Marine Algae Products Regional Analysis and Outlook
8.5.3. Rest of South America Marine Algae Products Regional Analysis and Outlook
8.6. Middle East and Africa Marine Algae Products Revenue (USD Million) by Country (2021-2032)
8.6.1. Middle East Marine Algae Products Regional Analysis and Outlook
8.6.2. Africa Marine Algae Products Regional Analysis and Outlook
Chapter 9. North America Marine Algae Products Analysis and Outlook
9.1. North America Marine Algae Products Revenue (USD Million) by Segments (2021-2032)
9.1.1. North America Marine Algae Products Revenue (USD Million) by Type (2021-2032)
9.1.2. North America Marine Algae Products Revenue (USD Million) by Application (2021-2032)
9.1.3. North America Marine Algae Products Revenue (USD Million) by Product (2021-2032)
By Type
Lipids
Carrageenan
Carotenoids
Algal protein
Alginate
Others
By Application
Food & Beverages
Nutraceuticals & Dietary Supplements
Feed
Personal Care Products
Pharmaceuticals
Others
Chapter 10. Europe Marine Algae Products Analysis and Outlook
10.1. Europe Marine Algae Products Revenue (USD Million), by Segments (USD Million) (2021-2032)
10.1.1. Europe Marine Algae Products Revenue (USD Million) by Type (2021-2032)
10.1.2. Europe Marine Algae Products Revenue (USD Million) by Application (2021-2032)
10.1.3. Europe Marine Algae Products Revenue (USD Million) by Product (2021-2032)
By Type
Lipids
Carrageenan
Carotenoids
Algal protein
Alginate
Others
By Application
Food & Beverages
Nutraceuticals & Dietary Supplements
Feed
Personal Care Products
Pharmaceuticals
Others
Chapter 11. Asia Pacific Marine Algae Products Analysis and Outlook
11.1. Asia Pacific Marine Algae Products Revenue (USD Million), and Revenue (USD Million) by Segments (2021-2032)
11.1.1. Asia Pacific Marine Algae Products Revenue (USD Million) by Type (2021-2032)
11.1.2. Asia Pacific Marine Algae Products Revenue (USD Million) by Application (2021-2032)
11.1.3. Asia Pacific Marine Algae Products Revenue (USD Million) by Product (2021-2032)
By Type
Lipids
Carrageenan
Carotenoids
Algal protein
Alginate
Others
By Application
Food & Beverages
Nutraceuticals & Dietary Supplements
Feed
Personal Care Products
Pharmaceuticals
Others
Chapter 12. South America Marine Algae Products Analysis and Outlook
12.1. South America Marine Algae Products Revenue (USD Million), by Segments (2021-2032)
12.1.1. South America Marine Algae Products Revenue (USD Million) by Type (2021-2032)
12.1.2. South America Marine Algae Products Revenue (USD Million) by Application (2021-2032)
12.1.3. South America Marine Algae Products Revenue (USD Million) by Product (2021-2032)
By Type
Lipids
Carrageenan
Carotenoids
Algal protein
Alginate
Others
By Application
Food & Beverages
Nutraceuticals & Dietary Supplements
Feed
Personal Care Products
Pharmaceuticals
Others
Chapter 13. Middle East and Africa Marine Algae Products Analysis and Outlook
13.1. Middle East and Africa Marine Algae Products Revenue (USD Million), by Segments (2021-2032)
13.1.1. Middle East and Africa Marine Algae Products Revenue (USD Million) by Type (2021-2032)
13.1.2. Middle East and Africa Marine Algae Products Revenue (USD Million) by Application (2021-2032)
13.1.3. Middle East and Africa Marine Algae Products Revenue (USD Million) by Product (2021-2032)
By Type
Lipids
Carrageenan
Carotenoids
Algal protein
Alginate
Others
By Application
Food & Beverages
Nutraceuticals & Dietary Supplements
Feed
Personal Care Products
Pharmaceuticals
Others
Chapter 14. Marine Algae Products Company Profiles
14.1 Business Overview
14.2 Product Profiles
14.3 SWOT Profiles
14.5 Recent Developments
14.6 Financial Profile
List of Companies
Algatechnologies
BASF SE
Cargill Inc
Corbion N.V.
CP Kelco
Cyanotech Corp
DuPont de Nemours, Inc
E.I.D. Parry
Fenchem Biotek
Ingredion Inc
Kerry Group Plc
Roquette Freres
15. Methodology and Data Sources
15.1 Customization Offerings
15.2 Subscription Services
15.3 Related Reports
15.4 Publisher Expertise
LIST OF TABLES
Table 1 Market Segmentation Analysis
Table 2 Global Marine Algae Products Market Share of Leading Companies, 2023
Table 3 Product Offerings of Leading Companies
Table 4 Low Growth Scenario Forecasts
Table 5 Reference Case Growth Scenario
Table 6 High Growth Case Scenario
Table 7 Global Marine Algae Products Revenue (USD Million) And CAGR (%) By Type (2021-2032)
Table 8 Global Marine Algae Products Revenue (USD Million) And CAGR (%) By Application (2021-2032)
Table 9 Global Marine Algae Products Revenue (USD Million) And CAGR (%) By Product (2021-2032)
Table 10 Global Marine Algae Products Market Revenue (USD Million) By Regions (2021-2032)
Table 11 Global Marine Algae Products Market Share (%) By Regions (2021-2032)
Table 12 North America Marine Algae Products Revenue (USD Million) By Country (2021-2032)
Table 13 Europe Marine Algae Products Revenue (USD Million) By Country (2021-2032)
Table 14 Asia Pacific Marine Algae Products Revenue (USD Million) By Country (2021-2032)
Table 15 South America Marine Algae Products Revenue (USD Million) By Country (2021-2032)
Table 16 Middle East and Africa Marine Algae Products Revenue (USD Million) By Region (2021-2032)
Table 17 North America Marine Algae Products Revenue (USD Million) By Type (2021-2032)
Table 18 North America Marine Algae Products Revenue (USD Million) By Application (2021-2032)
Table 19 North America Marine Algae Products Revenue (USD Million) By Product (2021-2032)
Table 20 Europe Marine Algae Products Revenue (USD Million) By Type (2021-2032)
Table 21 Europe Marine Algae Products Revenue (USD Million) By Application (2021-2032)
Table 22 Europe Marine Algae Products Revenue (USD Million) By Product (2021-2032)
Table 23 Asia Pacific Marine Algae Products Revenue (USD Million) By Type (2021-2032)
Table 24 Asia Pacific Marine Algae Products Revenue (USD Million) By Application (2021-2032)
Table 25 Asia Pacific Marine Algae Products Revenue (USD Million) By Product (2021-2032)
Table 26 South America Marine Algae Products Revenue (USD Million) By Type (2021-2032)
Table 27 South America Marine Algae Products Revenue (USD Million) By Application (2021-2032)
Table 28 South America Marine Algae Products Revenue (USD Million) By Product (2021-2032)
Table 29 Middle East and Africa Marine Algae Products Revenue (USD Million) By Type (2021-2032)
Table 30 Middle East and Africa Marine Algae Products Revenue (USD Million) By Application (2021-2032)
Table 31 Middle East and Africa Marine Algae Products Revenue (USD Million) By Product (2021-2032)
LIST OF FIGURES
Figure 1. Market Scope
Figure 2. Pricing Forecasts Per Unit, 2023- 2032
Figure 3. Porter’s Five Forces
Figure 4. Global Marine Algae Products Market Revenue (USD Million) By Regions (2021-2032)
Figure 5. Global Marine Algae Products Market Share (%) By Regions (2023)
Figure 6. North America Marine Algae Products Revenue (USD Million) By Country (2021-2032)
Figure 7. United States Marine Algae Products Revenue (USD Million) By Country (2021-2032)
Figure 8. Canada Marine Algae Products Revenue (USD Million) By Country (2021-2032)
Figure 9. Mexico Marine Algae Products Revenue (USD Million) By Country (2021-2032)
Figure 10. Europe Marine Algae Products Revenue (USD Million) By Country (2021-2032)
Figure 11. Germany Marine Algae Products Revenue (USD Million) By Country (2021-2032)
Figure 12. France Marine Algae Products Revenue (USD Million) By Country (2021-2032)
Figure 13. United Kingdom Marine Algae Products Revenue (USD Million) By Country (2021-2032)
Figure 14. Spain Marine Algae Products Revenue (USD Million) By Country (2021-2032)
Figure 15. Italy Marine Algae Products Revenue (USD Million) By Country (2021-2032)
Figure 16. Russia Marine Algae Products Revenue (USD Million) By Country (2021-2032)
Figure 17. Rest of Europe Marine Algae Products Revenue (USD Million) By Country (2021-2032)
Figure 11. Asia Pacific Marine Algae Products Revenue (USD Million) By Country (2021-2032)
Figure 12. China Marine Algae Products Revenue (USD Million) By Country (2021-2032)
Figure 13. Japan Marine Algae Products Revenue (USD Million) By Country (2021-2032)
Figure 14. India Marine Algae Products Revenue (USD Million) By Country (2021-2032)
Figure 15. South Korea Marine Algae Products Revenue (USD Million) By Country (2021-2032)
Figure 16. Australia Marine Algae Products Revenue (USD Million) By Country (2021-2032)
Figure 17. South East Asia Marine Algae Products Revenue (USD Million) By Country (2021-2032)
Figure 18. South America Marine Algae Products Revenue (USD Million) By Country (2021-2032)
Figure 19. Brazil Marine Algae Products Revenue (USD Million) By Country (2021-2032)
Figure 20. Argentina Marine Algae Products Revenue (USD Million) By Country (2021-2032)
Figure 21. Rest of Asia Pacific Marine Algae Products Revenue (USD Million) By Country (2021-2032)
Figure 22. Middle East and Africa Marine Algae Products Revenue (USD Million) By Region (2021-2032)
Figure 23. Saudi Arabia Marine Algae Products Revenue (USD Million) By Region (2021-2032)
Figure 24. The UAE Marine Algae Products Revenue (USD Million) By Region (2021-2032)
Figure 25. Rest of Middle East Marine Algae Products Revenue (USD Million) By Region (2021-2032)
Figure 26. South Africa Marine Algae Products Revenue (USD Million) By Region (2021-2032)
Figure 27. Africa Marine Algae Products Revenue (USD Million) By Region (2021-2032)
Figure 28. North America Marine Algae Products Revenue (USD Million) By Type (2021-2032)
Figure 29. North America Marine Algae Products Revenue (USD Million) By Application (2021-2032)
Figure 30. North America Marine Algae Products Revenue (USD Million) By Product (2021-2032)
Figure 31. Europe Marine Algae Products Revenue (USD Million) By Type (2021-2032)
Figure 32. Europe Marine Algae Products Revenue (USD Million) By Application (2021-2032)
Figure 33. Europe Marine Algae Products Revenue (USD Million) By Product (2021-2032)
Figure 34. Asia Pacific Marine Algae Products Revenue (USD Million) By Type (2021-2032)
Figure 35. Asia Pacific Marine Algae Products Revenue (USD Million) By Application (2021-2032)
Figure 36. Asia Pacific Marine Algae Products Revenue (USD Million) By Product (2021-2032)
Figure 37. South America Marine Algae Products Revenue (USD Million) By Type (2021-2032)
Figure 38. South America Marine Algae Products Revenue (USD Million) By Application (2021-2032)
Figure 39. South America Marine Algae Products Revenue (USD Million) By Product (2021-2032)
Figure 40. Middle East and Africa Marine Algae Products Revenue (USD Million) By Type (2021-2032)
Figure 41. Middle East and Africa Marine Algae Products Revenue (USD Million) By Application (2021-2032)
Figure 42. Middle East and Africa Marine Algae Products Revenue (USD Million) By Product (2021-2032)
By Type
Lipids
Carrageenan
Carotenoids
Algal protein
Alginate
Others
By Application
Food & Beverages
Nutraceuticals & Dietary Supplements
Feed
Personal Care Products
Pharmaceuticals
Others
Countries Analyzed
North America (US, Canada, Mexico)
Europe (Germany, UK, France, Spain, Italy, Russia, Rest of Europe)
Asia Pacific (China, India, Japan, South Korea, Australia, South East Asia, Rest of Asia)
South America (Brazil, Argentina, Rest of South America)
Middle East and Africa (Saudi Arabia, UAE, Rest of Middle East, South Africa, Egypt, Rest of Africa)
