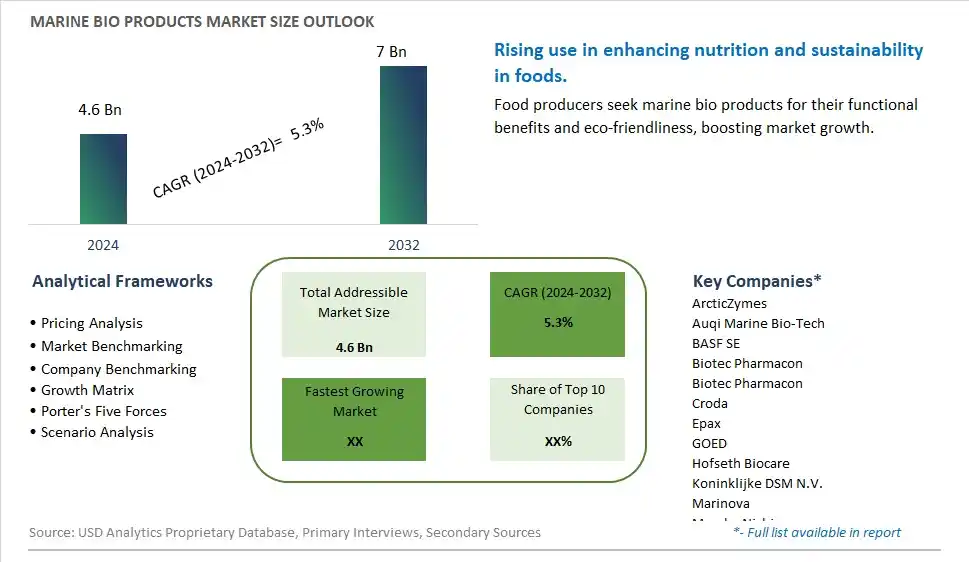
Global Marine Bio Products Market Size is valued at $4.6 Billion in 2024 and is forecast to register a growth rate (CAGR) of 5.3% to reach $7 Billion by 2032.
The global Marine Bio Products Market Comprehensive Study analyzes and forecasts the market size across 6 regions and 24 countries for diverse segments -By Product (Proteins, Enzymes, Oils, Peptides, Polysaccharide, Others), By Application (Nutrition Supplements, Pharmaceuticals, Personal Care & Cosmetics, Food Ingredients, Agricultural Products, Others)
An Introduction to Marine Bio Products Market
In 2024, the marine bio products market is thriving, fueled by the demand for innovative and sustainable ingredients derived from marine sources. Marine bio products, including bioactive compounds, enzymes, and polysaccharides, are used in various applications such as food, pharmaceuticals, and cosmetics. The market benefits from advancements in marine biotechnology and extraction techniques that enhance the quality and efficacy of marine bio products. The trend towards natural and sustainable ingredients is influencing product development. Increasing consumer interest in marine-based health products and the popularity of functional foods and nutraceuticals are further supporting market growth.
Marine Bio Products Competitive Landscape
The market report analyses the leading companies in the industry including ArcticZymes, Auqi Marine Bio-Tech, BASF SE, Biotec Pharmacon, Biotec Pharmacon, Croda, Epax, GOED, Hofseth Biocare, Koninklijke DSM N.V., Marinova, Maruha Nichiro, Sinomega Biotech, and Others.
Marine Bio Products Market Dynamics
Marine Bio Products Market Trend: Increasing Use of Marine-Derived Ingredients
The most prominent trend in the Marine Bio Products Market is the increasing use of marine-derived ingredients. Marine bio products, sourced from seaweed, algae, and marine microorganisms, are gaining popularity for their potential health benefits and applications in various industries, including food, pharmaceuticals, and cosmetics. This trend is driven by the demand for natural and sustainable ingredients that offer unique properties.
Marine Bio Products Market Driver: Rising Awareness of Environmental Sustainability
A key driver in the Marine Bio Products Market is the rising awareness of environmental sustainability. As consumers and industries seek to reduce their environmental impact, there is a growing preference for products that are sustainably sourced and eco-friendly. Marine bio products, which offer renewable and low-impact alternatives to traditional ingredients, cater to this demand and support market growth.
Marine Bio Products Market Opportunity: Innovation in High-Value Bioactive Compounds
One significant opportunity in the Marine Bio Products Market lies in innovation in high-value bioactive compounds. Companies can develop new marine bio products that harness the bioactive compounds found in marine organisms, such as antioxidants, anti-inflammatory agents, and antimicrobial peptides. By offering products that provide significant health and functional benefits, manufacturers can attract health-conscious consumers and drive market growth.
Marine Bio Products Market Share Analysis: Proteins segment generated the highest revenue share in the industry
Proteins emerge as the largest segment within the Marine Bio Products Market. This dominance is driven by the versatile applications of marine-derived proteins across various industries, including food, pharmaceuticals, cosmetics, and agriculture. Marine proteins are valued for their high nutritional content, bioactive properties, and sustainable sourcing from marine organisms. They are utilized in nutrition supplements, functional foods, and animal feed formulations due to their health benefits and amino acid profile. The growing demand for protein-rich diets, coupled with advancements in extraction technologies, continues to bolster the prominence of marine proteins in the global market. Their role in promoting health and wellness, combined with their environmental sustainability, positions marine proteins as key ingredients driving market growth.
Marine Bio Products Market Share Analysis: Personal Care & Cosmetics is the fastest growing segment over the forecast period to 2032
Marine bio products in the personal care and cosmetics sector are projected to be the fastest growing segment in the Marine Bio Products Market by 2032. This growth is fueled by increasing consumer preference for natural and sustainable ingredients in skincare, haircare, and cosmetic products. Marine-derived peptides, polysaccharides, and oils are gaining popularity in the beauty industry for their hydrating, anti-aging, and skin-protective properties. These bioactive compounds are sourced from marine algae, seaweeds, and microorganisms, known for their ability to nourish and rejuvenate the skin and hair. Further, the rising awareness of marine biodiversity and the benefits of marine ingredients drive innovation in cosmetic formulations, enhancing product efficacy and market appeal. As beauty brands increasingly incorporate marine bio products into their formulations, the segment is expected to experience robust growth, supported by consumer demand for sustainable and effective skincare solutions.
Marine Bio Products Market Segmentation
By Product
Proteins
Enzymes
Oils
Peptides
Polysaccharide
Others
By Application
Nutrition Supplements
Pharmaceuticals
Personal Care & Cosmetics
Food Ingredients
Agricultural Products
Others
Countries Analyzed
North America (US, Canada, Mexico)
Europe (Germany, UK, France, Spain, Italy, Russia, Rest of Europe)
Asia Pacific (China, India, Japan, South Korea, Australia, South East Asia, Rest of Asia)
South America (Brazil, Argentina, Rest of South America)
Middle East and Africa (Saudi Arabia, UAE, Rest of Middle East, South Africa, Egypt, Rest of Africa)
Marine Bio Products Companies Profiled in the Study
ArcticZymes
Auqi Marine Bio-Tech
BASF SE
Biotec Pharmacon
Biotec Pharmacon
Croda
Epax
GOED
Hofseth Biocare
Koninklijke DSM N.V.
Marinova
Maruha Nichiro
Sinomega Biotech
*- List Not Exhaustive
Chapter 1. TABLE OF CONTENTS
Chapter 2. Introduction to Marine Bio Products Market
2.1. Market Overview
2.2. Key Statistics and Report Highlights
2.3. Scope of the Comprehensive Study
2.3.1. Market Definition
2.3.2 Countries and Regions Covered
2.3.3 Research Objective
2.3.4 Units, Currency, and Conversions
2.3.5 Industry Value Chain
2.4. Key Market Segments
2.5. Key Companies
2.6. Study Period
Chapter 3. Strategic Analysis Review
3.1. Marine Bio Products Pricing Analysis and Forecast
3.2. Porter’s Five Forces
3.3. Market Ecosystem
3.4. SWOT Analysis
3.5. Regulatory Scenario
3.3. Effects of Inflation, Russia-Ukraine War, moderating economic growth, and other macroeconomic factors
Chapter 4. Competitive Landscape
4.1. Market Share Analysis
4.1.1. Global Marine Bio Products Market Share by Company, 2023
4.1.2. Product Offerings of Leading Marine Bio Products Companies
4.2. Market Entropy
4.2.1. New Product Launches in the Industry
4.2.2. Mergers, Acquisitions, Joint ventures, and Partnerships
4.3. Key Strategies and Best Practices
Chapter 5. Global Market Projections: Best, Reference, and Low Case Scenarios
5.1. Growth Analysis- Case Scenario Definitions
5.2. Low Growth Case Scenario Forecasts
5.3. Reference Growth Case Scenario Forecasts
5.4. High Growth Case Scenario Forecasts
Chapter 6. Market Dynamics
6.1. Marine Bio Products Market Drivers
6.2. Marine Bio Products Market Challenges
6.6. Marine Bio Products Market Opportunities
6.4. Marine Bio Products Market Trends
Chapter 7. Global Marine Bio Products Market Outlook Trends
7.1. Global Marine Bio Products Revenue (USD Million) and CAGR (%) by Type (2021-2032)
7.2. Global Marine Bio Products Revenue (USD Million) and CAGR (%) by Application (2021-2032)
7.3. Global Marine Bio Products Revenue (USD Million) and CAGR (%) by Product (2021-2032)
By Product
Proteins
Enzymes
Oils
Peptides
Polysaccharide
Others
By Application
Nutrition Supplements
Pharmaceuticals
Personal Care & Cosmetics
Food Ingredients
Agricultural Products
Others
Chapter 8. Global Marine Bio Products Regional Analysis and Outlook
8.1. Global Marine Bio Products Revenue (USD Million) By Regions (2021- 2032)
8.2. North America Marine Bio Products Revenue (USD Million) by Country (2021-2032)
8.2.1. United States Marine Bio Products Regional Analysis and Outlook
8.2.2. Canada Marine Bio Products Regional Analysis and Outlook
8.2.3. Mexico Marine Bio Products Regional Analysis and Outlook
8.3. Europe Marine Bio Products Revenue (USD Million), by Country (2021-2032)
8.3.1. Germany Marine Bio Products Regional Analysis and Outlook
8.3.2. France Marine Bio Products Regional Analysis and Outlook
8.3.3. United Kingdom Marine Bio Products Regional Analysis and Outlook
8.3.4. Spain Marine Bio Products Regional Analysis and Outlook
8.3.5. Italy Marine Bio Products Regional Analysis and Outlook
8.3.6. Russia Marine Bio Products Regional Analysis and Outlook
8.3.7. Rest of Europe Marine Bio Products Regional Analysis and Outlook
8.4. Asia Pacific Marine Bio Products Revenue (USD Million) by Country (2021-2032)
8.4.1. China Marine Bio Products Regional Analysis and Outlook
8.4.2. Japan Marine Bio Products Regional Analysis and Outlook
8.4.3. India Marine Bio Products Regional Analysis and Outlook
8.4.4. South Korea Marine Bio Products Regional Analysis and Outlook
8.4.5. Australia Marine Bio Products Regional Analysis and Outlook
8.4.6. South East Asia Marine Bio Products Regional Analysis and Outlook
8.4.7. Rest of Asia Pacific Marine Bio Products Regional Analysis and Outlook
8.5. South America Marine Bio Products Revenue (USD Million), by Country (2021-2032)
8.5.1. Brazil Marine Bio Products Regional Analysis and Outlook
8.5.2. Argentina Marine Bio Products Regional Analysis and Outlook
8.5.3. Rest of South America Marine Bio Products Regional Analysis and Outlook
8.6. Middle East and Africa Marine Bio Products Revenue (USD Million) by Country (2021-2032)
8.6.1. Middle East Marine Bio Products Regional Analysis and Outlook
8.6.2. Africa Marine Bio Products Regional Analysis and Outlook
Chapter 9. North America Marine Bio Products Analysis and Outlook
9.1. North America Marine Bio Products Revenue (USD Million) by Segments (2021-2032)
9.1.1. North America Marine Bio Products Revenue (USD Million) by Type (2021-2032)
9.1.2. North America Marine Bio Products Revenue (USD Million) by Application (2021-2032)
9.1.3. North America Marine Bio Products Revenue (USD Million) by Product (2021-2032)
By Product
Proteins
Enzymes
Oils
Peptides
Polysaccharide
Others
By Application
Nutrition Supplements
Pharmaceuticals
Personal Care & Cosmetics
Food Ingredients
Agricultural Products
Others
Chapter 10. Europe Marine Bio Products Analysis and Outlook
10.1. Europe Marine Bio Products Revenue (USD Million), by Segments (USD Million) (2021-2032)
10.1.1. Europe Marine Bio Products Revenue (USD Million) by Type (2021-2032)
10.1.2. Europe Marine Bio Products Revenue (USD Million) by Application (2021-2032)
10.1.3. Europe Marine Bio Products Revenue (USD Million) by Product (2021-2032)
By Product
Proteins
Enzymes
Oils
Peptides
Polysaccharide
Others
By Application
Nutrition Supplements
Pharmaceuticals
Personal Care & Cosmetics
Food Ingredients
Agricultural Products
Others
Chapter 11. Asia Pacific Marine Bio Products Analysis and Outlook
11.1. Asia Pacific Marine Bio Products Revenue (USD Million), and Revenue (USD Million) by Segments (2021-2032)
11.1.1. Asia Pacific Marine Bio Products Revenue (USD Million) by Type (2021-2032)
11.1.2. Asia Pacific Marine Bio Products Revenue (USD Million) by Application (2021-2032)
11.1.3. Asia Pacific Marine Bio Products Revenue (USD Million) by Product (2021-2032)
By Product
Proteins
Enzymes
Oils
Peptides
Polysaccharide
Others
By Application
Nutrition Supplements
Pharmaceuticals
Personal Care & Cosmetics
Food Ingredients
Agricultural Products
Others
Chapter 12. South America Marine Bio Products Analysis and Outlook
12.1. South America Marine Bio Products Revenue (USD Million), by Segments (2021-2032)
12.1.1. South America Marine Bio Products Revenue (USD Million) by Type (2021-2032)
12.1.2. South America Marine Bio Products Revenue (USD Million) by Application (2021-2032)
12.1.3. South America Marine Bio Products Revenue (USD Million) by Product (2021-2032)
By Product
Proteins
Enzymes
Oils
Peptides
Polysaccharide
Others
By Application
Nutrition Supplements
Pharmaceuticals
Personal Care & Cosmetics
Food Ingredients
Agricultural Products
Others
Chapter 13. Middle East and Africa Marine Bio Products Analysis and Outlook
13.1. Middle East and Africa Marine Bio Products Revenue (USD Million), by Segments (2021-2032)
13.1.1. Middle East and Africa Marine Bio Products Revenue (USD Million) by Type (2021-2032)
13.1.2. Middle East and Africa Marine Bio Products Revenue (USD Million) by Application (2021-2032)
13.1.3. Middle East and Africa Marine Bio Products Revenue (USD Million) by Product (2021-2032)
By Product
Proteins
Enzymes
Oils
Peptides
Polysaccharide
Others
By Application
Nutrition Supplements
Pharmaceuticals
Personal Care & Cosmetics
Food Ingredients
Agricultural Products
Others
Chapter 14. Marine Bio Products Company Profiles
14.1 Business Overview
14.2 Product Profiles
14.3 SWOT Profiles
14.5 Recent Developments
14.6 Financial Profile
List of Companies
ArcticZymes
Auqi Marine Bio-Tech
BASF SE
Biotec Pharmacon
Biotec Pharmacon
Croda
Epax
GOED
Hofseth Biocare
Koninklijke DSM N.V.
Marinova
Maruha Nichiro
Sinomega Biotech
15. Methodology and Data Sources
15.1 Customization Offerings
15.2 Subscription Services
15.3 Related Reports
15.4 Publisher Expertise
LIST OF TABLES
Table 1 Market Segmentation Analysis
Table 2 Global Marine Bio Products Market Share of Leading Companies, 2023
Table 3 Product Offerings of Leading Companies
Table 4 Low Growth Scenario Forecasts
Table 5 Reference Case Growth Scenario
Table 6 High Growth Case Scenario
Table 7 Global Marine Bio Products Revenue (USD Million) And CAGR (%) By Type (2021-2032)
Table 8 Global Marine Bio Products Revenue (USD Million) And CAGR (%) By Application (2021-2032)
Table 9 Global Marine Bio Products Revenue (USD Million) And CAGR (%) By Product (2021-2032)
Table 10 Global Marine Bio Products Market Revenue (USD Million) By Regions (2021-2032)
Table 11 Global Marine Bio Products Market Share (%) By Regions (2021-2032)
Table 12 North America Marine Bio Products Revenue (USD Million) By Country (2021-2032)
Table 13 Europe Marine Bio Products Revenue (USD Million) By Country (2021-2032)
Table 14 Asia Pacific Marine Bio Products Revenue (USD Million) By Country (2021-2032)
Table 15 South America Marine Bio Products Revenue (USD Million) By Country (2021-2032)
Table 16 Middle East and Africa Marine Bio Products Revenue (USD Million) By Region (2021-2032)
Table 17 North America Marine Bio Products Revenue (USD Million) By Type (2021-2032)
Table 18 North America Marine Bio Products Revenue (USD Million) By Application (2021-2032)
Table 19 North America Marine Bio Products Revenue (USD Million) By Product (2021-2032)
Table 20 Europe Marine Bio Products Revenue (USD Million) By Type (2021-2032)
Table 21 Europe Marine Bio Products Revenue (USD Million) By Application (2021-2032)
Table 22 Europe Marine Bio Products Revenue (USD Million) By Product (2021-2032)
Table 23 Asia Pacific Marine Bio Products Revenue (USD Million) By Type (2021-2032)
Table 24 Asia Pacific Marine Bio Products Revenue (USD Million) By Application (2021-2032)
Table 25 Asia Pacific Marine Bio Products Revenue (USD Million) By Product (2021-2032)
Table 26 South America Marine Bio Products Revenue (USD Million) By Type (2021-2032)
Table 27 South America Marine Bio Products Revenue (USD Million) By Application (2021-2032)
Table 28 South America Marine Bio Products Revenue (USD Million) By Product (2021-2032)
Table 29 Middle East and Africa Marine Bio Products Revenue (USD Million) By Type (2021-2032)
Table 30 Middle East and Africa Marine Bio Products Revenue (USD Million) By Application (2021-2032)
Table 31 Middle East and Africa Marine Bio Products Revenue (USD Million) By Product (2021-2032)
LIST OF FIGURES
Figure 1. Market Scope
Figure 2. Pricing Forecasts Per Unit, 2023- 2032
Figure 3. Porter’s Five Forces
Figure 4. Global Marine Bio Products Market Revenue (USD Million) By Regions (2021-2032)
Figure 5. Global Marine Bio Products Market Share (%) By Regions (2023)
Figure 6. North America Marine Bio Products Revenue (USD Million) By Country (2021-2032)
Figure 7. United States Marine Bio Products Revenue (USD Million) By Country (2021-2032)
Figure 8. Canada Marine Bio Products Revenue (USD Million) By Country (2021-2032)
Figure 9. Mexico Marine Bio Products Revenue (USD Million) By Country (2021-2032)
Figure 10. Europe Marine Bio Products Revenue (USD Million) By Country (2021-2032)
Figure 11. Germany Marine Bio Products Revenue (USD Million) By Country (2021-2032)
Figure 12. France Marine Bio Products Revenue (USD Million) By Country (2021-2032)
Figure 13. United Kingdom Marine Bio Products Revenue (USD Million) By Country (2021-2032)
Figure 14. Spain Marine Bio Products Revenue (USD Million) By Country (2021-2032)
Figure 15. Italy Marine Bio Products Revenue (USD Million) By Country (2021-2032)
Figure 16. Russia Marine Bio Products Revenue (USD Million) By Country (2021-2032)
Figure 17. Rest of Europe Marine Bio Products Revenue (USD Million) By Country (2021-2032)
Figure 11. Asia Pacific Marine Bio Products Revenue (USD Million) By Country (2021-2032)
Figure 12. China Marine Bio Products Revenue (USD Million) By Country (2021-2032)
Figure 13. Japan Marine Bio Products Revenue (USD Million) By Country (2021-2032)
Figure 14. India Marine Bio Products Revenue (USD Million) By Country (2021-2032)
Figure 15. South Korea Marine Bio Products Revenue (USD Million) By Country (2021-2032)
Figure 16. Australia Marine Bio Products Revenue (USD Million) By Country (2021-2032)
Figure 17. South East Asia Marine Bio Products Revenue (USD Million) By Country (2021-2032)
Figure 18. South America Marine Bio Products Revenue (USD Million) By Country (2021-2032)
Figure 19. Brazil Marine Bio Products Revenue (USD Million) By Country (2021-2032)
Figure 20. Argentina Marine Bio Products Revenue (USD Million) By Country (2021-2032)
Figure 21. Rest of Asia Pacific Marine Bio Products Revenue (USD Million) By Country (2021-2032)
Figure 22. Middle East and Africa Marine Bio Products Revenue (USD Million) By Region (2021-2032)
Figure 23. Saudi Arabia Marine Bio Products Revenue (USD Million) By Region (2021-2032)
Figure 24. The UAE Marine Bio Products Revenue (USD Million) By Region (2021-2032)
Figure 25. Rest of Middle East Marine Bio Products Revenue (USD Million) By Region (2021-2032)
Figure 26. South Africa Marine Bio Products Revenue (USD Million) By Region (2021-2032)
Figure 27. Africa Marine Bio Products Revenue (USD Million) By Region (2021-2032)
Figure 28. North America Marine Bio Products Revenue (USD Million) By Type (2021-2032)
Figure 29. North America Marine Bio Products Revenue (USD Million) By Application (2021-2032)
Figure 30. North America Marine Bio Products Revenue (USD Million) By Product (2021-2032)
Figure 31. Europe Marine Bio Products Revenue (USD Million) By Type (2021-2032)
Figure 32. Europe Marine Bio Products Revenue (USD Million) By Application (2021-2032)
Figure 33. Europe Marine Bio Products Revenue (USD Million) By Product (2021-2032)
Figure 34. Asia Pacific Marine Bio Products Revenue (USD Million) By Type (2021-2032)
Figure 35. Asia Pacific Marine Bio Products Revenue (USD Million) By Application (2021-2032)
Figure 36. Asia Pacific Marine Bio Products Revenue (USD Million) By Product (2021-2032)
Figure 37. South America Marine Bio Products Revenue (USD Million) By Type (2021-2032)
Figure 38. South America Marine Bio Products Revenue (USD Million) By Application (2021-2032)
Figure 39. South America Marine Bio Products Revenue (USD Million) By Product (2021-2032)
Figure 40. Middle East and Africa Marine Bio Products Revenue (USD Million) By Type (2021-2032)
Figure 41. Middle East and Africa Marine Bio Products Revenue (USD Million) By Application (2021-2032)
Figure 42. Middle East and Africa Marine Bio Products Revenue (USD Million) By Product (2021-2032)
By Product
Proteins
Enzymes
Oils
Peptides
Polysaccharide
Others
By Application
Nutrition Supplements
Pharmaceuticals
Personal Care & Cosmetics
Food Ingredients
Agricultural Products
Others
Countries Analyzed
North America (US, Canada, Mexico)
Europe (Germany, UK, France, Spain, Italy, Russia, Rest of Europe)
Asia Pacific (China, India, Japan, South Korea, Australia, South East Asia, Rest of Asia)
South America (Brazil, Argentina, Rest of South America)
Middle East and Africa (Saudi Arabia, UAE, Rest of Middle East, South Africa, Egypt, Rest of Africa)
