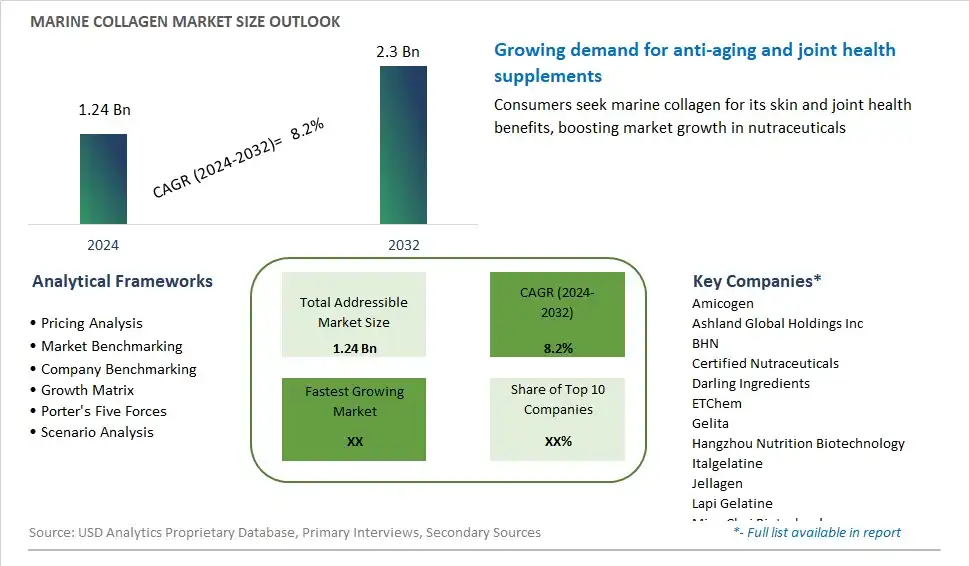
Global Marine Collagen Market Size is valued at $1.24 Billion in 2024 and is forecast to register a growth rate (CAGR) of 8.2% to reach $2.3 Billion by 2032.
The global Marine Collagen Market Comprehensive Study analyzes and forecasts the market size across 6 regions and 24 countries for diverse segments -By Type (Type I, Type III, Others), By Source (Skin, Scales, Muscles, Bones And Tendons, Others), By Animal (Fish, Others), By Application (Nutraceuticals, Cosmetics, Medical, Others)
An Introduction to Marine Collagen Market
Marine collagen is a type of collagen derived from the skin, scales, and bones of marine sources such as fish and shellfish, used in the food, beverage, and cosmetic industries for its potential health and beauty benefits in 2024. Collagen is the most abundant protein in the human body, providing structural support to tissues such as skin, bones, and joints. Marine collagen is rich in type I collagen, which is highly bioavailable and easily absorbed by the body, making it an attractive ingredient for dietary supplements, functional foods, and skincare products. With advancements in extraction technology and quality control, manufacturers can produce marine collagen with high purity, potency, and safety, meeting the growing demand for natural, clean-label ingredients and wellness solutions. As consumer awareness of collagen's role in promoting skin health, joint function, and overall well-being grows, the market for marine collagen is expected to expand, driven by innovations in product formulation, marketing, and distribution that meet market demands and consumer preferences.
Marine Collagen Competitive Landscape
The market report analyses the leading companies in the industry including Amicogen, Ashland Global Holdings Inc, BHN, Certified Nutraceuticals, Darling Ingredients, ETChem, Gelita, Hangzhou Nutrition Biotechnology, Italgelatine, Jellagen, Lapi Gelatine, Ming Chyi Biotechnology, Ningbo Nutrition Food Technology, Nippi Collagen, Nitta Gelatin, NutraChoice, Seagarden, Tai Ai Peptide Group, Titan Biotech Ltd, Weishardt, and Others.
Marine Collagen Market Dynamics
Marine Collagen Market Trend: Growing Preference for Natural and Sustainable Ingredients in Beauty and Wellness Products
The market trend for marine collagen is characterized by the growing preference for natural and sustainable ingredients in beauty and wellness products. Marine collagen, sourced from fish scales, skin, and bones, is gaining popularity as a superior alternative to bovine or porcine collagen due to its bioavailability, purity, and environmental sustainability. This trend is driven by consumer awareness of the health benefits associated with collagen supplementation, including improved skin elasticity, joint health, and bone density. Additionally, the marine collagen market is witnessing increased demand from the cosmetics and personal care industry, where collagen is incorporated into skincare formulations for anti-aging and moisturizing benefits. As consumers prioritize clean label products and ethical sourcing practices, there's a notable shift towards marine collagen as a natural, eco-friendly ingredient in beauty and wellness applications.
Market Driver: Aging Population and Rising Health Consciousness
A key driver propelling the market for marine collagen is the aging population and the rising health consciousness among consumers globally. As life expectancy increases and demographic trends shift towards an older population, there's a growing demand for collagen-based supplements and functional foods targeting age-related health concerns such as joint pain, wrinkles, and brittle nails. Marine collagen, with its high bioavailability and amino acid profile resembling human collagen, is well-positioned to address these needs and support healthy aging. Furthermore, the growing prevalence of lifestyle-related health conditions such as osteoarthritis, osteoporosis, and skin aging fuels the demand for collagen supplementation as a preventive and therapeutic measure. With consumers increasingly prioritizing proactive approaches to health and wellness, marine collagen emerges as a key driver of growth in the nutraceutical and cosmeceutical markets.
Market Opportunity: Expansion into Functional Food and Beverage Applications
An opportunity within the marine collagen market lies in the expansion into functional food and beverage applications to capitalize on the growing demand for collagen-enhanced products targeting holistic health and well-being. While marine collagen is predominantly used in dietary supplements and skincare formulations, there's untapped potential for its incorporation into functional foods and beverages such as collagen-infused drinks, protein bars, and fortified snacks. By fortifying everyday food and beverage items with marine collagen, manufacturers can offer consumers convenient and enjoyable ways to incorporate collagen into their daily routines, thus expanding the reach and accessibility of collagen supplementation beyond traditional formats. Additionally, marine collagen's neutral taste and odor make it suitable for a wide range of food applications, providing versatility and innovation opportunities for product development. By tapping into this emerging market segment, stakeholders in the marine collagen industry can diversify their product portfolios, attract new consumer demographics, and drive revenue growth in the functional food and beverage market.
Marine Collagen Market Share Analysis: Type I held the dominant market share in 2024
Within the marine collagen market, Type I collagen is the largest segment, driven by its abundance in marine sources and its widespread application in various industries. Type I collagen is the most prevalent collagen type found in the human body, particularly in the skin, bones, tendons, and ligaments, making it highly sought after for its potential health and beauty benefits. Marine collagen, derived from fish scales, skin, and bones, is rich in Type I collagen peptides, which are known for their superior bioavailability and efficacy compared to other collagen types. Further, Type I collagen is valued for its ability to promote skin elasticity, hydration, and wrinkle reduction, as well as its support for joint and bone health. As consumers increasingly prioritize natural and sustainable ingredients in their skincare, nutraceutical, and functional food products, the demand for Type I marine collagen continues to soar, solidifying its dominance in the market.
Marine Collagen Market Share Analysis: Scales market is poised to register the fastest growth rae over the forecast period to 2032
Among the various sources of marine collagen, scales emerge as the fastest-growing segment, fueled by their high collagen content, efficient extraction methods, and diverse applications across the beauty and healthcare industries. Marine collagen extracted from fish scales is prized for its abundance of Type I collagen peptides, which are known for their superior bioavailability and efficacy in promoting skin health and rejuvenation. Additionally, advancements in extraction technologies have made it easier and more cost-effective to obtain collagen from fish scales, further driving its popularity. Further, the increasing consumer demand for natural and sustainable skincare products has spurred the incorporation of marine collagen derived from scales into a wide range of cosmetics, supplements, and functional foods. As consumers continue to seek effective and eco-friendly solutions for skincare and wellness, the scales segment of the marine collagen market is poised for significant growth and expansion.
Marine Collagen Market Share Analysis: Fish held the dominant market share in 2024
In the marine collagen market, the fish segment is the largest, driven by the abundant availability of collagen-rich sources from various fish species and their versatile applications across industries. Fish collagen is renowned for its high purity, bioavailability, and efficacy in promoting skin, joint, and bone health. With fish being one of the primary sources of marine collagen, the extraction processes from fish skin, scales, bones, and muscles yield collagen peptides predominantly composed of Type I collagen, which closely resembles human collagen. This similarity enhances the absorption and utilization of fish collagen in the body, making it highly sought after in the cosmetics, nutraceutical, and functional food sectors. Further, the sustainable and eco-friendly nature of fish collagen aligns with consumer preferences for natural and ethical ingredients, further driving its dominance in the marine collagen market.
Marine Collagen Market Segmentation
By Type
Type I
Type III
Others
By Source
Skin
Scales
Muscles
Bones And Tendons
Others
By Animal
Fish
Others
By Application
Nutraceuticals
Cosmetics
Medical
Others
Countries Analyzed
North America (US, Canada, Mexico)
Europe (Germany, UK, France, Spain, Italy, Russia, Rest of Europe)
Asia Pacific (China, India, Japan, South Korea, Australia, South East Asia, Rest of Asia)
South America (Brazil, Argentina, Rest of South America)
Middle East and Africa (Saudi Arabia, UAE, Rest of Middle East, South Africa, Egypt, Rest of Africa)
Marine Collagen Companies Profiled in the Study
Amicogen
Ashland Global Holdings Inc
BHN
Certified Nutraceuticals
Darling Ingredients
ETChem
Gelita
Hangzhou Nutrition Biotechnology
Italgelatine
Jellagen
Lapi Gelatine
Ming Chyi Biotechnology
Ningbo Nutrition Food Technology
Nippi Collagen
Nitta Gelatin
NutraChoice
Seagarden
Tai Ai Peptide Group
Titan Biotech Ltd
Weishardt
*- List Not Exhaustive
Chapter 1. TABLE OF CONTENTS
Chapter 2. Introduction to Marine Collagen Market
2.1. Market Overview
2.2. Key Statistics and Report Highlights
2.3. Scope of the Comprehensive Study
2.3.1. Market Definition
2.3.2 Countries and Regions Covered
2.3.3 Research Objective
2.3.4 Units, Currency, and Conversions
2.3.5 Industry Value Chain
2.4. Key Market Segments
2.5. Key Companies
2.6. Study Period
Chapter 3. Strategic Analysis Review
3.1. Marine Collagen Pricing Analysis and Forecast
3.2. Porter’s Five Forces
3.3. Market Ecosystem
3.4. SWOT Analysis
3.5. Regulatory Scenario
3.3. Effects of Inflation, Russia-Ukraine War, moderating economic growth, and other macroeconomic factors
Chapter 4. Competitive Landscape
4.1. Market Share Analysis
4.1.1. Global Marine Collagen Market Share by Company, 2023
4.1.2. Product Offerings of Leading Marine Collagen Companies
4.2. Market Entropy
4.2.1. New Product Launches in the Industry
4.2.2. Mergers, Acquisitions, Joint ventures, and Partnerships
4.3. Key Strategies and Best Practices
Chapter 5. Global Market Projections: Best, Reference, and Low Case Scenarios
5.1. Growth Analysis- Case Scenario Definitions
5.2. Low Growth Case Scenario Forecasts
5.3. Reference Growth Case Scenario Forecasts
5.4. High Growth Case Scenario Forecasts
Chapter 6. Market Dynamics
6.1. Marine Collagen Market Drivers
6.2. Marine Collagen Market Challenges
6.6. Marine Collagen Market Opportunities
6.4. Marine Collagen Market Trends
Chapter 7. Global Marine Collagen Market Outlook Trends
7.1. Global Marine Collagen Revenue (USD Million) and CAGR (%) by Type (2021-2032)
7.2. Global Marine Collagen Revenue (USD Million) and CAGR (%) by Application (2021-2032)
7.3. Global Marine Collagen Revenue (USD Million) and CAGR (%) by Product (2021-2032)
By Type
Type I
Type III
Others
By Source
Skin
Scales
Muscles
Bones And Tendons
Others
By Animal
Fish
Others
By Application
Nutraceuticals
Cosmetics
Medical
Others
Chapter 8. Global Marine Collagen Regional Analysis and Outlook
8.1. Global Marine Collagen Revenue (USD Million) By Regions (2021- 2032)
8.2. North America Marine Collagen Revenue (USD Million) by Country (2021-2032)
8.2.1. United States Marine Collagen Regional Analysis and Outlook
8.2.2. Canada Marine Collagen Regional Analysis and Outlook
8.2.3. Mexico Marine Collagen Regional Analysis and Outlook
8.3. Europe Marine Collagen Revenue (USD Million), by Country (2021-2032)
8.3.1. Germany Marine Collagen Regional Analysis and Outlook
8.3.2. France Marine Collagen Regional Analysis and Outlook
8.3.3. United Kingdom Marine Collagen Regional Analysis and Outlook
8.3.4. Spain Marine Collagen Regional Analysis and Outlook
8.3.5. Italy Marine Collagen Regional Analysis and Outlook
8.3.6. Russia Marine Collagen Regional Analysis and Outlook
8.3.7. Rest of Europe Marine Collagen Regional Analysis and Outlook
8.4. Asia Pacific Marine Collagen Revenue (USD Million) by Country (2021-2032)
8.4.1. China Marine Collagen Regional Analysis and Outlook
8.4.2. Japan Marine Collagen Regional Analysis and Outlook
8.4.3. India Marine Collagen Regional Analysis and Outlook
8.4.4. South Korea Marine Collagen Regional Analysis and Outlook
8.4.5. Australia Marine Collagen Regional Analysis and Outlook
8.4.6. South East Asia Marine Collagen Regional Analysis and Outlook
8.4.7. Rest of Asia Pacific Marine Collagen Regional Analysis and Outlook
8.5. South America Marine Collagen Revenue (USD Million), by Country (2021-2032)
8.5.1. Brazil Marine Collagen Regional Analysis and Outlook
8.5.2. Argentina Marine Collagen Regional Analysis and Outlook
8.5.3. Rest of South America Marine Collagen Regional Analysis and Outlook
8.6. Middle East and Africa Marine Collagen Revenue (USD Million) by Country (2021-2032)
8.6.1. Middle East Marine Collagen Regional Analysis and Outlook
8.6.2. Africa Marine Collagen Regional Analysis and Outlook
Chapter 9. North America Marine Collagen Analysis and Outlook
9.1. North America Marine Collagen Revenue (USD Million) by Segments (2021-2032)
9.1.1. North America Marine Collagen Revenue (USD Million) by Type (2021-2032)
9.1.2. North America Marine Collagen Revenue (USD Million) by Application (2021-2032)
9.1.3. North America Marine Collagen Revenue (USD Million) by Product (2021-2032)
By Type
Type I
Type III
Others
By Source
Skin
Scales
Muscles
Bones And Tendons
Others
By Animal
Fish
Others
By Application
Nutraceuticals
Cosmetics
Medical
Others
Chapter 10. Europe Marine Collagen Analysis and Outlook
10.1. Europe Marine Collagen Revenue (USD Million), by Segments (USD Million) (2021-2032)
10.1.1. Europe Marine Collagen Revenue (USD Million) by Type (2021-2032)
10.1.2. Europe Marine Collagen Revenue (USD Million) by Application (2021-2032)
10.1.3. Europe Marine Collagen Revenue (USD Million) by Product (2021-2032)
By Type
Type I
Type III
Others
By Source
Skin
Scales
Muscles
Bones And Tendons
Others
By Animal
Fish
Others
By Application
Nutraceuticals
Cosmetics
Medical
Others
Chapter 11. Asia Pacific Marine Collagen Analysis and Outlook
11.1. Asia Pacific Marine Collagen Revenue (USD Million), and Revenue (USD Million) by Segments (2021-2032)
11.1.1. Asia Pacific Marine Collagen Revenue (USD Million) by Type (2021-2032)
11.1.2. Asia Pacific Marine Collagen Revenue (USD Million) by Application (2021-2032)
11.1.3. Asia Pacific Marine Collagen Revenue (USD Million) by Product (2021-2032)
By Type
Type I
Type III
Others
By Source
Skin
Scales
Muscles
Bones And Tendons
Others
By Animal
Fish
Others
By Application
Nutraceuticals
Cosmetics
Medical
Others
Chapter 12. South America Marine Collagen Analysis and Outlook
12.1. South America Marine Collagen Revenue (USD Million), by Segments (2021-2032)
12.1.1. South America Marine Collagen Revenue (USD Million) by Type (2021-2032)
12.1.2. South America Marine Collagen Revenue (USD Million) by Application (2021-2032)
12.1.3. South America Marine Collagen Revenue (USD Million) by Product (2021-2032)
By Type
Type I
Type III
Others
By Source
Skin
Scales
Muscles
Bones And Tendons
Others
By Animal
Fish
Others
By Application
Nutraceuticals
Cosmetics
Medical
Others
Chapter 13. Middle East and Africa Marine Collagen Analysis and Outlook
13.1. Middle East and Africa Marine Collagen Revenue (USD Million), by Segments (2021-2032)
13.1.1. Middle East and Africa Marine Collagen Revenue (USD Million) by Type (2021-2032)
13.1.2. Middle East and Africa Marine Collagen Revenue (USD Million) by Application (2021-2032)
13.1.3. Middle East and Africa Marine Collagen Revenue (USD Million) by Product (2021-2032)
By Type
Type I
Type III
Others
By Source
Skin
Scales
Muscles
Bones And Tendons
Others
By Animal
Fish
Others
By Application
Nutraceuticals
Cosmetics
Medical
Others
Chapter 14. Marine Collagen Company Profiles
14.1 Business Overview
14.2 Product Profiles
14.3 SWOT Profiles
14.5 Recent Developments
14.6 Financial Profile
List of Companies
Amicogen
Ashland Global Holdings Inc
BHN
Certified Nutraceuticals
Darling Ingredients
ETChem
Gelita
Hangzhou Nutrition Biotechnology
Italgelatine
Jellagen
Lapi Gelatine
Ming Chyi Biotechnology
Ningbo Nutrition Food Technology
Nippi Collagen
Nitta Gelatin
NutraChoice
Seagarden
Tai Ai Peptide Group
Titan Biotech Ltd
Weishardt
15. Methodology and Data Sources
15.1 Customization Offerings
15.2 Subscription Services
15.3 Related Reports
15.4 Publisher Expertise
LIST OF TABLES
Table 1 Market Segmentation Analysis
Table 2 Global Marine Collagen Market Share of Leading Companies, 2023
Table 3 Product Offerings of Leading Companies
Table 4 Low Growth Scenario Forecasts
Table 5 Reference Case Growth Scenario
Table 6 High Growth Case Scenario
Table 7 Global Marine Collagen Revenue (USD Million) And CAGR (%) By Type (2021-2032)
Table 8 Global Marine Collagen Revenue (USD Million) And CAGR (%) By Application (2021-2032)
Table 9 Global Marine Collagen Revenue (USD Million) And CAGR (%) By Product (2021-2032)
Table 10 Global Marine Collagen Market Revenue (USD Million) By Regions (2021-2032)
Table 11 Global Marine Collagen Market Share (%) By Regions (2021-2032)
Table 12 North America Marine Collagen Revenue (USD Million) By Country (2021-2032)
Table 13 Europe Marine Collagen Revenue (USD Million) By Country (2021-2032)
Table 14 Asia Pacific Marine Collagen Revenue (USD Million) By Country (2021-2032)
Table 15 South America Marine Collagen Revenue (USD Million) By Country (2021-2032)
Table 16 Middle East and Africa Marine Collagen Revenue (USD Million) By Region (2021-2032)
Table 17 North America Marine Collagen Revenue (USD Million) By Type (2021-2032)
Table 18 North America Marine Collagen Revenue (USD Million) By Application (2021-2032)
Table 19 North America Marine Collagen Revenue (USD Million) By Product (2021-2032)
Table 20 Europe Marine Collagen Revenue (USD Million) By Type (2021-2032)
Table 21 Europe Marine Collagen Revenue (USD Million) By Application (2021-2032)
Table 22 Europe Marine Collagen Revenue (USD Million) By Product (2021-2032)
Table 23 Asia Pacific Marine Collagen Revenue (USD Million) By Type (2021-2032)
Table 24 Asia Pacific Marine Collagen Revenue (USD Million) By Application (2021-2032)
Table 25 Asia Pacific Marine Collagen Revenue (USD Million) By Product (2021-2032)
Table 26 South America Marine Collagen Revenue (USD Million) By Type (2021-2032)
Table 27 South America Marine Collagen Revenue (USD Million) By Application (2021-2032)
Table 28 South America Marine Collagen Revenue (USD Million) By Product (2021-2032)
Table 29 Middle East and Africa Marine Collagen Revenue (USD Million) By Type (2021-2032)
Table 30 Middle East and Africa Marine Collagen Revenue (USD Million) By Application (2021-2032)
Table 31 Middle East and Africa Marine Collagen Revenue (USD Million) By Product (2021-2032)
LIST OF FIGURES
Figure 1. Market Scope
Figure 2. Pricing Forecasts Per Unit, 2023- 2032
Figure 3. Porter’s Five Forces
Figure 4. Global Marine Collagen Market Revenue (USD Million) By Regions (2021-2032)
Figure 5. Global Marine Collagen Market Share (%) By Regions (2023)
Figure 6. North America Marine Collagen Revenue (USD Million) By Country (2021-2032)
Figure 7. United States Marine Collagen Revenue (USD Million) By Country (2021-2032)
Figure 8. Canada Marine Collagen Revenue (USD Million) By Country (2021-2032)
Figure 9. Mexico Marine Collagen Revenue (USD Million) By Country (2021-2032)
Figure 10. Europe Marine Collagen Revenue (USD Million) By Country (2021-2032)
Figure 11. Germany Marine Collagen Revenue (USD Million) By Country (2021-2032)
Figure 12. France Marine Collagen Revenue (USD Million) By Country (2021-2032)
Figure 13. United Kingdom Marine Collagen Revenue (USD Million) By Country (2021-2032)
Figure 14. Spain Marine Collagen Revenue (USD Million) By Country (2021-2032)
Figure 15. Italy Marine Collagen Revenue (USD Million) By Country (2021-2032)
Figure 16. Russia Marine Collagen Revenue (USD Million) By Country (2021-2032)
Figure 17. Rest of Europe Marine Collagen Revenue (USD Million) By Country (2021-2032)
Figure 11. Asia Pacific Marine Collagen Revenue (USD Million) By Country (2021-2032)
Figure 12. China Marine Collagen Revenue (USD Million) By Country (2021-2032)
Figure 13. Japan Marine Collagen Revenue (USD Million) By Country (2021-2032)
Figure 14. India Marine Collagen Revenue (USD Million) By Country (2021-2032)
Figure 15. South Korea Marine Collagen Revenue (USD Million) By Country (2021-2032)
Figure 16. Australia Marine Collagen Revenue (USD Million) By Country (2021-2032)
Figure 17. South East Asia Marine Collagen Revenue (USD Million) By Country (2021-2032)
Figure 18. South America Marine Collagen Revenue (USD Million) By Country (2021-2032)
Figure 19. Brazil Marine Collagen Revenue (USD Million) By Country (2021-2032)
Figure 20. Argentina Marine Collagen Revenue (USD Million) By Country (2021-2032)
Figure 21. Rest of Asia Pacific Marine Collagen Revenue (USD Million) By Country (2021-2032)
Figure 22. Middle East and Africa Marine Collagen Revenue (USD Million) By Region (2021-2032)
Figure 23. Saudi Arabia Marine Collagen Revenue (USD Million) By Region (2021-2032)
Figure 24. The UAE Marine Collagen Revenue (USD Million) By Region (2021-2032)
Figure 25. Rest of Middle East Marine Collagen Revenue (USD Million) By Region (2021-2032)
Figure 26. South Africa Marine Collagen Revenue (USD Million) By Region (2021-2032)
Figure 27. Africa Marine Collagen Revenue (USD Million) By Region (2021-2032)
Figure 28. North America Marine Collagen Revenue (USD Million) By Type (2021-2032)
Figure 29. North America Marine Collagen Revenue (USD Million) By Application (2021-2032)
Figure 30. North America Marine Collagen Revenue (USD Million) By Product (2021-2032)
Figure 31. Europe Marine Collagen Revenue (USD Million) By Type (2021-2032)
Figure 32. Europe Marine Collagen Revenue (USD Million) By Application (2021-2032)
Figure 33. Europe Marine Collagen Revenue (USD Million) By Product (2021-2032)
Figure 34. Asia Pacific Marine Collagen Revenue (USD Million) By Type (2021-2032)
Figure 35. Asia Pacific Marine Collagen Revenue (USD Million) By Application (2021-2032)
Figure 36. Asia Pacific Marine Collagen Revenue (USD Million) By Product (2021-2032)
Figure 37. South America Marine Collagen Revenue (USD Million) By Type (2021-2032)
Figure 38. South America Marine Collagen Revenue (USD Million) By Application (2021-2032)
Figure 39. South America Marine Collagen Revenue (USD Million) By Product (2021-2032)
Figure 40. Middle East and Africa Marine Collagen Revenue (USD Million) By Type (2021-2032)
Figure 41. Middle East and Africa Marine Collagen Revenue (USD Million) By Application (2021-2032)
Figure 42. Middle East and Africa Marine Collagen Revenue (USD Million) By Product (2021-2032)
By Type
Type I
Type III
Others
By Source
Skin
Scales
Muscles
Bones And Tendons
Others
By Animal
Fish
Others
By Application
Nutraceuticals
Cosmetics
Medical
Others
Countries Analyzed
North America (US, Canada, Mexico)
Europe (Germany, UK, France, Spain, Italy, Russia, Rest of Europe)
Asia Pacific (China, India, Japan, South Korea, Australia, South East Asia, Rest of Asia)
South America (Brazil, Argentina, Rest of South America)
Middle East and Africa (Saudi Arabia, UAE, Rest of Middle East, South Africa, Egypt, Rest of Africa)
