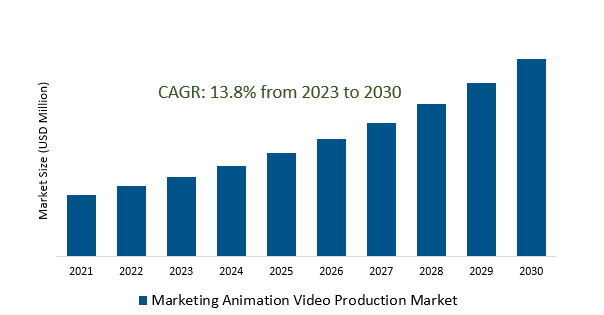
The Marketing Animation Video Production Market Size is estimated to register 13.8% growth over the forecast period from 2023 to 2030.
Marketing Animation Video Production Market Overview
The escalating shift towards digitalization and online platforms is heightening the need for visually captivating content to engage audiences effectively. Simultaneously, the surge in video content consumption is propelling the demand for animated videos as they offer an engaging, shareable, and versatile format. Further, personalized and targeted marketing strategies are leading brands to invest in animated videos that cater to specific audience segments, fostering deeper engagement and connection. Additionally, the prevalence of short-form videos optimized for various social media platforms are increasing, with brands focusing on creating concise and attention-grabbing animated content to captivate audiences in the fast-paced digital space. Growing demand for high-definition 3D animation and sophisticated visual effects that offer more immersive and visually striking storytelling experiences are driving the market.
Marketing Animation Video Production Market Dynamics
Market Trends- Growing Popularity of 2D and 3D Animation in Marketing Animation Video Production Market.
2D animation, renowned for its simplicity and cost-effectiveness, is experiencing a resurgence due to its capacity to convey brand messages in visually appealing and accessible formats.
The features of explaining videos, storytelling, and simplifying intricate concepts for wider comprehension are driving the market demand.
Additionally, the intricate detailing, depth, and realism offering by 3D animation is enhancing brand narratives, product visualization, and overall immersive experiences, leveraging the unique attributes of both animation styles are fuelling the demand.
Market Driver- Visual Communication's Rising Importance is shaping Marketing Animation Video Production Market.
The surge in online content consumption is propelling businesses to prioritize visual storytelling as an effective means of engaging audiences in the digital realm leading to the market growth.
Furthermore, the advent of social media as a dominant marketing platform is accentuating the importance of visually captivating content to capture attention and drive brand visibility.
Additionally, technological advancements in animation tools are facilitating the creation of high-quality and visually appealing content, contributing to the market growth.
Market Opportunity- Focus on Short-Form Social Media Videos drives Marketing Animation Production.
The evolving preferences of online audiences, who exhibit a penchant for concise and engaging content across platforms like TikTok, Instagram, and YouTube Shorts are driving the market growth.
The rapid growth of social media as a marketing avenue is intensifying the demand for animated short-form content, leading brands to focus on creating captivating, easily consumable animations that resonate with diverse audience demographics.
Additionally, user-friendly animation tools are facilitating the streamlined production of short-form animated videos, empowering businesses to swiftly craft visually appealing content tailored for social media consumption, thereby rising the revenue.
Market Share Analysis- Corporate/Brand Video Production will register the fastest growth
The Marketing Animation Video Production Market is analysed across Corporate/Brand Video, Production Product Video, Production Popular Science Education Videos Production & Other Videos Productions. Corporate/Brand Video Production is poised to register the fastest growth. Animation in corporate videos helps in establishing a distinct brand identity by showcasing the company's mission, values, and unique selling propositions. It allows businesses to communicate their brand story creatively, leaving a lasting impression on viewers. Animated corporate videos are an engaging way to communicate complex ideas, new initiatives, or changes within the company to employees, stakeholders, or clients. They simplify information, making it more accessible and memorable. Brands utilize animated videos for marketing campaigns, product launches, or promotional activities. These videos highlight product features, benefits, and functionalities in an engaging and visually appealing manner, effectively capturing the audience's attention. In an era dominated by online content consumption, animated corporate videos are instrumental in enhancing a company's online presence.
Market Share Analysis- Retail held a significant market share in 2023
The Marketing Animation Video Production Market is analysed across various applications including Retail, Manufacturing, Education, Financial, Medical Insurance, Music Industry, Professional Service & Others. Of these, Retail held a significant market share in 2023. Animation serves as an invaluable tool for retailers to showcase product features, functionalities, and benefits in a visually appealing and easily understandable manner. Whether it's demonstrating how a product works or highlighting its unique attributes, animated videos engage potential customers effectively. Retailers leverage animation to tell compelling stories about their brand, history, values, and mission. These narratives help in building emotional connections with consumers, fostering brand loyalty and trust. Animated videos play a pivotal role in promotional campaigns, including sales events, product launches, or seasonal offers. They create excitement, communicate promotional details, and drive traffic to retail outlets or online stores. These videos are shared across websites, social media channels, and email marketing campaigns, attracting and retaining consumer attention.
Marketing Animation Video Production Market Segmentation
By Type
- Corporate/Brand Video Production
- Product Video Production
- Popular Science Education Videos Production
- Other Videos Production
By Application
- Retail
- Manufacturing
- Education
- Financial
- Medical Insurance
- Music Industry
- Professional Service
- Others
By Region
- North America (United States, Canada, Mexico)
- Europe (Germany, France, United Kingdom, Spain, Italy, Others)
- Asia Pacific (China, India, Japan, South Korea, Australia, Others)
- Latin America (Brazil, Argentina, Others)
- Middle East and Africa (Saudi Arabia, UAE, Kuwait, Other Middle East, South Africa, Nigeria, Other Africa)
Marketing Animation Video Production Market Companies
- Framestore
- Epipheo Studios
- Switch Video
- The Mill
- Digital Domain
- Explanify
- Demo Duck
- Wyzowl
- Yum Yum Videos
- Moving Picture Company (MPC)
- One Media Group
- IGW
- Allua Limited
- Thinkmojo
- Sandwich Video
- Rip Media Group
- Grumo Media
*List not exhaustive
Marketing Animation Video Production Market Outlook 2023
1 Market Overview
1.1 Introduction to the Marketing Animation Video Production Market
1.2 Scope of the Study
1.3 Research Objective
1.3.1 Key Market Scope and Segments
1.3.2 Players Covered
1.3.3 Years Considered
2 Executive Summary
2.1 2023 Marketing Animation Video Production Industry- Market Statistics
3 Market Dynamics
3.1 Market Drivers
3.2 Market Challenges
3.3 Market Opportunities
3.4 Market Trends
4 Market Factor Analysis
4.1 Porter’s Five Forces
4.2 Market Entropy
4.2.1 Global Marketing Animation Video Production Market Companies with Area Served
4.2.2 Products Offerings Global Marketing Animation Video Production Market
5 COVID-19 Impact Analysis and Outlook Scenarios
5.1.1 Covid-19 Impact Analysis
5.1.2 post-COVID-19 Scenario- Low Growth Case
5.1.3 post-COVID-19 Scenario- Reference Growth Case
5.1.4 post-COVID-19 Scenario- Low Growth Case
6 Global Marketing Animation Video Production Market Trends
6.1 Global Marketing Animation Video Production Revenue (USD Million) and CAGR (%) by Type (2018-2030)
6.2 Global Marketing Animation Video Production Revenue (USD Million) and CAGR (%) by Applications (2018-2030)
6.3 Global Marketing Animation Video Production Revenue (USD Million) and CAGR (%) by regions (2018-2030)
7 Global Marketing Animation Video Production Market Revenue (USD Million) by Type, and Applications (2018-2022)
7.1 Global Marketing Animation Video Production Revenue (USD Million) by Type (2018-2022)
7.1.1 Global Marketing Animation Video Production Revenue (USD Million), Market Share (%) by Type (2018-2022)
7.2 Global Marketing Animation Video Production Revenue (USD Million) by Applications (2018-2022)
7.2.1 Global Marketing Animation Video Production Revenue (USD Million), Market Share (%) by Applications (2018-2022)
8 Global Marketing Animation Video Production Development Regional Status and Outlook
8.1 Global Marketing Animation Video Production Revenue (USD Million) By Regions (2018-2022)
8.2 North America Marketing Animation Video Production Revenue (USD Million) by Type, and Application (2018-2022)
8.2.1 North America Marketing Animation Video Production Revenue (USD Million) by Country (2018-2022)
8.2.2 North America Marketing Animation Video Production Revenue (USD Million) by Type (2018-2022)
8.2.3 North America Marketing Animation Video Production Revenue (USD Million) by Applications (2018-2022)
8.3 Europe Marketing Animation Video Production Revenue (USD Million), by Type, and Applications (USD Million) (2018-2022)
8.3.1 Europe Marketing Animation Video Production Revenue (USD Million), by Country (2018-2022)
8.3.2 Europe Marketing Animation Video Production Revenue (USD Million) by Type (2018-2022)
8.3.3 Europe Marketing Animation Video Production Revenue (USD Million) by Applications (2018-2022)
8.4 Asia Pacific Marketing Animation Video Production Revenue (USD Million), and Revenue (USD Million) by Type, and Applications (2018-2022)
8.4.1 Asia Pacific Marketing Animation Video Production Revenue (USD Million) by Country (2018-2022)
8.4.2 Asia Pacific Marketing Animation Video Production Revenue (USD Million) by Type (2018-2022)
8.4.3 Asia Pacific Marketing Animation Video Production Revenue (USD Million) by Applications (2018-2022)
8.5 South America Marketing Animation Video Production Revenue (USD Million), by Type, and Applications (2018-2022)
8.5.1 South America Marketing Animation Video Production Revenue (USD Million), by Country (2018-2022)
8.5.2 South America Marketing Animation Video Production Revenue (USD Million) by Type (2018-2022)
8.5.3 South America Marketing Animation Video Production Revenue (USD Million) by Applications (2018-2022)
8.6 Middle East and Africa Marketing Animation Video Production Revenue (USD Million), by Type, Technology, Application, Thickness (2018-2022)
8.6.1 Middle East and Africa Marketing Animation Video Production Revenue (USD Million) by Country (2018-2022)
8.6.2 Middle East and Africa Marketing Animation Video Production Revenue (USD Million) by Type (2018-2022)
8.6.3 Middle East and Africa Marketing Animation Video Production Revenue (USD Million) by Applications (2018-2022)
9 Company Profiles
10 Global Marketing Animation Video Production Market Revenue (USD Million), by Type, and Applications (2023-2030)
10.1 Global Marketing Animation Video Production Revenue (USD Million) and Market Share (%) by Type (2023-2030)
10.1.1 Global Marketing Animation Video Production Revenue (USD Million), and Market Share (%) by Type (2023-2030)
10.2 Global Marketing Animation Video Production Revenue (USD Million) and Market Share (%) by Applications (2023-2030)
10.2.1 Global Marketing Animation Video Production Revenue (USD Million), and Market Share (%) by Applications (2023-2030)
11 Global Marketing Animation Video Production Development Regional Status and Outlook Forecast
11.1 Global Marketing Animation Video Production Revenue (USD Million) By Regions (2023-2030)
11.2 North America Marketing Animation Video Production Revenue (USD Million) by Type, and Applications (2023-2030)
11.2.1 North America Marketing Animation Video Production Revenue (USD) Million by Country (2023-2030)
11.2.2 North America Marketing Animation Video Production Revenue (USD Million), by Type (2023-2030)
11.2.3 North America Marketing Animation Video Production Revenue (USD Million), Market Share (%) by Applications (2023-2030)
11.3 Europe Marketing Animation Video Production Revenue (USD Million), by Type, and Applications (2023-2030)
11.3.1 Europe Marketing Animation Video Production Revenue (USD Million), by Country (2023-2030)
11.3.2 Europe Marketing Animation Video Production Revenue (USD Million), by Type (2023-2030)
11.3.3 Europe Marketing Animation Video Production Revenue (USD Million), by Applications (2023-2030)
11.4 Asia Pacific Marketing Animation Video Production Revenue (USD Million) by Type, and Applications (2023-2030)
11.4.1 Asia Pacific Marketing Animation Video Production Revenue (USD Million), by Country (2023-2030)
11.4.2 Asia Pacific Marketing Animation Video Production Revenue (USD Million), by Type (2023-2030)
11.4.3 Asia Pacific Marketing Animation Video Production Revenue (USD Million), by Applications (2023-2030)
11.5 South America Marketing Animation Video Production Revenue (USD Million), by Type, and Applications (2023-2030)
11.5.1 South America Marketing Animation Video Production Revenue (USD Million), by Country (2023-2030)
11.5.2 South America Marketing Animation Video Production Revenue (USD Million), by Type (2023-2030)
11.5.3 South America Marketing Animation Video Production Revenue (USD Million), by Applications (2023-2030)
11.6 Middle East and Africa Marketing Animation Video Production Revenue (USD Million), by Type, and Applications (2023-2030)
11.6.1 Middle East and Africa Marketing Animation Video Production Revenue (USD Million), by region (2023-2030)
11.6.2 Middle East and Africa Marketing Animation Video Production Revenue (USD Million), by Type (2023-2030)
11.6.3 Middle East and Africa Marketing Animation Video Production Revenue (USD Million), by Applications (2023-2030)
12 Methodology and Data Sources
12.1 Methodology/Research Approach
12.1.1 Research Programs/Design
12.1.2 Market Size Estimation
12.1.3 Market Breakdown and Data Triangulation
12.2 Data Sources
12.2.1 Secondary Sources
12.2.2 Primary Sources
12.3 Disclaimer
List of Tables
Table 1 Market Segmentation Analysis
Table 2 Global Marketing Animation Video Production Market Companies with Areas Served
Table 3 Products Offerings Global Marketing Animation Video Production Market
Table 4 Low Growth Scenario Forecasts
Table 5 Reference Case Growth Scenario
Table 6 High Growth Case Scenario
Table 7 Global Marketing Animation Video Production Revenue (USD Million) And CAGR (%) By Type (2018-2030)
Table 8 Global Marketing Animation Video Production Revenue (USD Million) And CAGR (%) By Applications (2018-2030)
Table 9 Global Marketing Animation Video Production Revenue (USD Million) And CAGR (%) By Regions (2018-2030)
Table 10 Global Marketing Animation Video Production Revenue (USD Million) By Type (2018-2022)
Table 11 Global Marketing Animation Video Production Revenue Market Share (%) By Type (2018-2022)
Table 12 Global Marketing Animation Video Production Revenue (USD Million) By Applications (2018-2022)
Table 13 Global Marketing Animation Video Production Revenue Market Share (%) By Applications (2018-2022)
Table 14 Global Marketing Animation Video Production Market Revenue (USD Million) By Regions (2018-2022)
Table 15 Global Marketing Animation Video Production Market Share (%) By Regions (2018-2022)
Table 16 North America Marketing Animation Video Production Revenue (USD Million) By Country (2018-2022)
Table 17 North America Marketing Animation Video Production Revenue (USD Million) By Type (2018-2022)
Table 18 North America Marketing Animation Video Production Revenue (USD Million) By Applications (2018-2022)
Table 19 Europe Marketing Animation Video Production Revenue (USD Million) By Country (2018-2022)
Table 20 Europe Marketing Animation Video Production Revenue (USD Million) By Type (2018-2022)
Table 21 Europe Marketing Animation Video Production Revenue (USD Million) By Applications (2018-2022)
Table 22 Asia Pacific Marketing Animation Video Production Revenue (USD Million) By Country (2018-2022)
Table 23 Asia Pacific Marketing Animation Video Production Revenue (USD Million) By Type (2018-2022)
Table 24 Asia Pacific Marketing Animation Video Production Revenue (USD Million) By Applications (2018-2022)
Table 25 South America Marketing Animation Video Production Revenue (USD Million) By Country (2018-2022)
Table 26 South America Marketing Animation Video Production Revenue (USD Million) By Type (2018-2022)
Table 27 South America Marketing Animation Video Production Revenue (USD Million) By Applications (2018-2022)
Table 28 Middle East and Africa Marketing Animation Video Production Revenue (USD Million) By Region (2018-2022)
Table 29 Middle East and Africa Marketing Animation Video Production Revenue (USD Million) By Type (2018-2022)
Table 30 Middle East and Africa Marketing Animation Video Production Revenue (USD Million) By Applications (2018-2022)
Table 31 Financial Analysis
Table 32 Global Marketing Animation Video Production Revenue (USD Million) By Type (2023-2030)
Table 33 Global Marketing Animation Video Production Revenue Market Share (%) By Type (2023-2030)
Table 34 Global Marketing Animation Video Production Revenue (USD Million) By Applications (2023-2030)
Table 35 Global Marketing Animation Video Production Revenue Market Share (%) By Applications (2023-2030)
Table 36 Global Marketing Animation Video Production Market Revenue (USD Million), And Revenue (USD Million) By Regions (2023-2030)
Table 37 North America Marketing Animation Video Production Revenue (USD)By Country (2023-2030)
Table 38 North America Marketing Animation Video Production Revenue (USD Million) By Type (2023-2030)
Table 39 North America Marketing Animation Video Production Revenue (USD Million) By Applications (2023-2030)
Table 40 Europe Marketing Animation Video Production Revenue (USD Million) By Country (2023-2030)
Table 41 Europe Marketing Animation Video Production Revenue (USD Million) By Type (2023-2030)
Table 42 Europe Marketing Animation Video Production Revenue (USD Million) By Applications (2023-2030)
Table 43 Asia Pacific Marketing Animation Video Production Revenue (USD Million) By Country (2023-2030)
Table 44 Asia Pacific Marketing Animation Video Production Revenue (USD Million) By Type (2023-2030)
Table 45 Asia Pacific Marketing Animation Video Production Revenue (USD Million) By Applications (2023-2030)
Table 46 South America Marketing Animation Video Production Revenue (USD Million) By Country (2023-2030)
Table 47 South America Marketing Animation Video Production Revenue (USD Million) By Type (2023-2030)
Table 48 South America Marketing Animation Video Production Revenue (USD Million) By Applications (2023-2030)
Table 49 Middle East and Africa Marketing Animation Video Production Revenue (USD Million) By Region (2023-2030)
Table 50 Middle East and Africa Marketing Animation Video Production Revenue (USD Million) By Region (2023-2030)
Table 51 Middle East and Africa Marketing Animation Video Production Revenue (USD Million) By Type (2023-2030)
Table 52 Middle East and Africa Marketing Animation Video Production Revenue (USD Million) By Applications (2023-2030)
Table 53 Research Programs/Design for This Report
Table 54 Key Data Information from Secondary Sources
Table 55 Key Data Information from Primary Sources
List of Figures
Figure 1 Market Scope
Figure 2 Porter’s Five Forces
Figure 3 Global Marketing Animation Video Production Revenue (USD Million) By Type (2018-2022)
Figure 4 Global Marketing Animation Video Production Revenue Market Share (%) By Type (2022)
Figure 5 Global Marketing Animation Video Production Revenue (USD Million) By Applications (2018-2022)
Figure 6 Global Marketing Animation Video Production Revenue Market Share (%) By Applications (2022)
Figure 7 Global Marketing Animation Video Production Market Revenue (USD Million) By Regions (2018-2022)
Figure 8 Global Marketing Animation Video Production Market Share (%) By Regions (2022)
Figure 9 North America Marketing Animation Video Production Revenue (USD Million) By Country (2018-2022)
Figure 10 North America Marketing Animation Video Production Revenue (USD Million) By Type (2018-2022)
Figure 11 North America Marketing Animation Video Production Revenue (USD Million) By Applications (2018-2022)
Figure 12 Europe Marketing Animation Video Production Revenue (USD Million) By Country (2018-2022)
Figure 13 Europe Marketing Animation Video Production Revenue (USD Million) By Type (2018-2022)
Figure 14 Europe Marketing Animation Video Production Revenue (USD Million) By Applications (2018-2022)
Figure 15 Asia Pacific Marketing Animation Video Production Revenue (USD Million) By Country (2018-2022)
Figure 16 Asia Pacific Marketing Animation Video Production Revenue (USD Million) By Type (2018-2022)
Figure 17 Asia Pacific Marketing Animation Video Production Revenue (USD Million) By Applications (2018-2022)
Figure 18 South America Marketing Animation Video Production Revenue (USD Million) By Country (2018-2022)
Figure 19 South America Marketing Animation Video Production Revenue (USD Million) By Type (2018-2022)
Figure 20 South America Marketing Animation Video Production Revenue (USD Million) By Applications (2018-2022)
Figure 21 Middle East and Africa Marketing Animation Video Production Revenue (USD Million) By Region (2018-2022)
Figure 22 Middle East and Africa Marketing Animation Video Production Revenue (USD Million) By Type (2018-2022)
Figure 23 Middle East and Africa Marketing Animation Video Production Revenue (USD Million) By Applications (2018-2022)
Figure 24 Global Marketing Animation Video Production Revenue (USD Million) By Type (2023-2030)
Figure 25 Global Marketing Animation Video Production Revenue Market Share (%) By Type (2030)
Figure 26 Global Marketing Animation Video Production Revenue (USD Million) By Applications (2023-2030)
Figure 27 Global Marketing Animation Video Production Revenue Market Share (%) By Applications (2030)
Figure 28 Global Marketing Animation Video Production Market Revenue (USD Million) By Regions (2023-2030)
Figure 29 North America Marketing Animation Video Production Revenue (USD Million) By Country (2023-2030)
Figure 30 North America Marketing Animation Video Production Revenue (USD Million) By Type (2023-2030)
Figure 31 North America Marketing Animation Video Production Revenue (USD Million) By Applications (2023-2030)
Figure 32 Europe Marketing Animation Video Production Revenue (USD Million) By Country (2023-2030)
Figure 33 Europe Marketing Animation Video Production Revenue (USD Million) By Type (2023-2030)
Figure 34 Europe Marketing Animation Video Production Revenue (USD Million) By Applications (2023-2030)
Figure 35 Asia Pacific Marketing Animation Video Production Revenue (USD Million) By Country (2023-2030)
Figure 36 Asia Pacific Marketing Animation Video Production Revenue (USD Million) By Type (2023-2030)
Figure 37 Asia Pacific Marketing Animation Video Production Revenue (USD Million) By Applications (2023-2030)
Figure 38 South America Marketing Animation Video Production Revenue (USD Million) By Country (2023-2030)
Figure 39 South America Marketing Animation Video Production Revenue (USD Million) By Type (2023-2030)
Figure 40 South America Marketing Animation Video Production Revenue (USD Million) By Applications (2023-2030)
Figure 41 Middle East and Africa Marketing Animation Video Production Revenue (USD Million) By Region (2023-2030)
Figure 42 Middle East and Africa Marketing Animation Video Production Revenue (USD Million) By Region (2023-2030)
Figure 43 Middle East and Africa Marketing Animation Video Production Revenue (USD Million) By Type (2023-2030)
Figure 44 Middle East and Africa Marketing Animation Video Production Revenue (USD Million) By Applications (2023-2030)
Figure 45 Bottom-Up and Top-Down Approaches for This Report
Figure 46 Data Triangulation
