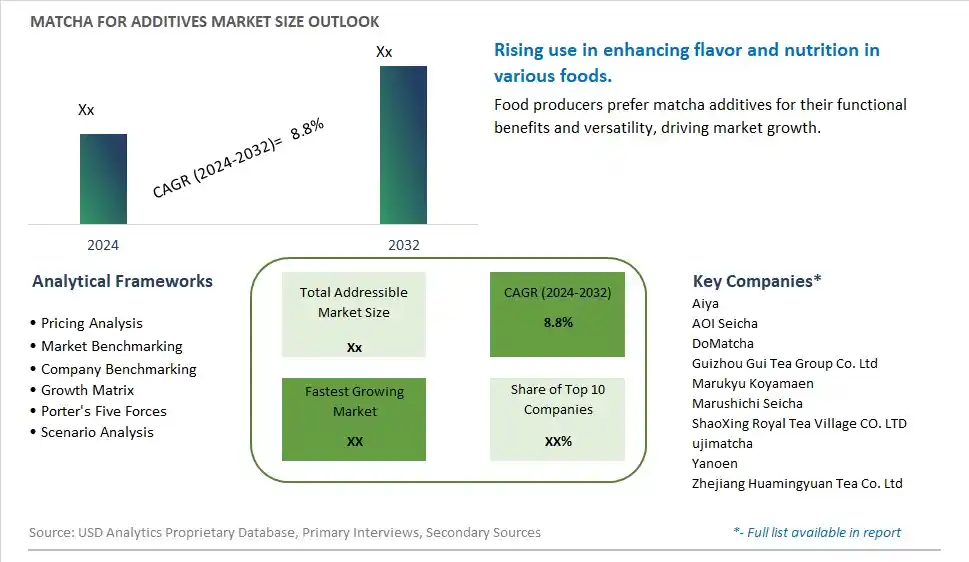
Global Matcha for Additives Market Size is valued at $XX Million in 2024 and is forecast to register a growth rate (CAGR) of 8.8% to reach $XX Million by 2032.
The global Matcha for Additives Market Comprehensive Study analyzes and forecasts the market size across 6 regions and 24 countries for diverse segments -By Type (Food Additives, Drink Additives, Others), By Application (Tea, Pastry, Ice Cream, Beverage)
An Introduction to Matcha for Additives Market
The matcha for additives market in 2024 is expanding rapidly, driven by the demand for natural and functional ingredients in food, beverages, and cosmetics. Matcha, a finely ground green tea powder, is valued for its vibrant color, rich flavor, and health benefits. The market benefits from innovations in matcha production and formulation that enhance its application as an additive. The trend towards clean label and natural ingredients is influencing product development. Increasing consumer awareness of the health benefits of matcha and the popularity of functional foods and beverages are further propelling market growth.
Matcha for Additives Competitive Landscape
The market report analyses the leading companies in the industry including Aiya, AOI Seicha, DoMatcha, Guizhou Gui Tea Group Co. Ltd, Marukyu Koyamaen, Marushichi Seicha, ShaoXing Royal Tea Village CO. LTD, ujimatcha, Yanoen, Zhejiang Huamingyuan Tea Co. Ltd, and Others.
Matcha for Additives Market Dynamics
Matcha for Additives Market Trend: Increasing Use of Matcha as a Functional Additive
The most prominent trend in the Matcha for Additives Market is the increasing use of matcha as a functional additive. Matcha, valued for its vibrant color, unique flavor, and health benefits, is becoming a popular additive in a variety of products, including beverages, baked goods, and supplements. This trend is driven by the demand for natural and functional ingredients that enhance product quality.
Matcha for Additives Market Driver: Rising Health Consciousness
A key driver in the Matcha for Additives Market is rising health consciousness among consumers. As people become more aware of the benefits of incorporating superfoods into their diet, there is a growing demand for products that contain matcha. This driver supports the use of matcha as an additive in health-focused products, driving market growth.
Matcha for Additives Market Opportunity: Expansion into Diverse Product Categories
One significant opportunity in the Matcha for Additives Market lies in the expansion into diverse product categories. Companies can innovate by incorporating matcha into a variety of applications, such as ready-to-drink beverages, energy bars, and skincare products. By leveraging the versatility and health benefits of matcha, manufacturers can attract health-conscious consumers and drive market growth.
Matcha for Additives Market Share Analysis: Drink Additives segment generated the highest revenue share in the industry
Drink additives emerge as the largest segment within the Matcha for Additives Market. This dominance is driven by the increasing incorporation of matcha into beverages, including smoothies, lattes, and energy drinks. Matcha's rich green color and earthy flavor profile make it a popular choice for enhancing both the visual appeal and nutritional value of drinks. As consumers seek healthier alternatives to traditional sugary beverages, matcha drink additives offer antioxidants and other health benefits associated with green tea. The versatility of matcha as a drink additive allows it to be blended with various ingredients, appealing to a wide demographic ranging from health-conscious individuals to those looking for premium and exotic beverage options. Its prevalence in cafes, juice bars, and packaged beverage products underscores its leading position in the market.
Matcha for Additives Market Share Analysis: Ice Cream Application is the fastest growing segment over the forecast period to 2032
Matcha for additives in the ice cream application is anticipated to be the fastest growing segment in the Matcha for Additives Market by 2032. This growth is fueled by the rising popularity of matcha-flavored desserts and the increasing consumer demand for innovative ice cream flavors. Matcha's distinctive taste and vibrant green color make it a sought-after ingredient in premium and artisanal ice creams, appealing to consumers looking for unique and indulgent treats. The antioxidant properties of matcha also contribute to its appeal in the ice cream segment, offering health-conscious consumers a guilt-free dessert option. Manufacturers are responding to this trend by introducing matcha-infused ice cream products and expanding distribution through retail channels and specialty dessert shops. As consumer preferences continue to evolve towards exotic and health-oriented flavors, matcha for additives in ice cream is poised to experience significant growth, driven by its flavor versatility and nutritional benefits.
Matcha for Additives Market Segmentation
By Type
Food Additives
Drink Additives
Others
By Application
Tea
Pastry
Ice Cream
Beverage
Countries Analyzed
North America (US, Canada, Mexico)
Europe (Germany, UK, France, Spain, Italy, Russia, Rest of Europe)
Asia Pacific (China, India, Japan, South Korea, Australia, South East Asia, Rest of Asia)
South America (Brazil, Argentina, Rest of South America)
Middle East and Africa (Saudi Arabia, UAE, Rest of Middle East, South Africa, Egypt, Rest of Africa)
Matcha for Additives Companies Profiled in the Study
Aiya
AOI Seicha
DoMatcha
Guizhou Gui Tea Group Co. Ltd
Marukyu Koyamaen
Marushichi Seicha
ShaoXing Royal Tea Village CO. LTD
ujimatcha
Yanoen
Zhejiang Huamingyuan Tea Co. Ltd
*- List Not Exhaustive
Chapter 1. TABLE OF CONTENTS
Chapter 2. Introduction to Matcha for Additives Market
2.1. Market Overview
2.2. Key Statistics and Report Highlights
2.3. Scope of the Comprehensive Study
2.3.1. Market Definition
2.3.2 Countries and Regions Covered
2.3.3 Research Objective
2.3.4 Units, Currency, and Conversions
2.3.5 Industry Value Chain
2.4. Key Market Segments
2.5. Key Companies
2.6. Study Period
Chapter 3. Strategic Analysis Review
3.1. Matcha for Additives Pricing Analysis and Forecast
3.2. Porter’s Five Forces
3.3. Market Ecosystem
3.4. SWOT Analysis
3.5. Regulatory Scenario
3.3. Effects of Inflation, Russia-Ukraine War, moderating economic growth, and other macroeconomic factors
Chapter 4. Competitive Landscape
4.1. Market Share Analysis
4.1.1. Global Matcha for Additives Market Share by Company, 2023
4.1.2. Product Offerings of Leading Matcha for Additives Companies
4.2. Market Entropy
4.2.1. New Product Launches in the Industry
4.2.2. Mergers, Acquisitions, Joint ventures, and Partnerships
4.3. Key Strategies and Best Practices
Chapter 5. Global Market Projections: Best, Reference, and Low Case Scenarios
5.1. Growth Analysis- Case Scenario Definitions
5.2. Low Growth Case Scenario Forecasts
5.3. Reference Growth Case Scenario Forecasts
5.4. High Growth Case Scenario Forecasts
Chapter 6. Market Dynamics
6.1. Matcha for Additives Market Drivers
6.2. Matcha for Additives Market Challenges
6.6. Matcha for Additives Market Opportunities
6.4. Matcha for Additives Market Trends
Chapter 7. Global Matcha for Additives Market Outlook Trends
7.1. Global Matcha for Additives Revenue (USD Million) and CAGR (%) by Type (2021-2032)
7.2. Global Matcha for Additives Revenue (USD Million) and CAGR (%) by Application (2021-2032)
7.3. Global Matcha for Additives Revenue (USD Million) and CAGR (%) by Product (2021-2032)
By Type
Food Additives
Drink Additives
Others
By Application
Tea
Pastry
Ice Cream
Beverage
Chapter 8. Global Matcha for Additives Regional Analysis and Outlook
8.1. Global Matcha for Additives Revenue (USD Million) By Regions (2021- 2032)
8.2. North America Matcha for Additives Revenue (USD Million) by Country (2021-2032)
8.2.1. United States Matcha for Additives Regional Analysis and Outlook
8.2.2. Canada Matcha for Additives Regional Analysis and Outlook
8.2.3. Mexico Matcha for Additives Regional Analysis and Outlook
8.3. Europe Matcha for Additives Revenue (USD Million), by Country (2021-2032)
8.3.1. Germany Matcha for Additives Regional Analysis and Outlook
8.3.2. France Matcha for Additives Regional Analysis and Outlook
8.3.3. United Kingdom Matcha for Additives Regional Analysis and Outlook
8.3.4. Spain Matcha for Additives Regional Analysis and Outlook
8.3.5. Italy Matcha for Additives Regional Analysis and Outlook
8.3.6. Russia Matcha for Additives Regional Analysis and Outlook
8.3.7. Rest of Europe Matcha for Additives Regional Analysis and Outlook
8.4. Asia Pacific Matcha for Additives Revenue (USD Million) by Country (2021-2032)
8.4.1. China Matcha for Additives Regional Analysis and Outlook
8.4.2. Japan Matcha for Additives Regional Analysis and Outlook
8.4.3. India Matcha for Additives Regional Analysis and Outlook
8.4.4. South Korea Matcha for Additives Regional Analysis and Outlook
8.4.5. Australia Matcha for Additives Regional Analysis and Outlook
8.4.6. South East Asia Matcha for Additives Regional Analysis and Outlook
8.4.7. Rest of Asia Pacific Matcha for Additives Regional Analysis and Outlook
8.5. South America Matcha for Additives Revenue (USD Million), by Country (2021-2032)
8.5.1. Brazil Matcha for Additives Regional Analysis and Outlook
8.5.2. Argentina Matcha for Additives Regional Analysis and Outlook
8.5.3. Rest of South America Matcha for Additives Regional Analysis and Outlook
8.6. Middle East and Africa Matcha for Additives Revenue (USD Million) by Country (2021-2032)
8.6.1. Middle East Matcha for Additives Regional Analysis and Outlook
8.6.2. Africa Matcha for Additives Regional Analysis and Outlook
Chapter 9. North America Matcha for Additives Analysis and Outlook
9.1. North America Matcha for Additives Revenue (USD Million) by Segments (2021-2032)
9.1.1. North America Matcha for Additives Revenue (USD Million) by Type (2021-2032)
9.1.2. North America Matcha for Additives Revenue (USD Million) by Application (2021-2032)
9.1.3. North America Matcha for Additives Revenue (USD Million) by Product (2021-2032)
By Type
Food Additives
Drink Additives
Others
By Application
Tea
Pastry
Ice Cream
Beverage
Chapter 10. Europe Matcha for Additives Analysis and Outlook
10.1. Europe Matcha for Additives Revenue (USD Million), by Segments (USD Million) (2021-2032)
10.1.1. Europe Matcha for Additives Revenue (USD Million) by Type (2021-2032)
10.1.2. Europe Matcha for Additives Revenue (USD Million) by Application (2021-2032)
10.1.3. Europe Matcha for Additives Revenue (USD Million) by Product (2021-2032)
By Type
Food Additives
Drink Additives
Others
By Application
Tea
Pastry
Ice Cream
Beverage
Chapter 11. Asia Pacific Matcha for Additives Analysis and Outlook
11.1. Asia Pacific Matcha for Additives Revenue (USD Million), and Revenue (USD Million) by Segments (2021-2032)
11.1.1. Asia Pacific Matcha for Additives Revenue (USD Million) by Type (2021-2032)
11.1.2. Asia Pacific Matcha for Additives Revenue (USD Million) by Application (2021-2032)
11.1.3. Asia Pacific Matcha for Additives Revenue (USD Million) by Product (2021-2032)
By Type
Food Additives
Drink Additives
Others
By Application
Tea
Pastry
Ice Cream
Beverage
Chapter 12. South America Matcha for Additives Analysis and Outlook
12.1. South America Matcha for Additives Revenue (USD Million), by Segments (2021-2032)
12.1.1. South America Matcha for Additives Revenue (USD Million) by Type (2021-2032)
12.1.2. South America Matcha for Additives Revenue (USD Million) by Application (2021-2032)
12.1.3. South America Matcha for Additives Revenue (USD Million) by Product (2021-2032)
By Type
Food Additives
Drink Additives
Others
By Application
Tea
Pastry
Ice Cream
Beverage
Chapter 13. Middle East and Africa Matcha for Additives Analysis and Outlook
13.1. Middle East and Africa Matcha for Additives Revenue (USD Million), by Segments (2021-2032)
13.1.1. Middle East and Africa Matcha for Additives Revenue (USD Million) by Type (2021-2032)
13.1.2. Middle East and Africa Matcha for Additives Revenue (USD Million) by Application (2021-2032)
13.1.3. Middle East and Africa Matcha for Additives Revenue (USD Million) by Product (2021-2032)
By Type
Food Additives
Drink Additives
Others
By Application
Tea
Pastry
Ice Cream
Beverage
Chapter 14. Matcha for Additives Company Profiles
14.1 Business Overview
14.2 Product Profiles
14.3 SWOT Profiles
14.5 Recent Developments
14.6 Financial Profile
List of Companies
Aiya
AOI Seicha
DoMatcha
Guizhou Gui Tea Group Co. Ltd
Marukyu Koyamaen
Marushichi Seicha
ShaoXing Royal Tea Village CO. LTD
ujimatcha
Yanoen
Zhejiang Huamingyuan Tea Co. Ltd
15. Methodology and Data Sources
15.1 Customization Offerings
15.2 Subscription Services
15.3 Related Reports
15.4 Publisher Expertise
LIST OF TABLES
Table 1 Market Segmentation Analysis
Table 2 Global Matcha for Additives Market Share of Leading Companies, 2023
Table 3 Product Offerings of Leading Companies
Table 4 Low Growth Scenario Forecasts
Table 5 Reference Case Growth Scenario
Table 6 High Growth Case Scenario
Table 7 Global Matcha for Additives Revenue (USD Million) And CAGR (%) By Type (2021-2032)
Table 8 Global Matcha for Additives Revenue (USD Million) And CAGR (%) By Application (2021-2032)
Table 9 Global Matcha for Additives Revenue (USD Million) And CAGR (%) By Product (2021-2032)
Table 10 Global Matcha for Additives Market Revenue (USD Million) By Regions (2021-2032)
Table 11 Global Matcha for Additives Market Share (%) By Regions (2021-2032)
Table 12 North America Matcha for Additives Revenue (USD Million) By Country (2021-2032)
Table 13 Europe Matcha for Additives Revenue (USD Million) By Country (2021-2032)
Table 14 Asia Pacific Matcha for Additives Revenue (USD Million) By Country (2021-2032)
Table 15 South America Matcha for Additives Revenue (USD Million) By Country (2021-2032)
Table 16 Middle East and Africa Matcha for Additives Revenue (USD Million) By Region (2021-2032)
Table 17 North America Matcha for Additives Revenue (USD Million) By Type (2021-2032)
Table 18 North America Matcha for Additives Revenue (USD Million) By Application (2021-2032)
Table 19 North America Matcha for Additives Revenue (USD Million) By Product (2021-2032)
Table 20 Europe Matcha for Additives Revenue (USD Million) By Type (2021-2032)
Table 21 Europe Matcha for Additives Revenue (USD Million) By Application (2021-2032)
Table 22 Europe Matcha for Additives Revenue (USD Million) By Product (2021-2032)
Table 23 Asia Pacific Matcha for Additives Revenue (USD Million) By Type (2021-2032)
Table 24 Asia Pacific Matcha for Additives Revenue (USD Million) By Application (2021-2032)
Table 25 Asia Pacific Matcha for Additives Revenue (USD Million) By Product (2021-2032)
Table 26 South America Matcha for Additives Revenue (USD Million) By Type (2021-2032)
Table 27 South America Matcha for Additives Revenue (USD Million) By Application (2021-2032)
Table 28 South America Matcha for Additives Revenue (USD Million) By Product (2021-2032)
Table 29 Middle East and Africa Matcha for Additives Revenue (USD Million) By Type (2021-2032)
Table 30 Middle East and Africa Matcha for Additives Revenue (USD Million) By Application (2021-2032)
Table 31 Middle East and Africa Matcha for Additives Revenue (USD Million) By Product (2021-2032)
LIST OF FIGURES
Figure 1. Market Scope
Figure 2. Pricing Forecasts Per Unit, 2023- 2032
Figure 3. Porter’s Five Forces
Figure 4. Global Matcha for Additives Market Revenue (USD Million) By Regions (2021-2032)
Figure 5. Global Matcha for Additives Market Share (%) By Regions (2023)
Figure 6. North America Matcha for Additives Revenue (USD Million) By Country (2021-2032)
Figure 7. United States Matcha for Additives Revenue (USD Million) By Country (2021-2032)
Figure 8. Canada Matcha for Additives Revenue (USD Million) By Country (2021-2032)
Figure 9. Mexico Matcha for Additives Revenue (USD Million) By Country (2021-2032)
Figure 10. Europe Matcha for Additives Revenue (USD Million) By Country (2021-2032)
Figure 11. Germany Matcha for Additives Revenue (USD Million) By Country (2021-2032)
Figure 12. France Matcha for Additives Revenue (USD Million) By Country (2021-2032)
Figure 13. United Kingdom Matcha for Additives Revenue (USD Million) By Country (2021-2032)
Figure 14. Spain Matcha for Additives Revenue (USD Million) By Country (2021-2032)
Figure 15. Italy Matcha for Additives Revenue (USD Million) By Country (2021-2032)
Figure 16. Russia Matcha for Additives Revenue (USD Million) By Country (2021-2032)
Figure 17. Rest of Europe Matcha for Additives Revenue (USD Million) By Country (2021-2032)
Figure 11. Asia Pacific Matcha for Additives Revenue (USD Million) By Country (2021-2032)
Figure 12. China Matcha for Additives Revenue (USD Million) By Country (2021-2032)
Figure 13. Japan Matcha for Additives Revenue (USD Million) By Country (2021-2032)
Figure 14. India Matcha for Additives Revenue (USD Million) By Country (2021-2032)
Figure 15. South Korea Matcha for Additives Revenue (USD Million) By Country (2021-2032)
Figure 16. Australia Matcha for Additives Revenue (USD Million) By Country (2021-2032)
Figure 17. South East Asia Matcha for Additives Revenue (USD Million) By Country (2021-2032)
Figure 18. South America Matcha for Additives Revenue (USD Million) By Country (2021-2032)
Figure 19. Brazil Matcha for Additives Revenue (USD Million) By Country (2021-2032)
Figure 20. Argentina Matcha for Additives Revenue (USD Million) By Country (2021-2032)
Figure 21. Rest of Asia Pacific Matcha for Additives Revenue (USD Million) By Country (2021-2032)
Figure 22. Middle East and Africa Matcha for Additives Revenue (USD Million) By Region (2021-2032)
Figure 23. Saudi Arabia Matcha for Additives Revenue (USD Million) By Region (2021-2032)
Figure 24. The UAE Matcha for Additives Revenue (USD Million) By Region (2021-2032)
Figure 25. Rest of Middle East Matcha for Additives Revenue (USD Million) By Region (2021-2032)
Figure 26. South Africa Matcha for Additives Revenue (USD Million) By Region (2021-2032)
Figure 27. Africa Matcha for Additives Revenue (USD Million) By Region (2021-2032)
Figure 28. North America Matcha for Additives Revenue (USD Million) By Type (2021-2032)
Figure 29. North America Matcha for Additives Revenue (USD Million) By Application (2021-2032)
Figure 30. North America Matcha for Additives Revenue (USD Million) By Product (2021-2032)
Figure 31. Europe Matcha for Additives Revenue (USD Million) By Type (2021-2032)
Figure 32. Europe Matcha for Additives Revenue (USD Million) By Application (2021-2032)
Figure 33. Europe Matcha for Additives Revenue (USD Million) By Product (2021-2032)
Figure 34. Asia Pacific Matcha for Additives Revenue (USD Million) By Type (2021-2032)
Figure 35. Asia Pacific Matcha for Additives Revenue (USD Million) By Application (2021-2032)
Figure 36. Asia Pacific Matcha for Additives Revenue (USD Million) By Product (2021-2032)
Figure 37. South America Matcha for Additives Revenue (USD Million) By Type (2021-2032)
Figure 38. South America Matcha for Additives Revenue (USD Million) By Application (2021-2032)
Figure 39. South America Matcha for Additives Revenue (USD Million) By Product (2021-2032)
Figure 40. Middle East and Africa Matcha for Additives Revenue (USD Million) By Type (2021-2032)
Figure 41. Middle East and Africa Matcha for Additives Revenue (USD Million) By Application (2021-2032)
Figure 42. Middle East and Africa Matcha for Additives Revenue (USD Million) By Product (2021-2032)
By Type
Food Additives
Drink Additives
Others
By Application
Tea
Pastry
Ice Cream
Beverage
Countries Analyzed
North America (US, Canada, Mexico)
Europe (Germany, UK, France, Spain, Italy, Russia, Rest of Europe)
Asia Pacific (China, India, Japan, South Korea, Australia, South East Asia, Rest of Asia)
South America (Brazil, Argentina, Rest of South America)
Middle East and Africa (Saudi Arabia, UAE, Rest of Middle East, South Africa, Egypt, Rest of Africa)
