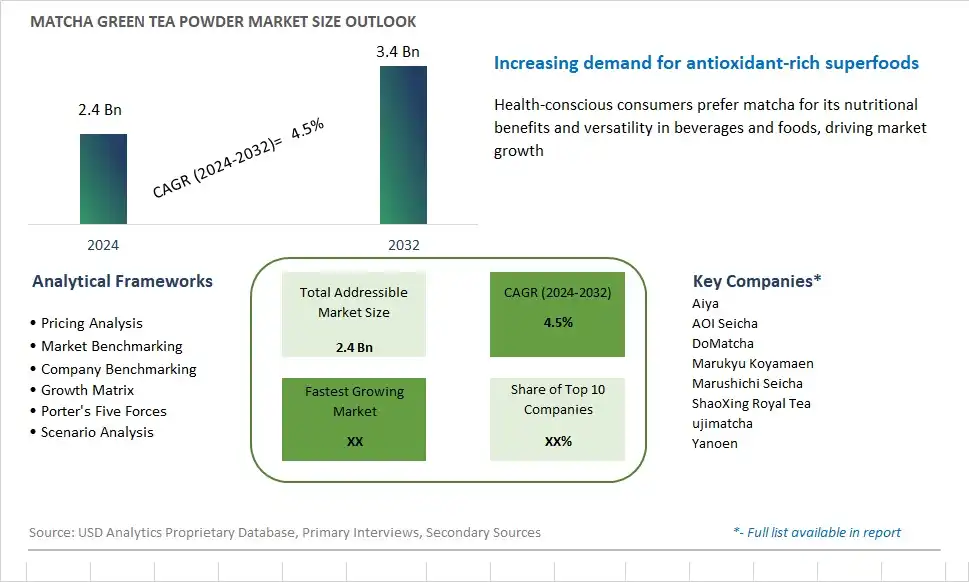
Global Matcha Green Tea Powder Market Size is valued at $2.4 Billion in 2024 and is forecast to register a growth rate (CAGR) of 4.5% to reach $3.4 Billion by 2032.
The global Matcha Green Tea Powder Market Comprehensive Study analyzes and forecasts the market size across 6 regions and 24 countries for diverse segments -By Type (Drinking-use, Additive-use), By Application (Drinking Tea, Pastry, Ice Cream, Beverage)
An Introduction to Matcha Green Tea Powder Market
The popularity of matcha green tea powder continues to soar in 2024, driven by its potent health benefits and versatility. This finely ground green tea powder is renowned for its high concentration of antioxidants, vitamins, and minerals, making it a sought-after ingredient in beverages, baked goods, and skincare products. Health-conscious consumers are drawn to matcha for its potential to boost metabolism, enhance mental clarity, and promote relaxation without the jitters often associated with coffee. With increased awareness of its nutritional value, the market is witnessing a surge in demand for premium-grade ceremonial matcha as well as flavored varieties catering to diverse palates. As the market matures, expect to see further innovations in packaging, sustainability initiatives, and culinary applications.
Matcha Green Tea Powder Competitive Landscape
The market report analyses the leading companies in the industry including Aiya, AOI Seicha, DoMatcha, Marukyu Koyamaen, Marushichi Seicha, ShaoXing Royal Tea, ujimatcha, Yanoen, and Others.
Matcha Green Tea Powder Market Dynamics
Matcha Green Tea Powder Market Trend: Rise in Health and Wellness Consciousness
A prominent trend in the market for matcha green tea powder is the increasing emphasis on health and wellness. Matcha is celebrated for its high antioxidant content, vitamins, and minerals, making it a popular choice among health-conscious consumers. With a growing awareness of the health benefits associated with matcha consumption, including improved metabolism, enhanced concentration, and detoxification, demand for matcha green tea powder is on the rise. This trend is further fueled by the shift towards natural and functional ingredients in food and beverage products, as consumers seek ways to support their overall well-being through their dietary choices.
Market Driver: Expansion of the Specialty Tea Market
A key driver for the matcha green tea powder market is the expansion of the specialty tea market globally. Matcha's unique flavor profile, vibrant green color, and ceremonial significance make it a prized ingredient in the world of specialty teas. As consumers become more discerning about tea quality and provenance, there's a growing demand for premium-grade matcha sourced from reputable producers. Moreover, the versatility of matcha in culinary applications, such as lattes, smoothies, desserts, and savory dishes, contributes to its popularity among chefs, mixologists, and home cooks alike. This increasing adoption of matcha across various culinary domains drives market growth and diversification.
Market Opportunity: Innovation in Product Offerings and Applications
An opportunity for the matcha green tea powder market lies in innovation in product offerings and applications. With matcha gaining mainstream popularity beyond traditional tea ceremonies, there's room for brands to explore creative ways to incorporate matcha into new products and experiences. This could involve developing ready-to-drink matcha beverages, matcha-infused snacks, skincare products featuring matcha extracts, or even matcha-inspired culinary collaborations. By tapping into consumer preferences for convenience, flavor innovation, and functional benefits, companies can expand their market reach and appeal to a broader audience seeking novel ways to enjoy the health benefits and sensory delights of matcha green tea powder.
Matcha Green Tea Powder Market Share Analysis: Drinking-use held the dominant market share in 2024
In the matcha green tea powder market, the largest segment is drinking-use matcha green tea powder, driven by its popularity as a versatile and nutritious beverage. Drinking-use matcha green tea powder is specifically formulated and finely ground for optimal solubility in hot water, allowing consumers to enjoy traditional matcha tea rituals. This segment caters to the growing demand for healthy and functional beverages, as matcha tea is renowned for its high antioxidant content, potential health benefits, and distinctive flavor profile. Further, the rise of wellness trends and the increasing awareness of matcha's potential health-promoting properties, such as boosting metabolism and enhancing cognitive function, further contribute to the dominance of drinking-use matcha green tea powder in the market. Additionally, the convenience of matcha green tea powder allows consumers to easily incorporate it into their daily routines, whether enjoyed hot as a soothing beverage or cold as a refreshing drink, further driving its market share. As consumers continue to seek natural and functional alternatives to traditional beverages, drinking-use matcha green tea powder maintains its position as the largest segment in the market, driving sustained growth and market leadership within the industry.
Matcha Green Tea Powder Market Share Analysis: Ice Cream market is poised to register the fastest growth rae over the forecast period to 2032
Among the segments in the matcha green tea powder market, the ice cream application stands out as the fastest-growing, driven by the rising consumer demand for innovative and indulgent frozen treats. Matcha green tea powder lends a vibrant green color and a distinctive earthy flavor to ice cream, appealing to consumers seeking unique and flavorful desserts. Additionally, matcha's reputation as a superfood rich in antioxidants and potential health benefits adds to its appeal in ice cream formulations, attracting health-conscious consumers looking for guilt-free indulgence. Further, the growing popularity of matcha-flavored products across various food and beverage categories, coupled with the expansion of artisanal and premium ice cream brands, further accelerates the growth of matcha green tea powder in the ice cream application segment. As consumers continue to crave novel flavor experiences and prioritize wellness-inspired treats, the ice cream application emerges as a key driver of market expansion and innovation within the matcha green tea powder industry.
Matcha Green Tea Powder Market Segmentation
By Type
Drinking-use
Additive-use
By Application
Drinking Tea
Pastry
Ice Cream
Beverage
Countries Analyzed
North America (US, Canada, Mexico)
Europe (Germany, UK, France, Spain, Italy, Russia, Rest of Europe)
Asia Pacific (China, India, Japan, South Korea, Australia, South East Asia, Rest of Asia)
South America (Brazil, Argentina, Rest of South America)
Middle East and Africa (Saudi Arabia, UAE, Rest of Middle East, South Africa, Egypt, Rest of Africa)
Matcha Green Tea Powder Companies Profiled in the Study
Aiya
AOI Seicha
DoMatcha
Marukyu Koyamaen
Marushichi Seicha
ShaoXing Royal Tea
ujimatcha
Yanoen
*- List Not Exhaustive
Chapter 1. TABLE OF CONTENTS
Chapter 2. Introduction to Matcha Green Tea Powder Market
2.1. Market Overview
2.2. Key Statistics and Report Highlights
2.3. Scope of the Comprehensive Study
2.3.1. Market Definition
2.3.2 Countries and Regions Covered
2.3.3 Research Objective
2.3.4 Units, Currency, and Conversions
2.3.5 Industry Value Chain
2.4. Key Market Segments
2.5. Key Companies
2.6. Study Period
Chapter 3. Strategic Analysis Review
3.1. Matcha Green Tea Powder Pricing Analysis and Forecast
3.2. Porter’s Five Forces
3.3. Market Ecosystem
3.4. SWOT Analysis
3.5. Regulatory Scenario
3.3. Effects of Inflation, Russia-Ukraine War, moderating economic growth, and other macroeconomic factors
Chapter 4. Competitive Landscape
4.1. Market Share Analysis
4.1.1. Global Matcha Green Tea Powder Market Share by Company, 2023
4.1.2. Product Offerings of Leading Matcha Green Tea Powder Companies
4.2. Market Entropy
4.2.1. New Product Launches in the Industry
4.2.2. Mergers, Acquisitions, Joint ventures, and Partnerships
4.3. Key Strategies and Best Practices
Chapter 5. Global Market Projections: Best, Reference, and Low Case Scenarios
5.1. Growth Analysis- Case Scenario Definitions
5.2. Low Growth Case Scenario Forecasts
5.3. Reference Growth Case Scenario Forecasts
5.4. High Growth Case Scenario Forecasts
Chapter 6. Market Dynamics
6.1. Matcha Green Tea Powder Market Drivers
6.2. Matcha Green Tea Powder Market Challenges
6.6. Matcha Green Tea Powder Market Opportunities
6.4. Matcha Green Tea Powder Market Trends
Chapter 7. Global Matcha Green Tea Powder Market Outlook Trends
7.1. Global Matcha Green Tea Powder Revenue (USD Million) and CAGR (%) by Type (2021-2032)
7.2. Global Matcha Green Tea Powder Revenue (USD Million) and CAGR (%) by Application (2021-2032)
7.3. Global Matcha Green Tea Powder Revenue (USD Million) and CAGR (%) by Product (2021-2032)
By Type
Drinking-use
Additive-use
By Application
Drinking Tea
Pastry
Ice Cream
Beverage
Chapter 8. Global Matcha Green Tea Powder Regional Analysis and Outlook
8.1. Global Matcha Green Tea Powder Revenue (USD Million) By Regions (2021- 2032)
8.2. North America Matcha Green Tea Powder Revenue (USD Million) by Country (2021-2032)
8.2.1. United States Matcha Green Tea Powder Regional Analysis and Outlook
8.2.2. Canada Matcha Green Tea Powder Regional Analysis and Outlook
8.2.3. Mexico Matcha Green Tea Powder Regional Analysis and Outlook
8.3. Europe Matcha Green Tea Powder Revenue (USD Million), by Country (2021-2032)
8.3.1. Germany Matcha Green Tea Powder Regional Analysis and Outlook
8.3.2. France Matcha Green Tea Powder Regional Analysis and Outlook
8.3.3. United Kingdom Matcha Green Tea Powder Regional Analysis and Outlook
8.3.4. Spain Matcha Green Tea Powder Regional Analysis and Outlook
8.3.5. Italy Matcha Green Tea Powder Regional Analysis and Outlook
8.3.6. Russia Matcha Green Tea Powder Regional Analysis and Outlook
8.3.7. Rest of Europe Matcha Green Tea Powder Regional Analysis and Outlook
8.4. Asia Pacific Matcha Green Tea Powder Revenue (USD Million) by Country (2021-2032)
8.4.1. China Matcha Green Tea Powder Regional Analysis and Outlook
8.4.2. Japan Matcha Green Tea Powder Regional Analysis and Outlook
8.4.3. India Matcha Green Tea Powder Regional Analysis and Outlook
8.4.4. South Korea Matcha Green Tea Powder Regional Analysis and Outlook
8.4.5. Australia Matcha Green Tea Powder Regional Analysis and Outlook
8.4.6. South East Asia Matcha Green Tea Powder Regional Analysis and Outlook
8.4.7. Rest of Asia Pacific Matcha Green Tea Powder Regional Analysis and Outlook
8.5. South America Matcha Green Tea Powder Revenue (USD Million), by Country (2021-2032)
8.5.1. Brazil Matcha Green Tea Powder Regional Analysis and Outlook
8.5.2. Argentina Matcha Green Tea Powder Regional Analysis and Outlook
8.5.3. Rest of South America Matcha Green Tea Powder Regional Analysis and Outlook
8.6. Middle East and Africa Matcha Green Tea Powder Revenue (USD Million) by Country (2021-2032)
8.6.1. Middle East Matcha Green Tea Powder Regional Analysis and Outlook
8.6.2. Africa Matcha Green Tea Powder Regional Analysis and Outlook
Chapter 9. North America Matcha Green Tea Powder Analysis and Outlook
9.1. North America Matcha Green Tea Powder Revenue (USD Million) by Segments (2021-2032)
9.1.1. North America Matcha Green Tea Powder Revenue (USD Million) by Type (2021-2032)
9.1.2. North America Matcha Green Tea Powder Revenue (USD Million) by Application (2021-2032)
9.1.3. North America Matcha Green Tea Powder Revenue (USD Million) by Product (2021-2032)
By Type
Drinking-use
Additive-use
By Application
Drinking Tea
Pastry
Ice Cream
Beverage
Chapter 10. Europe Matcha Green Tea Powder Analysis and Outlook
10.1. Europe Matcha Green Tea Powder Revenue (USD Million), by Segments (USD Million) (2021-2032)
10.1.1. Europe Matcha Green Tea Powder Revenue (USD Million) by Type (2021-2032)
10.1.2. Europe Matcha Green Tea Powder Revenue (USD Million) by Application (2021-2032)
10.1.3. Europe Matcha Green Tea Powder Revenue (USD Million) by Product (2021-2032)
By Type
Drinking-use
Additive-use
By Application
Drinking Tea
Pastry
Ice Cream
Beverage
Chapter 11. Asia Pacific Matcha Green Tea Powder Analysis and Outlook
11.1. Asia Pacific Matcha Green Tea Powder Revenue (USD Million), and Revenue (USD Million) by Segments (2021-2032)
11.1.1. Asia Pacific Matcha Green Tea Powder Revenue (USD Million) by Type (2021-2032)
11.1.2. Asia Pacific Matcha Green Tea Powder Revenue (USD Million) by Application (2021-2032)
11.1.3. Asia Pacific Matcha Green Tea Powder Revenue (USD Million) by Product (2021-2032)
By Type
Drinking-use
Additive-use
By Application
Drinking Tea
Pastry
Ice Cream
Beverage
Chapter 12. South America Matcha Green Tea Powder Analysis and Outlook
12.1. South America Matcha Green Tea Powder Revenue (USD Million), by Segments (2021-2032)
12.1.1. South America Matcha Green Tea Powder Revenue (USD Million) by Type (2021-2032)
12.1.2. South America Matcha Green Tea Powder Revenue (USD Million) by Application (2021-2032)
12.1.3. South America Matcha Green Tea Powder Revenue (USD Million) by Product (2021-2032)
By Type
Drinking-use
Additive-use
By Application
Drinking Tea
Pastry
Ice Cream
Beverage
Chapter 13. Middle East and Africa Matcha Green Tea Powder Analysis and Outlook
13.1. Middle East and Africa Matcha Green Tea Powder Revenue (USD Million), by Segments (2021-2032)
13.1.1. Middle East and Africa Matcha Green Tea Powder Revenue (USD Million) by Type (2021-2032)
13.1.2. Middle East and Africa Matcha Green Tea Powder Revenue (USD Million) by Application (2021-2032)
13.1.3. Middle East and Africa Matcha Green Tea Powder Revenue (USD Million) by Product (2021-2032)
By Type
Drinking-use
Additive-use
By Application
Drinking Tea
Pastry
Ice Cream
Beverage
Chapter 14. Matcha Green Tea Powder Company Profiles
14.1 Business Overview
14.2 Product Profiles
14.3 SWOT Profiles
14.5 Recent Developments
14.6 Financial Profile
List of Companies
Aiya
AOI Seicha
DoMatcha
Marukyu Koyamaen
Marushichi Seicha
ShaoXing Royal Tea
ujimatcha
Yanoen
15. Methodology and Data Sources
15.1 Customization Offerings
15.2 Subscription Services
15.3 Related Reports
15.4 Publisher Expertise
LIST OF TABLES
Table 1 Market Segmentation Analysis
Table 2 Global Matcha Green Tea Powder Market Share of Leading Companies, 2023
Table 3 Product Offerings of Leading Companies
Table 4 Low Growth Scenario Forecasts
Table 5 Reference Case Growth Scenario
Table 6 High Growth Case Scenario
Table 7 Global Matcha Green Tea Powder Revenue (USD Million) And CAGR (%) By Type (2021-2032)
Table 8 Global Matcha Green Tea Powder Revenue (USD Million) And CAGR (%) By Application (2021-2032)
Table 9 Global Matcha Green Tea Powder Revenue (USD Million) And CAGR (%) By Product (2021-2032)
Table 10 Global Matcha Green Tea Powder Market Revenue (USD Million) By Regions (2021-2032)
Table 11 Global Matcha Green Tea Powder Market Share (%) By Regions (2021-2032)
Table 12 North America Matcha Green Tea Powder Revenue (USD Million) By Country (2021-2032)
Table 13 Europe Matcha Green Tea Powder Revenue (USD Million) By Country (2021-2032)
Table 14 Asia Pacific Matcha Green Tea Powder Revenue (USD Million) By Country (2021-2032)
Table 15 South America Matcha Green Tea Powder Revenue (USD Million) By Country (2021-2032)
Table 16 Middle East and Africa Matcha Green Tea Powder Revenue (USD Million) By Region (2021-2032)
Table 17 North America Matcha Green Tea Powder Revenue (USD Million) By Type (2021-2032)
Table 18 North America Matcha Green Tea Powder Revenue (USD Million) By Application (2021-2032)
Table 19 North America Matcha Green Tea Powder Revenue (USD Million) By Product (2021-2032)
Table 20 Europe Matcha Green Tea Powder Revenue (USD Million) By Type (2021-2032)
Table 21 Europe Matcha Green Tea Powder Revenue (USD Million) By Application (2021-2032)
Table 22 Europe Matcha Green Tea Powder Revenue (USD Million) By Product (2021-2032)
Table 23 Asia Pacific Matcha Green Tea Powder Revenue (USD Million) By Type (2021-2032)
Table 24 Asia Pacific Matcha Green Tea Powder Revenue (USD Million) By Application (2021-2032)
Table 25 Asia Pacific Matcha Green Tea Powder Revenue (USD Million) By Product (2021-2032)
Table 26 South America Matcha Green Tea Powder Revenue (USD Million) By Type (2021-2032)
Table 27 South America Matcha Green Tea Powder Revenue (USD Million) By Application (2021-2032)
Table 28 South America Matcha Green Tea Powder Revenue (USD Million) By Product (2021-2032)
Table 29 Middle East and Africa Matcha Green Tea Powder Revenue (USD Million) By Type (2021-2032)
Table 30 Middle East and Africa Matcha Green Tea Powder Revenue (USD Million) By Application (2021-2032)
Table 31 Middle East and Africa Matcha Green Tea Powder Revenue (USD Million) By Product (2021-2032)
LIST OF FIGURES
Figure 1. Market Scope
Figure 2. Pricing Forecasts Per Unit, 2023- 2032
Figure 3. Porter’s Five Forces
Figure 4. Global Matcha Green Tea Powder Market Revenue (USD Million) By Regions (2021-2032)
Figure 5. Global Matcha Green Tea Powder Market Share (%) By Regions (2023)
Figure 6. North America Matcha Green Tea Powder Revenue (USD Million) By Country (2021-2032)
Figure 7. United States Matcha Green Tea Powder Revenue (USD Million) By Country (2021-2032)
Figure 8. Canada Matcha Green Tea Powder Revenue (USD Million) By Country (2021-2032)
Figure 9. Mexico Matcha Green Tea Powder Revenue (USD Million) By Country (2021-2032)
Figure 10. Europe Matcha Green Tea Powder Revenue (USD Million) By Country (2021-2032)
Figure 11. Germany Matcha Green Tea Powder Revenue (USD Million) By Country (2021-2032)
Figure 12. France Matcha Green Tea Powder Revenue (USD Million) By Country (2021-2032)
Figure 13. United Kingdom Matcha Green Tea Powder Revenue (USD Million) By Country (2021-2032)
Figure 14. Spain Matcha Green Tea Powder Revenue (USD Million) By Country (2021-2032)
Figure 15. Italy Matcha Green Tea Powder Revenue (USD Million) By Country (2021-2032)
Figure 16. Russia Matcha Green Tea Powder Revenue (USD Million) By Country (2021-2032)
Figure 17. Rest of Europe Matcha Green Tea Powder Revenue (USD Million) By Country (2021-2032)
Figure 11. Asia Pacific Matcha Green Tea Powder Revenue (USD Million) By Country (2021-2032)
Figure 12. China Matcha Green Tea Powder Revenue (USD Million) By Country (2021-2032)
Figure 13. Japan Matcha Green Tea Powder Revenue (USD Million) By Country (2021-2032)
Figure 14. India Matcha Green Tea Powder Revenue (USD Million) By Country (2021-2032)
Figure 15. South Korea Matcha Green Tea Powder Revenue (USD Million) By Country (2021-2032)
Figure 16. Australia Matcha Green Tea Powder Revenue (USD Million) By Country (2021-2032)
Figure 17. South East Asia Matcha Green Tea Powder Revenue (USD Million) By Country (2021-2032)
Figure 18. South America Matcha Green Tea Powder Revenue (USD Million) By Country (2021-2032)
Figure 19. Brazil Matcha Green Tea Powder Revenue (USD Million) By Country (2021-2032)
Figure 20. Argentina Matcha Green Tea Powder Revenue (USD Million) By Country (2021-2032)
Figure 21. Rest of Asia Pacific Matcha Green Tea Powder Revenue (USD Million) By Country (2021-2032)
Figure 22. Middle East and Africa Matcha Green Tea Powder Revenue (USD Million) By Region (2021-2032)
Figure 23. Saudi Arabia Matcha Green Tea Powder Revenue (USD Million) By Region (2021-2032)
Figure 24. The UAE Matcha Green Tea Powder Revenue (USD Million) By Region (2021-2032)
Figure 25. Rest of Middle East Matcha Green Tea Powder Revenue (USD Million) By Region (2021-2032)
Figure 26. South Africa Matcha Green Tea Powder Revenue (USD Million) By Region (2021-2032)
Figure 27. Africa Matcha Green Tea Powder Revenue (USD Million) By Region (2021-2032)
Figure 28. North America Matcha Green Tea Powder Revenue (USD Million) By Type (2021-2032)
Figure 29. North America Matcha Green Tea Powder Revenue (USD Million) By Application (2021-2032)
Figure 30. North America Matcha Green Tea Powder Revenue (USD Million) By Product (2021-2032)
Figure 31. Europe Matcha Green Tea Powder Revenue (USD Million) By Type (2021-2032)
Figure 32. Europe Matcha Green Tea Powder Revenue (USD Million) By Application (2021-2032)
Figure 33. Europe Matcha Green Tea Powder Revenue (USD Million) By Product (2021-2032)
Figure 34. Asia Pacific Matcha Green Tea Powder Revenue (USD Million) By Type (2021-2032)
Figure 35. Asia Pacific Matcha Green Tea Powder Revenue (USD Million) By Application (2021-2032)
Figure 36. Asia Pacific Matcha Green Tea Powder Revenue (USD Million) By Product (2021-2032)
Figure 37. South America Matcha Green Tea Powder Revenue (USD Million) By Type (2021-2032)
Figure 38. South America Matcha Green Tea Powder Revenue (USD Million) By Application (2021-2032)
Figure 39. South America Matcha Green Tea Powder Revenue (USD Million) By Product (2021-2032)
Figure 40. Middle East and Africa Matcha Green Tea Powder Revenue (USD Million) By Type (2021-2032)
Figure 41. Middle East and Africa Matcha Green Tea Powder Revenue (USD Million) By Application (2021-2032)
Figure 42. Middle East and Africa Matcha Green Tea Powder Revenue (USD Million) By Product (2021-2032)
By Type
Drinking-use
Additive-use
By Application
Drinking Tea
Pastry
Ice Cream
Beverage
Countries Analyzed
North America (US, Canada, Mexico)
Europe (Germany, UK, France, Spain, Italy, Russia, Rest of Europe)
Asia Pacific (China, India, Japan, South Korea, Australia, South East Asia, Rest of Asia)
South America (Brazil, Argentina, Rest of South America)
Middle East and Africa (Saudi Arabia, UAE, Rest of Middle East, South Africa, Egypt, Rest of Africa)
