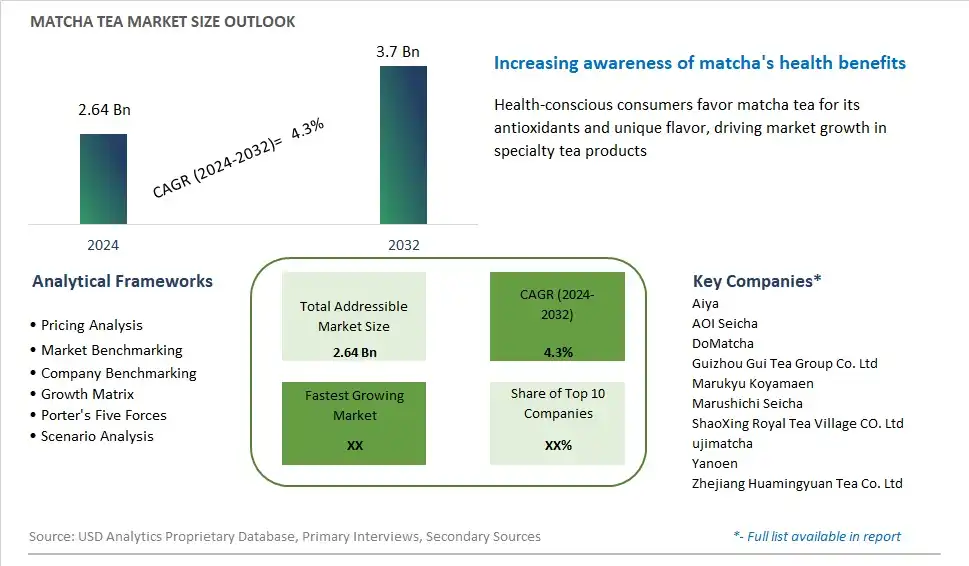
Global Matcha Tea Market Size is valued at $2.64 Billion in 2024 and is forecast to register a growth rate (CAGR) of 4.3% to reach $3.7 Billion by 2032.
The global Matcha Tea Market Comprehensive Study analyzes and forecasts the market size across 6 regions and 24 countries for diverse segments -By Product (Powder, RTD Beverage, Instant Premixes), By Grade (Classic, Ceremonial, Culinary)
An Introduction to Matcha Tea Market
In 2024, the matcha tea market continues to expand globally, driven by increasing consumer awareness of its health benefits and unique flavor profile. Matcha, a finely ground powder of specially grown and processed green tea leaves, is celebrated for its high antioxidant content, ability to boost metabolism, and potential to enhance mental clarity and focus. The market includes a variety of products, from traditional matcha tea and matcha-infused beverages to culinary-grade matcha used in baking and cooking. The trend towards holistic wellness and natural remedies has fueled the popularity of matcha as a superfood, with consumers seeking its detoxifying and energy-boosting properties. Premium and organic matcha products are particularly in demand, catering to discerning consumers who prioritize quality and sustainability. As matcha becomes a staple in the health and wellness sector, the market is poised for continued growth, with innovations in product offerings and expanding distribution channels enhancing its accessibility and appeal.
Matcha Tea Competitive Landscape
The market report analyses the leading companies in the industry including Aiya, AOI Seicha, DoMatcha, Guizhou Gui Tea Group Co. Ltd, Marukyu Koyamaen, Marushichi Seicha, ShaoXing Royal Tea Village CO. Ltd, ujimatcha, Yanoen, Zhejiang Huamingyuan Tea Co. Ltd, and Others.
Matcha Tea Market Dynamics
Matcha Tea Market Trend: Growing Popularity of Superfoods and Wellness Beverages
In the matcha tea market, a prominent trend is the growing popularity of superfoods and wellness beverages. Consumers are increasingly drawn to matcha tea due to its rich nutritional profile and numerous health benefits, including high antioxidant levels, detoxifying properties, and the presence of L-theanine, which promotes relaxation and mental clarity. This trend is driven by the rising awareness of health and wellness, with matcha being celebrated for its ability to boost metabolism, enhance mood, and provide sustained energy without the jitters associated with other caffeinated drinks. Social media and wellness influencers play a significant role in popularizing matcha tea, showcasing its versatility in recipes and its aesthetic appeal. As more people prioritize their health and seek functional beverages that contribute to their overall well-being, matcha tea continues to gain traction as a preferred choice.
Market Driver: Increasing Health Consciousness and Demand for Natural Products
A key driver in the matcha tea market is the increasing health consciousness and demand for natural products among consumers. As people become more aware of the impact of diet on their health, there is a growing preference for natural, minimally processed foods and beverages. Matcha tea, which is made from finely ground whole green tea leaves, fits this demand perfectly, offering a potent source of natural nutrients and antioxidants. The shift towards preventive healthcare, where individuals take proactive steps to maintain their health through diet, is also driving this market. Additionally, the clean label movement, where consumers seek products with transparent and simple ingredient lists, supports the growth of matcha tea, as it is often marketed as a pure and natural product free from artificial additives and preservatives.
Market Opportunity: Expansion Through Product Diversification and Market Penetration
The matcha tea market presents significant opportunities for expansion through product diversification and market penetration. With the growing interest in matcha, there is potential to develop a wide range of matcha-based products, including ready-to-drink beverages, matcha-infused snacks, desserts, and supplements. Innovating with new flavors and formulations can attract a broader audience and cater to various taste preferences. Additionally, expanding into emerging markets where health and wellness trends are on the rise presents a lucrative opportunity. Regions like Asia-Pacific, Latin America, and the Middle East, where traditional tea culture is already prevalent, can be key growth areas. Strategic marketing efforts, educational campaigns about the health benefits of matcha, and collaborations with local influencers can help penetrate these markets effectively, driving global market growth and increasing matcha's presence in the health and wellness industry.
Matcha Tea Market Share Analysis: Powder held the dominant market share in 2024
Powder is the largest segment in the Matcha Tea Market by product. This dominance can be attributed to several factors. Firstly, matcha powder offers versatility in consumption, as it can be used in various culinary applications such as beverages, desserts, and savory dishes, appealing to a wide range of consumers. Additionally, matcha powder retains the full nutritional benefits of green tea, including antioxidants and amino acids, making it a popular choice among health-conscious individuals. Further, the growing trend of at-home brewing and DIY recipes has spurred demand for matcha powder, as consumers seek to create their own customized matcha drinks and dishes. Furthermore, the widespread availability of matcha powder across both traditional retail outlets and online platforms enhances its accessibility to consumers globally. While RTD beverages and instant premixes offer convenience, the versatility and nutritional value of matcha powder position it as the largest segment in the matcha tea market.
Matcha Tea Market Share Analysis: Culinary market is poised to register the fastest growth rae over the forecast period to 2032
Culinary-grade matcha is the fastest-growing segment in the Matcha Tea Market by grade. This rapid growth is driven by several factors. Firstly, culinary-grade matcha offers a more affordable option compared to ceremonial-grade matcha, making it accessible to a broader consumer base. Its lower price point attracts consumers who are looking to incorporate matcha into their daily cooking and baking routines without the expense associated with ceremonial-grade matcha. Additionally, culinary-grade matcha's vibrant green color and slightly bitter flavor profile make it ideal for use in various culinary applications, including smoothies, lattes, desserts, and savory dishes, sparking creativity among chefs and home cooks alike. Further, as consumers become more health-conscious, culinary-grade matcha is increasingly recognized for its antioxidant properties and potential health benefits, further driving its demand. With its affordability, versatility, and perceived health benefits, culinary-grade matcha is poised for continued rapid growth in the matcha tea market.
Matcha Tea Market Segmentation
By Product
Powder
RTD Beverage
Instant Premixes
By Grade
Classic
Ceremonial
Culinary
Countries Analyzed
North America (US, Canada, Mexico)
Europe (Germany, UK, France, Spain, Italy, Russia, Rest of Europe)
Asia Pacific (China, India, Japan, South Korea, Australia, South East Asia, Rest of Asia)
South America (Brazil, Argentina, Rest of South America)
Middle East and Africa (Saudi Arabia, UAE, Rest of Middle East, South Africa, Egypt, Rest of Africa)
Matcha Tea Companies Profiled in the Study
Aiya
AOI Seicha
DoMatcha
Guizhou Gui Tea Group Co. Ltd
Marukyu Koyamaen
Marushichi Seicha
ShaoXing Royal Tea Village CO. Ltd
ujimatcha
Yanoen
Zhejiang Huamingyuan Tea Co. Ltd
*- List Not Exhaustive
Chapter 1. TABLE OF CONTENTS
Chapter 2. Introduction to Matcha Tea Market
2.1. Market Overview
2.2. Key Statistics and Report Highlights
2.3. Scope of the Comprehensive Study
2.3.1. Market Definition
2.3.2 Countries and Regions Covered
2.3.3 Research Objective
2.3.4 Units, Currency, and Conversions
2.3.5 Industry Value Chain
2.4. Key Market Segments
2.5. Key Companies
2.6. Study Period
Chapter 3. Strategic Analysis Review
3.1. Matcha Tea Pricing Analysis and Forecast
3.2. Porter’s Five Forces
3.3. Market Ecosystem
3.4. SWOT Analysis
3.5. Regulatory Scenario
3.3. Effects of Inflation, Russia-Ukraine War, moderating economic growth, and other macroeconomic factors
Chapter 4. Competitive Landscape
4.1. Market Share Analysis
4.1.1. Global Matcha Tea Market Share by Company, 2023
4.1.2. Product Offerings of Leading Matcha Tea Companies
4.2. Market Entropy
4.2.1. New Product Launches in the Industry
4.2.2. Mergers, Acquisitions, Joint ventures, and Partnerships
4.3. Key Strategies and Best Practices
Chapter 5. Global Market Projections: Best, Reference, and Low Case Scenarios
5.1. Growth Analysis- Case Scenario Definitions
5.2. Low Growth Case Scenario Forecasts
5.3. Reference Growth Case Scenario Forecasts
5.4. High Growth Case Scenario Forecasts
Chapter 6. Market Dynamics
6.1. Matcha Tea Market Drivers
6.2. Matcha Tea Market Challenges
6.6. Matcha Tea Market Opportunities
6.4. Matcha Tea Market Trends
Chapter 7. Global Matcha Tea Market Outlook Trends
7.1. Global Matcha Tea Revenue (USD Million) and CAGR (%) by Type (2021-2032)
7.2. Global Matcha Tea Revenue (USD Million) and CAGR (%) by Application (2021-2032)
7.3. Global Matcha Tea Revenue (USD Million) and CAGR (%) by Product (2021-2032)
By Product
Powder
RTD Beverage
Instant Premixes
By Grade
Classic
Ceremonial
Culinary
Chapter 8. Global Matcha Tea Regional Analysis and Outlook
8.1. Global Matcha Tea Revenue (USD Million) By Regions (2021- 2032)
8.2. North America Matcha Tea Revenue (USD Million) by Country (2021-2032)
8.2.1. United States Matcha Tea Regional Analysis and Outlook
8.2.2. Canada Matcha Tea Regional Analysis and Outlook
8.2.3. Mexico Matcha Tea Regional Analysis and Outlook
8.3. Europe Matcha Tea Revenue (USD Million), by Country (2021-2032)
8.3.1. Germany Matcha Tea Regional Analysis and Outlook
8.3.2. France Matcha Tea Regional Analysis and Outlook
8.3.3. United Kingdom Matcha Tea Regional Analysis and Outlook
8.3.4. Spain Matcha Tea Regional Analysis and Outlook
8.3.5. Italy Matcha Tea Regional Analysis and Outlook
8.3.6. Russia Matcha Tea Regional Analysis and Outlook
8.3.7. Rest of Europe Matcha Tea Regional Analysis and Outlook
8.4. Asia Pacific Matcha Tea Revenue (USD Million) by Country (2021-2032)
8.4.1. China Matcha Tea Regional Analysis and Outlook
8.4.2. Japan Matcha Tea Regional Analysis and Outlook
8.4.3. India Matcha Tea Regional Analysis and Outlook
8.4.4. South Korea Matcha Tea Regional Analysis and Outlook
8.4.5. Australia Matcha Tea Regional Analysis and Outlook
8.4.6. South East Asia Matcha Tea Regional Analysis and Outlook
8.4.7. Rest of Asia Pacific Matcha Tea Regional Analysis and Outlook
8.5. South America Matcha Tea Revenue (USD Million), by Country (2021-2032)
8.5.1. Brazil Matcha Tea Regional Analysis and Outlook
8.5.2. Argentina Matcha Tea Regional Analysis and Outlook
8.5.3. Rest of South America Matcha Tea Regional Analysis and Outlook
8.6. Middle East and Africa Matcha Tea Revenue (USD Million) by Country (2021-2032)
8.6.1. Middle East Matcha Tea Regional Analysis and Outlook
8.6.2. Africa Matcha Tea Regional Analysis and Outlook
Chapter 9. North America Matcha Tea Analysis and Outlook
9.1. North America Matcha Tea Revenue (USD Million) by Segments (2021-2032)
9.1.1. North America Matcha Tea Revenue (USD Million) by Type (2021-2032)
9.1.2. North America Matcha Tea Revenue (USD Million) by Application (2021-2032)
9.1.3. North America Matcha Tea Revenue (USD Million) by Product (2021-2032)
By Product
Powder
RTD Beverage
Instant Premixes
By Grade
Classic
Ceremonial
Culinary
Chapter 10. Europe Matcha Tea Analysis and Outlook
10.1. Europe Matcha Tea Revenue (USD Million), by Segments (USD Million) (2021-2032)
10.1.1. Europe Matcha Tea Revenue (USD Million) by Type (2021-2032)
10.1.2. Europe Matcha Tea Revenue (USD Million) by Application (2021-2032)
10.1.3. Europe Matcha Tea Revenue (USD Million) by Product (2021-2032)
By Product
Powder
RTD Beverage
Instant Premixes
By Grade
Classic
Ceremonial
Culinary
Chapter 11. Asia Pacific Matcha Tea Analysis and Outlook
11.1. Asia Pacific Matcha Tea Revenue (USD Million), and Revenue (USD Million) by Segments (2021-2032)
11.1.1. Asia Pacific Matcha Tea Revenue (USD Million) by Type (2021-2032)
11.1.2. Asia Pacific Matcha Tea Revenue (USD Million) by Application (2021-2032)
11.1.3. Asia Pacific Matcha Tea Revenue (USD Million) by Product (2021-2032)
By Product
Powder
RTD Beverage
Instant Premixes
By Grade
Classic
Ceremonial
Culinary
Chapter 12. South America Matcha Tea Analysis and Outlook
12.1. South America Matcha Tea Revenue (USD Million), by Segments (2021-2032)
12.1.1. South America Matcha Tea Revenue (USD Million) by Type (2021-2032)
12.1.2. South America Matcha Tea Revenue (USD Million) by Application (2021-2032)
12.1.3. South America Matcha Tea Revenue (USD Million) by Product (2021-2032)
By Product
Powder
RTD Beverage
Instant Premixes
By Grade
Classic
Ceremonial
Culinary
Chapter 13. Middle East and Africa Matcha Tea Analysis and Outlook
13.1. Middle East and Africa Matcha Tea Revenue (USD Million), by Segments (2021-2032)
13.1.1. Middle East and Africa Matcha Tea Revenue (USD Million) by Type (2021-2032)
13.1.2. Middle East and Africa Matcha Tea Revenue (USD Million) by Application (2021-2032)
13.1.3. Middle East and Africa Matcha Tea Revenue (USD Million) by Product (2021-2032)
By Product
Powder
RTD Beverage
Instant Premixes
By Grade
Classic
Ceremonial
Culinary
Chapter 14. Matcha Tea Company Profiles
14.1 Business Overview
14.2 Product Profiles
14.3 SWOT Profiles
14.5 Recent Developments
14.6 Financial Profile
List of Companies
Aiya
AOI Seicha
DoMatcha
Guizhou Gui Tea Group Co. Ltd
Marukyu Koyamaen
Marushichi Seicha
ShaoXing Royal Tea Village CO. Ltd
ujimatcha
Yanoen
Zhejiang Huamingyuan Tea Co. Ltd
15. Methodology and Data Sources
15.1 Customization Offerings
15.2 Subscription Services
15.3 Related Reports
15.4 Publisher Expertise
LIST OF TABLES
Table 1 Market Segmentation Analysis
Table 2 Global Matcha Tea Market Share of Leading Companies, 2023
Table 3 Product Offerings of Leading Companies
Table 4 Low Growth Scenario Forecasts
Table 5 Reference Case Growth Scenario
Table 6 High Growth Case Scenario
Table 7 Global Matcha Tea Revenue (USD Million) And CAGR (%) By Type (2021-2032)
Table 8 Global Matcha Tea Revenue (USD Million) And CAGR (%) By Application (2021-2032)
Table 9 Global Matcha Tea Revenue (USD Million) And CAGR (%) By Product (2021-2032)
Table 10 Global Matcha Tea Market Revenue (USD Million) By Regions (2021-2032)
Table 11 Global Matcha Tea Market Share (%) By Regions (2021-2032)
Table 12 North America Matcha Tea Revenue (USD Million) By Country (2021-2032)
Table 13 Europe Matcha Tea Revenue (USD Million) By Country (2021-2032)
Table 14 Asia Pacific Matcha Tea Revenue (USD Million) By Country (2021-2032)
Table 15 South America Matcha Tea Revenue (USD Million) By Country (2021-2032)
Table 16 Middle East and Africa Matcha Tea Revenue (USD Million) By Region (2021-2032)
Table 17 North America Matcha Tea Revenue (USD Million) By Type (2021-2032)
Table 18 North America Matcha Tea Revenue (USD Million) By Application (2021-2032)
Table 19 North America Matcha Tea Revenue (USD Million) By Product (2021-2032)
Table 20 Europe Matcha Tea Revenue (USD Million) By Type (2021-2032)
Table 21 Europe Matcha Tea Revenue (USD Million) By Application (2021-2032)
Table 22 Europe Matcha Tea Revenue (USD Million) By Product (2021-2032)
Table 23 Asia Pacific Matcha Tea Revenue (USD Million) By Type (2021-2032)
Table 24 Asia Pacific Matcha Tea Revenue (USD Million) By Application (2021-2032)
Table 25 Asia Pacific Matcha Tea Revenue (USD Million) By Product (2021-2032)
Table 26 South America Matcha Tea Revenue (USD Million) By Type (2021-2032)
Table 27 South America Matcha Tea Revenue (USD Million) By Application (2021-2032)
Table 28 South America Matcha Tea Revenue (USD Million) By Product (2021-2032)
Table 29 Middle East and Africa Matcha Tea Revenue (USD Million) By Type (2021-2032)
Table 30 Middle East and Africa Matcha Tea Revenue (USD Million) By Application (2021-2032)
Table 31 Middle East and Africa Matcha Tea Revenue (USD Million) By Product (2021-2032)
LIST OF FIGURES
Figure 1. Market Scope
Figure 2. Pricing Forecasts Per Unit, 2023- 2032
Figure 3. Porter’s Five Forces
Figure 4. Global Matcha Tea Market Revenue (USD Million) By Regions (2021-2032)
Figure 5. Global Matcha Tea Market Share (%) By Regions (2023)
Figure 6. North America Matcha Tea Revenue (USD Million) By Country (2021-2032)
Figure 7. United States Matcha Tea Revenue (USD Million) By Country (2021-2032)
Figure 8. Canada Matcha Tea Revenue (USD Million) By Country (2021-2032)
Figure 9. Mexico Matcha Tea Revenue (USD Million) By Country (2021-2032)
Figure 10. Europe Matcha Tea Revenue (USD Million) By Country (2021-2032)
Figure 11. Germany Matcha Tea Revenue (USD Million) By Country (2021-2032)
Figure 12. France Matcha Tea Revenue (USD Million) By Country (2021-2032)
Figure 13. United Kingdom Matcha Tea Revenue (USD Million) By Country (2021-2032)
Figure 14. Spain Matcha Tea Revenue (USD Million) By Country (2021-2032)
Figure 15. Italy Matcha Tea Revenue (USD Million) By Country (2021-2032)
Figure 16. Russia Matcha Tea Revenue (USD Million) By Country (2021-2032)
Figure 17. Rest of Europe Matcha Tea Revenue (USD Million) By Country (2021-2032)
Figure 11. Asia Pacific Matcha Tea Revenue (USD Million) By Country (2021-2032)
Figure 12. China Matcha Tea Revenue (USD Million) By Country (2021-2032)
Figure 13. Japan Matcha Tea Revenue (USD Million) By Country (2021-2032)
Figure 14. India Matcha Tea Revenue (USD Million) By Country (2021-2032)
Figure 15. South Korea Matcha Tea Revenue (USD Million) By Country (2021-2032)
Figure 16. Australia Matcha Tea Revenue (USD Million) By Country (2021-2032)
Figure 17. South East Asia Matcha Tea Revenue (USD Million) By Country (2021-2032)
Figure 18. South America Matcha Tea Revenue (USD Million) By Country (2021-2032)
Figure 19. Brazil Matcha Tea Revenue (USD Million) By Country (2021-2032)
Figure 20. Argentina Matcha Tea Revenue (USD Million) By Country (2021-2032)
Figure 21. Rest of Asia Pacific Matcha Tea Revenue (USD Million) By Country (2021-2032)
Figure 22. Middle East and Africa Matcha Tea Revenue (USD Million) By Region (2021-2032)
Figure 23. Saudi Arabia Matcha Tea Revenue (USD Million) By Region (2021-2032)
Figure 24. The UAE Matcha Tea Revenue (USD Million) By Region (2021-2032)
Figure 25. Rest of Middle East Matcha Tea Revenue (USD Million) By Region (2021-2032)
Figure 26. South Africa Matcha Tea Revenue (USD Million) By Region (2021-2032)
Figure 27. Africa Matcha Tea Revenue (USD Million) By Region (2021-2032)
Figure 28. North America Matcha Tea Revenue (USD Million) By Type (2021-2032)
Figure 29. North America Matcha Tea Revenue (USD Million) By Application (2021-2032)
Figure 30. North America Matcha Tea Revenue (USD Million) By Product (2021-2032)
Figure 31. Europe Matcha Tea Revenue (USD Million) By Type (2021-2032)
Figure 32. Europe Matcha Tea Revenue (USD Million) By Application (2021-2032)
Figure 33. Europe Matcha Tea Revenue (USD Million) By Product (2021-2032)
Figure 34. Asia Pacific Matcha Tea Revenue (USD Million) By Type (2021-2032)
Figure 35. Asia Pacific Matcha Tea Revenue (USD Million) By Application (2021-2032)
Figure 36. Asia Pacific Matcha Tea Revenue (USD Million) By Product (2021-2032)
Figure 37. South America Matcha Tea Revenue (USD Million) By Type (2021-2032)
Figure 38. South America Matcha Tea Revenue (USD Million) By Application (2021-2032)
Figure 39. South America Matcha Tea Revenue (USD Million) By Product (2021-2032)
Figure 40. Middle East and Africa Matcha Tea Revenue (USD Million) By Type (2021-2032)
Figure 41. Middle East and Africa Matcha Tea Revenue (USD Million) By Application (2021-2032)
Figure 42. Middle East and Africa Matcha Tea Revenue (USD Million) By Product (2021-2032)
By Product
Powder
RTD Beverage
Instant Premixes
By Grade
Classic
Ceremonial
Culinary
Countries Analyzed
North America (US, Canada, Mexico)
Europe (Germany, UK, France, Spain, Italy, Russia, Rest of Europe)
Asia Pacific (China, India, Japan, South Korea, Australia, South East Asia, Rest of Asia)
South America (Brazil, Argentina, Rest of South America)
Middle East and Africa (Saudi Arabia, UAE, Rest of Middle East, South Africa, Egypt, Rest of Africa)
