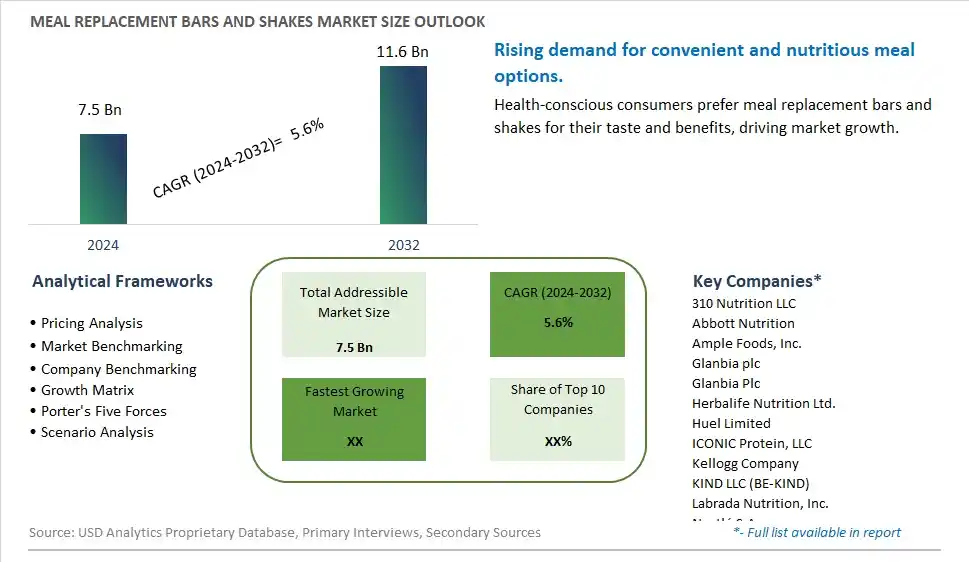
Global Meal Replacement Bars and Shakes Market Size is valued at $7.5 Billion in 2024 and is forecast to register a growth rate (CAGR) of 5.6% to reach $11.6 Billion by 2032.
The global Meal Replacement Bars and Shakes Market Comprehensive Study analyzes and forecasts the market size across 6 regions and 24 countries for diverse segments -By Type (Meal Replacement Bars, Powder Shakes, Ready to Drink Shakes), By Distribution Channel (Supermarkets/Hypermarkets, Convenience stores, Specialty stores, Online, Others)
An Introduction to Meal Replacement Bars and Shakes Market
The meal replacement bars and shakes market in 2024 is expanding rapidly, driven by the demand for convenient, nutrient-dense options that support busy lifestyles and weight management goals. Meal replacement bars and shakes offer balanced nutrition with a blend of proteins, carbohydrates, fats, and vitamins. The market benefits from innovations in product formulation and flavor development that enhance taste and nutritional profile. The trend towards clean label and natural ingredients is influencing product development. Increasing consumer interest in fitness, wellness, and dietary convenience is further supporting market growth.
Meal Replacement Bars and Shakes Competitive Landscape
The market report analyses the leading companies in the industry including 310 Nutrition LLC, Abbott Nutrition, Ample Foods, Inc., Glanbia plc, Glanbia Plc, Herbalife Nutrition Ltd., Huel Limited, ICONIC Protein, LLC, Kellogg Company, KIND LLC (BE-KIND), Labrada Nutrition, Inc., Nestlé S.A., Orgain, Inc., Premier Nutrition Corporation, The Gatorade Company, Wonder Laboratories, Inc., and Others.
Meal Replacement Bars and Shakes Market Dynamics
Meal Replacement Bars and Shakes Market Trend: Increasing Demand for Convenient and Nutrient-Dense Foods
The most prominent trend in the Meal Replacement Bars and Shakes Market is the increasing demand for convenient and nutrient-dense foods. Consumers are seeking meal replacement options that offer a balanced nutritional profile and are easy to consume on the go. This trend is driven by busy lifestyles and the desire for quick and healthy meal solutions.
Meal Replacement Bars and Shakes Market Driver: Rising Health Consciousness and Focus on Weight Management
A key driver in the Meal Replacement Bars and Shakes Market is rising health consciousness and a focus on weight management. As more individuals adopt healthier eating habits and seek to manage their weight, there is a growing demand for meal replacement products that provide essential nutrients while supporting weight loss or maintenance. This driver supports the expansion of the market as manufacturers cater to health-conscious consumers.
Meal Replacement Bars and Shakes Market Opportunity: Innovation in Flavors and Functional Ingredients
One significant opportunity in the Meal Replacement Bars and Shakes Market lies in innovation in flavors and functional ingredients. Companies can develop new meal replacement bars and shakes with unique flavor profiles, such as exotic fruits or indulgent dessert flavors, and incorporate functional ingredients, such as protein, fiber, and probiotics. By offering diverse and health-focused options, manufacturers can attract a broader consumer base and drive market growth.
Meal Replacement Bars and Shakes Market Share Analysis: Ready to Drink Shakes segment generated the highest revenue share in the industry
Ready to drink shakes emerge as the largest segment within the Meal Replacement Bars and Shakes Market. This dominance is driven by the convenience and immediate consumption appeal of ready to drink shakes, which provide a quick and nutritionally balanced meal replacement option for busy individuals. Ready to drink shakes are pre-mixed and packaged for direct consumption, offering a hassle-free solution for consumers seeking convenient nutrition on the go. These shakes are available in a variety of flavors and formulations, catering to different dietary preferences and nutritional needs. The popularity of ready to drink shakes is bolstered by their shelf stability, portability, and suitability for various lifestyles, including fitness enthusiasts, office workers, and travelers. As consumer awareness of health and wellness grows, ready to drink shakes continue to capture a significant share of the meal replacement market, supported by their convenience and nutritional benefits.
Meal Replacement Bars and Shakes Market Share Analysis: Online Distribution is the fastest growing segment over the forecast period to 2032
The online distribution segment is anticipated to be the fastest growing segment in the Meal Replacement Bars and Shakes Market by 2032. This growth is driven by the increasing trend of purchasing nutritional products through e-commerce platforms, facilitated by the convenience, variety, and accessibility offered by online shopping. Consumers are increasingly turning to online channels to purchase meal replacement bars and shakes due to the ease of comparing products, reading reviews, and accessing a broader selection of brands and flavors. Online retailers cater to a diverse consumer base seeking specialized dietary products, including meal replacement options tailored to specific nutritional goals and dietary restrictions. The digitalization of retail and the expansion of online grocery services further accelerate the growth of online distribution channels for meal replacement bars and shakes. Manufacturers and retailers are leveraging digital marketing strategies and partnerships with online platforms to enhance product visibility and reach a global audience, driving significant growth in this segment.
Meal Replacement Bars and Shakes Market Segmentation
By Type
Meal Replacement Bars
Powder Shakes
Ready to Drink Shakes
By Distribution Channel
Supermarkets/Hypermarkets
Convenience stores
Specialty stores
Online
Others
Countries Analyzed
North America (US, Canada, Mexico)
Europe (Germany, UK, France, Spain, Italy, Russia, Rest of Europe)
Asia Pacific (China, India, Japan, South Korea, Australia, South East Asia, Rest of Asia)
South America (Brazil, Argentina, Rest of South America)
Middle East and Africa (Saudi Arabia, UAE, Rest of Middle East, South Africa, Egypt, Rest of Africa)
Meal Replacement Bars and Shakes Companies Profiled in the Study
310 Nutrition LLC
Abbott Nutrition
Ample Foods, Inc.
Glanbia plc
Glanbia Plc
Herbalife Nutrition Ltd.
Huel Limited
ICONIC Protein, LLC
Kellogg Company
KIND LLC (BE-KIND)
Labrada Nutrition, Inc.
Nestlé S.A.
Orgain, Inc.
Premier Nutrition Corporation
The Gatorade Company
Wonder Laboratories, Inc.
*- List Not Exhaustive
Chapter 1. TABLE OF CONTENTS
Chapter 2. Introduction to Meal Replacement Bars and Shakes Market
2.1. Market Overview
2.2. Key Statistics and Report Highlights
2.3. Scope of the Comprehensive Study
2.3.1. Market Definition
2.3.2 Countries and Regions Covered
2.3.3 Research Objective
2.3.4 Units, Currency, and Conversions
2.3.5 Industry Value Chain
2.4. Key Market Segments
2.5. Key Companies
2.6. Study Period
Chapter 3. Strategic Analysis Review
3.1. Meal Replacement Bars and Shakes Pricing Analysis and Forecast
3.2. Porter’s Five Forces
3.3. Market Ecosystem
3.4. SWOT Analysis
3.5. Regulatory Scenario
3.3. Effects of Inflation, Russia-Ukraine War, moderating economic growth, and other macroeconomic factors
Chapter 4. Competitive Landscape
4.1. Market Share Analysis
4.1.1. Global Meal Replacement Bars and Shakes Market Share by Company, 2023
4.1.2. Product Offerings of Leading Meal Replacement Bars and Shakes Companies
4.2. Market Entropy
4.2.1. New Product Launches in the Industry
4.2.2. Mergers, Acquisitions, Joint ventures, and Partnerships
4.3. Key Strategies and Best Practices
Chapter 5. Global Market Projections: Best, Reference, and Low Case Scenarios
5.1. Growth Analysis- Case Scenario Definitions
5.2. Low Growth Case Scenario Forecasts
5.3. Reference Growth Case Scenario Forecasts
5.4. High Growth Case Scenario Forecasts
Chapter 6. Market Dynamics
6.1. Meal Replacement Bars and Shakes Market Drivers
6.2. Meal Replacement Bars and Shakes Market Challenges
6.6. Meal Replacement Bars and Shakes Market Opportunities
6.4. Meal Replacement Bars and Shakes Market Trends
Chapter 7. Global Meal Replacement Bars and Shakes Market Outlook Trends
7.1. Global Meal Replacement Bars and Shakes Revenue (USD Million) and CAGR (%) by Type (2021-2032)
7.2. Global Meal Replacement Bars and Shakes Revenue (USD Million) and CAGR (%) by Application (2021-2032)
7.3. Global Meal Replacement Bars and Shakes Revenue (USD Million) and CAGR (%) by Product (2021-2032)
By Type
Meal Replacement Bars
Powder Shakes
Ready to Drink Shakes
By Distribution Channel
Supermarkets/Hypermarkets
Convenience stores
Specialty stores
Online
Others
Chapter 8. Global Meal Replacement Bars and Shakes Regional Analysis and Outlook
8.1. Global Meal Replacement Bars and Shakes Revenue (USD Million) By Regions (2021- 2032)
8.2. North America Meal Replacement Bars and Shakes Revenue (USD Million) by Country (2021-2032)
8.2.1. United States Meal Replacement Bars and Shakes Regional Analysis and Outlook
8.2.2. Canada Meal Replacement Bars and Shakes Regional Analysis and Outlook
8.2.3. Mexico Meal Replacement Bars and Shakes Regional Analysis and Outlook
8.3. Europe Meal Replacement Bars and Shakes Revenue (USD Million), by Country (2021-2032)
8.3.1. Germany Meal Replacement Bars and Shakes Regional Analysis and Outlook
8.3.2. France Meal Replacement Bars and Shakes Regional Analysis and Outlook
8.3.3. United Kingdom Meal Replacement Bars and Shakes Regional Analysis and Outlook
8.3.4. Spain Meal Replacement Bars and Shakes Regional Analysis and Outlook
8.3.5. Italy Meal Replacement Bars and Shakes Regional Analysis and Outlook
8.3.6. Russia Meal Replacement Bars and Shakes Regional Analysis and Outlook
8.3.7. Rest of Europe Meal Replacement Bars and Shakes Regional Analysis and Outlook
8.4. Asia Pacific Meal Replacement Bars and Shakes Revenue (USD Million) by Country (2021-2032)
8.4.1. China Meal Replacement Bars and Shakes Regional Analysis and Outlook
8.4.2. Japan Meal Replacement Bars and Shakes Regional Analysis and Outlook
8.4.3. India Meal Replacement Bars and Shakes Regional Analysis and Outlook
8.4.4. South Korea Meal Replacement Bars and Shakes Regional Analysis and Outlook
8.4.5. Australia Meal Replacement Bars and Shakes Regional Analysis and Outlook
8.4.6. South East Asia Meal Replacement Bars and Shakes Regional Analysis and Outlook
8.4.7. Rest of Asia Pacific Meal Replacement Bars and Shakes Regional Analysis and Outlook
8.5. South America Meal Replacement Bars and Shakes Revenue (USD Million), by Country (2021-2032)
8.5.1. Brazil Meal Replacement Bars and Shakes Regional Analysis and Outlook
8.5.2. Argentina Meal Replacement Bars and Shakes Regional Analysis and Outlook
8.5.3. Rest of South America Meal Replacement Bars and Shakes Regional Analysis and Outlook
8.6. Middle East and Africa Meal Replacement Bars and Shakes Revenue (USD Million) by Country (2021-2032)
8.6.1. Middle East Meal Replacement Bars and Shakes Regional Analysis and Outlook
8.6.2. Africa Meal Replacement Bars and Shakes Regional Analysis and Outlook
Chapter 9. North America Meal Replacement Bars and Shakes Analysis and Outlook
9.1. North America Meal Replacement Bars and Shakes Revenue (USD Million) by Segments (2021-2032)
9.1.1. North America Meal Replacement Bars and Shakes Revenue (USD Million) by Type (2021-2032)
9.1.2. North America Meal Replacement Bars and Shakes Revenue (USD Million) by Application (2021-2032)
9.1.3. North America Meal Replacement Bars and Shakes Revenue (USD Million) by Product (2021-2032)
By Type
Meal Replacement Bars
Powder Shakes
Ready to Drink Shakes
By Distribution Channel
Supermarkets/Hypermarkets
Convenience stores
Specialty stores
Online
Others
Chapter 10. Europe Meal Replacement Bars and Shakes Analysis and Outlook
10.1. Europe Meal Replacement Bars and Shakes Revenue (USD Million), by Segments (USD Million) (2021-2032)
10.1.1. Europe Meal Replacement Bars and Shakes Revenue (USD Million) by Type (2021-2032)
10.1.2. Europe Meal Replacement Bars and Shakes Revenue (USD Million) by Application (2021-2032)
10.1.3. Europe Meal Replacement Bars and Shakes Revenue (USD Million) by Product (2021-2032)
By Type
Meal Replacement Bars
Powder Shakes
Ready to Drink Shakes
By Distribution Channel
Supermarkets/Hypermarkets
Convenience stores
Specialty stores
Online
Others
Chapter 11. Asia Pacific Meal Replacement Bars and Shakes Analysis and Outlook
11.1. Asia Pacific Meal Replacement Bars and Shakes Revenue (USD Million), and Revenue (USD Million) by Segments (2021-2032)
11.1.1. Asia Pacific Meal Replacement Bars and Shakes Revenue (USD Million) by Type (2021-2032)
11.1.2. Asia Pacific Meal Replacement Bars and Shakes Revenue (USD Million) by Application (2021-2032)
11.1.3. Asia Pacific Meal Replacement Bars and Shakes Revenue (USD Million) by Product (2021-2032)
By Type
Meal Replacement Bars
Powder Shakes
Ready to Drink Shakes
By Distribution Channel
Supermarkets/Hypermarkets
Convenience stores
Specialty stores
Online
Others
Chapter 12. South America Meal Replacement Bars and Shakes Analysis and Outlook
12.1. South America Meal Replacement Bars and Shakes Revenue (USD Million), by Segments (2021-2032)
12.1.1. South America Meal Replacement Bars and Shakes Revenue (USD Million) by Type (2021-2032)
12.1.2. South America Meal Replacement Bars and Shakes Revenue (USD Million) by Application (2021-2032)
12.1.3. South America Meal Replacement Bars and Shakes Revenue (USD Million) by Product (2021-2032)
By Type
Meal Replacement Bars
Powder Shakes
Ready to Drink Shakes
By Distribution Channel
Supermarkets/Hypermarkets
Convenience stores
Specialty stores
Online
Others
Chapter 13. Middle East and Africa Meal Replacement Bars and Shakes Analysis and Outlook
13.1. Middle East and Africa Meal Replacement Bars and Shakes Revenue (USD Million), by Segments (2021-2032)
13.1.1. Middle East and Africa Meal Replacement Bars and Shakes Revenue (USD Million) by Type (2021-2032)
13.1.2. Middle East and Africa Meal Replacement Bars and Shakes Revenue (USD Million) by Application (2021-2032)
13.1.3. Middle East and Africa Meal Replacement Bars and Shakes Revenue (USD Million) by Product (2021-2032)
By Type
Meal Replacement Bars
Powder Shakes
Ready to Drink Shakes
By Distribution Channel
Supermarkets/Hypermarkets
Convenience stores
Specialty stores
Online
Others
Chapter 14. Meal Replacement Bars and Shakes Company Profiles
14.1 Business Overview
14.2 Product Profiles
14.3 SWOT Profiles
14.5 Recent Developments
14.6 Financial Profile
List of Companies
310 Nutrition LLC
Abbott Nutrition
Ample Foods, Inc.
Glanbia plc
Glanbia Plc
Herbalife Nutrition Ltd.
Huel Limited
ICONIC Protein, LLC
Kellogg Company
KIND LLC (BE-KIND)
Labrada Nutrition, Inc.
Nestlé S.A.
Orgain, Inc.
Premier Nutrition Corporation
The Gatorade Company
Wonder Laboratories, Inc.
15. Methodology and Data Sources
15.1 Customization Offerings
15.2 Subscription Services
15.3 Related Reports
15.4 Publisher Expertise
LIST OF TABLES
Table 1 Market Segmentation Analysis
Table 2 Global Meal Replacement Bars and Shakes Market Share of Leading Companies, 2023
Table 3 Product Offerings of Leading Companies
Table 4 Low Growth Scenario Forecasts
Table 5 Reference Case Growth Scenario
Table 6 High Growth Case Scenario
Table 7 Global Meal Replacement Bars and Shakes Revenue (USD Million) And CAGR (%) By Type (2021-2032)
Table 8 Global Meal Replacement Bars and Shakes Revenue (USD Million) And CAGR (%) By Application (2021-2032)
Table 9 Global Meal Replacement Bars and Shakes Revenue (USD Million) And CAGR (%) By Product (2021-2032)
Table 10 Global Meal Replacement Bars and Shakes Market Revenue (USD Million) By Regions (2021-2032)
Table 11 Global Meal Replacement Bars and Shakes Market Share (%) By Regions (2021-2032)
Table 12 North America Meal Replacement Bars and Shakes Revenue (USD Million) By Country (2021-2032)
Table 13 Europe Meal Replacement Bars and Shakes Revenue (USD Million) By Country (2021-2032)
Table 14 Asia Pacific Meal Replacement Bars and Shakes Revenue (USD Million) By Country (2021-2032)
Table 15 South America Meal Replacement Bars and Shakes Revenue (USD Million) By Country (2021-2032)
Table 16 Middle East and Africa Meal Replacement Bars and Shakes Revenue (USD Million) By Region (2021-2032)
Table 17 North America Meal Replacement Bars and Shakes Revenue (USD Million) By Type (2021-2032)
Table 18 North America Meal Replacement Bars and Shakes Revenue (USD Million) By Application (2021-2032)
Table 19 North America Meal Replacement Bars and Shakes Revenue (USD Million) By Product (2021-2032)
Table 20 Europe Meal Replacement Bars and Shakes Revenue (USD Million) By Type (2021-2032)
Table 21 Europe Meal Replacement Bars and Shakes Revenue (USD Million) By Application (2021-2032)
Table 22 Europe Meal Replacement Bars and Shakes Revenue (USD Million) By Product (2021-2032)
Table 23 Asia Pacific Meal Replacement Bars and Shakes Revenue (USD Million) By Type (2021-2032)
Table 24 Asia Pacific Meal Replacement Bars and Shakes Revenue (USD Million) By Application (2021-2032)
Table 25 Asia Pacific Meal Replacement Bars and Shakes Revenue (USD Million) By Product (2021-2032)
Table 26 South America Meal Replacement Bars and Shakes Revenue (USD Million) By Type (2021-2032)
Table 27 South America Meal Replacement Bars and Shakes Revenue (USD Million) By Application (2021-2032)
Table 28 South America Meal Replacement Bars and Shakes Revenue (USD Million) By Product (2021-2032)
Table 29 Middle East and Africa Meal Replacement Bars and Shakes Revenue (USD Million) By Type (2021-2032)
Table 30 Middle East and Africa Meal Replacement Bars and Shakes Revenue (USD Million) By Application (2021-2032)
Table 31 Middle East and Africa Meal Replacement Bars and Shakes Revenue (USD Million) By Product (2021-2032)
LIST OF FIGURES
Figure 1. Market Scope
Figure 2. Pricing Forecasts Per Unit, 2023- 2032
Figure 3. Porter’s Five Forces
Figure 4. Global Meal Replacement Bars and Shakes Market Revenue (USD Million) By Regions (2021-2032)
Figure 5. Global Meal Replacement Bars and Shakes Market Share (%) By Regions (2023)
Figure 6. North America Meal Replacement Bars and Shakes Revenue (USD Million) By Country (2021-2032)
Figure 7. United States Meal Replacement Bars and Shakes Revenue (USD Million) By Country (2021-2032)
Figure 8. Canada Meal Replacement Bars and Shakes Revenue (USD Million) By Country (2021-2032)
Figure 9. Mexico Meal Replacement Bars and Shakes Revenue (USD Million) By Country (2021-2032)
Figure 10. Europe Meal Replacement Bars and Shakes Revenue (USD Million) By Country (2021-2032)
Figure 11. Germany Meal Replacement Bars and Shakes Revenue (USD Million) By Country (2021-2032)
Figure 12. France Meal Replacement Bars and Shakes Revenue (USD Million) By Country (2021-2032)
Figure 13. United Kingdom Meal Replacement Bars and Shakes Revenue (USD Million) By Country (2021-2032)
Figure 14. Spain Meal Replacement Bars and Shakes Revenue (USD Million) By Country (2021-2032)
Figure 15. Italy Meal Replacement Bars and Shakes Revenue (USD Million) By Country (2021-2032)
Figure 16. Russia Meal Replacement Bars and Shakes Revenue (USD Million) By Country (2021-2032)
Figure 17. Rest of Europe Meal Replacement Bars and Shakes Revenue (USD Million) By Country (2021-2032)
Figure 11. Asia Pacific Meal Replacement Bars and Shakes Revenue (USD Million) By Country (2021-2032)
Figure 12. China Meal Replacement Bars and Shakes Revenue (USD Million) By Country (2021-2032)
Figure 13. Japan Meal Replacement Bars and Shakes Revenue (USD Million) By Country (2021-2032)
Figure 14. India Meal Replacement Bars and Shakes Revenue (USD Million) By Country (2021-2032)
Figure 15. South Korea Meal Replacement Bars and Shakes Revenue (USD Million) By Country (2021-2032)
Figure 16. Australia Meal Replacement Bars and Shakes Revenue (USD Million) By Country (2021-2032)
Figure 17. South East Asia Meal Replacement Bars and Shakes Revenue (USD Million) By Country (2021-2032)
Figure 18. South America Meal Replacement Bars and Shakes Revenue (USD Million) By Country (2021-2032)
Figure 19. Brazil Meal Replacement Bars and Shakes Revenue (USD Million) By Country (2021-2032)
Figure 20. Argentina Meal Replacement Bars and Shakes Revenue (USD Million) By Country (2021-2032)
Figure 21. Rest of Asia Pacific Meal Replacement Bars and Shakes Revenue (USD Million) By Country (2021-2032)
Figure 22. Middle East and Africa Meal Replacement Bars and Shakes Revenue (USD Million) By Region (2021-2032)
Figure 23. Saudi Arabia Meal Replacement Bars and Shakes Revenue (USD Million) By Region (2021-2032)
Figure 24. The UAE Meal Replacement Bars and Shakes Revenue (USD Million) By Region (2021-2032)
Figure 25. Rest of Middle East Meal Replacement Bars and Shakes Revenue (USD Million) By Region (2021-2032)
Figure 26. South Africa Meal Replacement Bars and Shakes Revenue (USD Million) By Region (2021-2032)
Figure 27. Africa Meal Replacement Bars and Shakes Revenue (USD Million) By Region (2021-2032)
Figure 28. North America Meal Replacement Bars and Shakes Revenue (USD Million) By Type (2021-2032)
Figure 29. North America Meal Replacement Bars and Shakes Revenue (USD Million) By Application (2021-2032)
Figure 30. North America Meal Replacement Bars and Shakes Revenue (USD Million) By Product (2021-2032)
Figure 31. Europe Meal Replacement Bars and Shakes Revenue (USD Million) By Type (2021-2032)
Figure 32. Europe Meal Replacement Bars and Shakes Revenue (USD Million) By Application (2021-2032)
Figure 33. Europe Meal Replacement Bars and Shakes Revenue (USD Million) By Product (2021-2032)
Figure 34. Asia Pacific Meal Replacement Bars and Shakes Revenue (USD Million) By Type (2021-2032)
Figure 35. Asia Pacific Meal Replacement Bars and Shakes Revenue (USD Million) By Application (2021-2032)
Figure 36. Asia Pacific Meal Replacement Bars and Shakes Revenue (USD Million) By Product (2021-2032)
Figure 37. South America Meal Replacement Bars and Shakes Revenue (USD Million) By Type (2021-2032)
Figure 38. South America Meal Replacement Bars and Shakes Revenue (USD Million) By Application (2021-2032)
Figure 39. South America Meal Replacement Bars and Shakes Revenue (USD Million) By Product (2021-2032)
Figure 40. Middle East and Africa Meal Replacement Bars and Shakes Revenue (USD Million) By Type (2021-2032)
Figure 41. Middle East and Africa Meal Replacement Bars and Shakes Revenue (USD Million) By Application (2021-2032)
Figure 42. Middle East and Africa Meal Replacement Bars and Shakes Revenue (USD Million) By Product (2021-2032)
By Type
Meal Replacement Bars
Powder Shakes
Ready to Drink Shakes
By Distribution Channel
Supermarkets/Hypermarkets
Convenience stores
Specialty stores
Online
Others
Countries Analyzed
North America (US, Canada, Mexico)
Europe (Germany, UK, France, Spain, Italy, Russia, Rest of Europe)
Asia Pacific (China, India, Japan, South Korea, Australia, South East Asia, Rest of Asia)
South America (Brazil, Argentina, Rest of South America)
Middle East and Africa (Saudi Arabia, UAE, Rest of Middle East, South Africa, Egypt, Rest of Africa)
