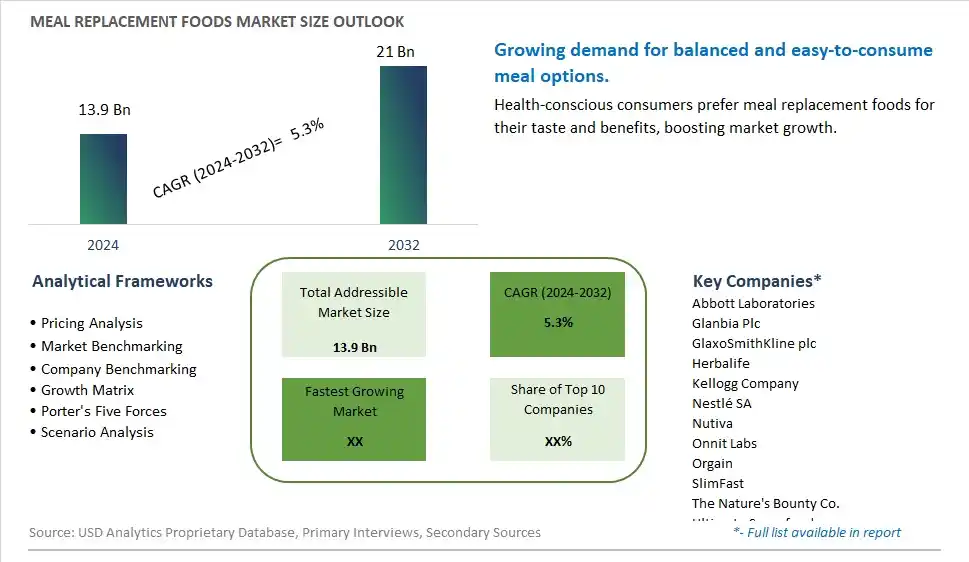
Global Meal Replacement Foods Market Size is valued at $13.9 Billion in 2024 and is forecast to register a growth rate (CAGR) of 5.3% to reach $21 Billion by 2032.
The global Meal Replacement Foods Market Comprehensive Study analyzes and forecasts the market size across 6 regions and 24 countries for diverse segments -By Type (Powders, Bars, Drinks, Others), By Sales Channel (Online, Offline)
An Introduction to Meal Replacement Foods Market
The meal replacement foods market in 2024 is expanding, driven by the demand for convenient and nutritionally balanced alternatives to traditional meals. Meal replacement foods, including bars, shakes, and ready-to-eat meals, offer a blend of proteins, carbohydrates, fats, and essential nutrients. The market benefits from innovations in formulation and packaging that enhance taste, texture, and shelf life. The trend towards clean label and natural ingredients is influencing product development. Increasing consumer interest in health and wellness, along with the popularity of fitness and weight management programs, is further supporting market growth.
Meal Replacement Foods Competitive Landscape
The market report analyses the leading companies in the industry including Abbott Laboratories, Glanbia Plc, GlaxoSmithKline plc, Herbalife, Kellogg Company, Nestlé SA, Nutiva, Onnit Labs, Orgain, SlimFast, The Nature's Bounty Co., Ultimate Superfoods, and Others.
Meal Replacement Foods Market Dynamics
Meal Replacement Foods Market Trend: Increasing Demand for Balanced and Convenient Meals
The most prominent trend in the Meal Replacement Foods Market is the increasing demand for balanced and convenient meals. Consumers are seeking meal replacement foods that provide essential nutrients and are easy to prepare and consume. This trend is driven by busy lifestyles and the need for quick and healthy meal solutions that support overall well-being.
Meal Replacement Foods Market Driver: Rising Health Consciousness and Focus on Nutrition
A key driver in the Meal Replacement Foods Market is rising health consciousness and a focus on nutrition. As more individuals adopt healthier eating habits and seek to improve their diet, there is a growing demand for meal replacement foods that offer a complete nutritional profile. This driver supports the expansion of the market as manufacturers cater to health-conscious consumers.
Meal Replacement Foods Market Opportunity: Innovation in Product Varieties and Formulations
One significant opportunity in the Meal Replacement Foods Market lies in innovation in product varieties and formulations. Companies can develop new meal replacement foods that cater to different dietary preferences and health goals, such as gluten-free, high-protein, or low-carb options. By offering diverse and nutritious meal replacement products, manufacturers can attract a broader consumer base and drive market growth.
Meal Replacement Foods Market Share Analysis: Bars segment generated the highest revenue share in the industry
Bars emerge as the largest segment within the Meal Replacement Foods Market. This segment's dominance is driven by the convenience and portability offered by meal replacement bars, making them a popular choice among consumers seeking quick and nutritionally balanced meal options. Meal replacement bars are compact, pre-portioned, and suitable for on-the-go consumption, appealing to busy individuals who prioritize convenience without compromising on nutritional value. These bars come in a variety of flavors and formulations, catering to different dietary preferences and nutritional needs such as protein-rich, low-carb, or gluten-free options. Their shelf stability and longer storage life also contribute to their popularity in both retail and online channels. As consumer lifestyles become increasingly hectic and health-conscious, meal replacement bars continue to dominate the market as a convenient and effective meal solution.
Meal Replacement Foods Market Share Analysis: Online Sales Channel is the fastest growing segment over the forecast period to 2032
The online sales channel is anticipated to be the fastest growing segment in the Meal Replacement Foods Market by 2032. This growth is driven by the rising preference for shopping convenience, diverse product offerings, and competitive pricing offered by e-commerce platforms. Online channels provide consumers with the flexibility to browse and purchase meal replacement foods from the comfort of their homes or on mobile devices, enabling access to a wide range of brands, flavors, and nutritional profiles. The convenience of doorstep delivery and subscription services further enhances the appeal of online shopping for meal replacement foods, attracting a growing number of health-conscious consumers and fitness enthusiasts. Manufacturers and retailers are increasingly focusing on digital marketing strategies, partnerships with online platforms, and personalized customer experiences to capitalize on the expanding online market for meal replacement foods.
Meal Replacement Foods Market Segmentation
By Type
Powders
Bars
Drinks
Others
By Sales Channel
Online
Offline
Countries Analyzed
North America (US, Canada, Mexico)
Europe (Germany, UK, France, Spain, Italy, Russia, Rest of Europe)
Asia Pacific (China, India, Japan, South Korea, Australia, South East Asia, Rest of Asia)
South America (Brazil, Argentina, Rest of South America)
Middle East and Africa (Saudi Arabia, UAE, Rest of Middle East, South Africa, Egypt, Rest of Africa)
Meal Replacement Foods Companies Profiled in the Study
Abbott Laboratories
Glanbia Plc
GlaxoSmithKline plc
Herbalife
Kellogg Company
Nestlé SA
Nutiva
Onnit Labs
Orgain
SlimFast
The Nature's Bounty Co.
Ultimate Superfoods
*- List Not Exhaustive
Chapter 1. TABLE OF CONTENTS
Chapter 2. Introduction to Meal Replacement Foods Market
2.1. Market Overview
2.2. Key Statistics and Report Highlights
2.3. Scope of the Comprehensive Study
2.3.1. Market Definition
2.3.2 Countries and Regions Covered
2.3.3 Research Objective
2.3.4 Units, Currency, and Conversions
2.3.5 Industry Value Chain
2.4. Key Market Segments
2.5. Key Companies
2.6. Study Period
Chapter 3. Strategic Analysis Review
3.1. Meal Replacement Foods Pricing Analysis and Forecast
3.2. Porter’s Five Forces
3.3. Market Ecosystem
3.4. SWOT Analysis
3.5. Regulatory Scenario
3.3. Effects of Inflation, Russia-Ukraine War, moderating economic growth, and other macroeconomic factors
Chapter 4. Competitive Landscape
4.1. Market Share Analysis
4.1.1. Global Meal Replacement Foods Market Share by Company, 2023
4.1.2. Product Offerings of Leading Meal Replacement Foods Companies
4.2. Market Entropy
4.2.1. New Product Launches in the Industry
4.2.2. Mergers, Acquisitions, Joint ventures, and Partnerships
4.3. Key Strategies and Best Practices
Chapter 5. Global Market Projections: Best, Reference, and Low Case Scenarios
5.1. Growth Analysis- Case Scenario Definitions
5.2. Low Growth Case Scenario Forecasts
5.3. Reference Growth Case Scenario Forecasts
5.4. High Growth Case Scenario Forecasts
Chapter 6. Market Dynamics
6.1. Meal Replacement Foods Market Drivers
6.2. Meal Replacement Foods Market Challenges
6.6. Meal Replacement Foods Market Opportunities
6.4. Meal Replacement Foods Market Trends
Chapter 7. Global Meal Replacement Foods Market Outlook Trends
7.1. Global Meal Replacement Foods Revenue (USD Million) and CAGR (%) by Type (2021-2032)
7.2. Global Meal Replacement Foods Revenue (USD Million) and CAGR (%) by Application (2021-2032)
7.3. Global Meal Replacement Foods Revenue (USD Million) and CAGR (%) by Product (2021-2032)
By Type
Powders
Bars
Drinks
Others
By Sales Channel
Online
Offline
Chapter 8. Global Meal Replacement Foods Regional Analysis and Outlook
8.1. Global Meal Replacement Foods Revenue (USD Million) By Regions (2021- 2032)
8.2. North America Meal Replacement Foods Revenue (USD Million) by Country (2021-2032)
8.2.1. United States Meal Replacement Foods Regional Analysis and Outlook
8.2.2. Canada Meal Replacement Foods Regional Analysis and Outlook
8.2.3. Mexico Meal Replacement Foods Regional Analysis and Outlook
8.3. Europe Meal Replacement Foods Revenue (USD Million), by Country (2021-2032)
8.3.1. Germany Meal Replacement Foods Regional Analysis and Outlook
8.3.2. France Meal Replacement Foods Regional Analysis and Outlook
8.3.3. United Kingdom Meal Replacement Foods Regional Analysis and Outlook
8.3.4. Spain Meal Replacement Foods Regional Analysis and Outlook
8.3.5. Italy Meal Replacement Foods Regional Analysis and Outlook
8.3.6. Russia Meal Replacement Foods Regional Analysis and Outlook
8.3.7. Rest of Europe Meal Replacement Foods Regional Analysis and Outlook
8.4. Asia Pacific Meal Replacement Foods Revenue (USD Million) by Country (2021-2032)
8.4.1. China Meal Replacement Foods Regional Analysis and Outlook
8.4.2. Japan Meal Replacement Foods Regional Analysis and Outlook
8.4.3. India Meal Replacement Foods Regional Analysis and Outlook
8.4.4. South Korea Meal Replacement Foods Regional Analysis and Outlook
8.4.5. Australia Meal Replacement Foods Regional Analysis and Outlook
8.4.6. South East Asia Meal Replacement Foods Regional Analysis and Outlook
8.4.7. Rest of Asia Pacific Meal Replacement Foods Regional Analysis and Outlook
8.5. South America Meal Replacement Foods Revenue (USD Million), by Country (2021-2032)
8.5.1. Brazil Meal Replacement Foods Regional Analysis and Outlook
8.5.2. Argentina Meal Replacement Foods Regional Analysis and Outlook
8.5.3. Rest of South America Meal Replacement Foods Regional Analysis and Outlook
8.6. Middle East and Africa Meal Replacement Foods Revenue (USD Million) by Country (2021-2032)
8.6.1. Middle East Meal Replacement Foods Regional Analysis and Outlook
8.6.2. Africa Meal Replacement Foods Regional Analysis and Outlook
Chapter 9. North America Meal Replacement Foods Analysis and Outlook
9.1. North America Meal Replacement Foods Revenue (USD Million) by Segments (2021-2032)
9.1.1. North America Meal Replacement Foods Revenue (USD Million) by Type (2021-2032)
9.1.2. North America Meal Replacement Foods Revenue (USD Million) by Application (2021-2032)
9.1.3. North America Meal Replacement Foods Revenue (USD Million) by Product (2021-2032)
By Type
Powders
Bars
Drinks
Others
By Sales Channel
Online
Offline
Chapter 10. Europe Meal Replacement Foods Analysis and Outlook
10.1. Europe Meal Replacement Foods Revenue (USD Million), by Segments (USD Million) (2021-2032)
10.1.1. Europe Meal Replacement Foods Revenue (USD Million) by Type (2021-2032)
10.1.2. Europe Meal Replacement Foods Revenue (USD Million) by Application (2021-2032)
10.1.3. Europe Meal Replacement Foods Revenue (USD Million) by Product (2021-2032)
By Type
Powders
Bars
Drinks
Others
By Sales Channel
Online
Offline
Chapter 11. Asia Pacific Meal Replacement Foods Analysis and Outlook
11.1. Asia Pacific Meal Replacement Foods Revenue (USD Million), and Revenue (USD Million) by Segments (2021-2032)
11.1.1. Asia Pacific Meal Replacement Foods Revenue (USD Million) by Type (2021-2032)
11.1.2. Asia Pacific Meal Replacement Foods Revenue (USD Million) by Application (2021-2032)
11.1.3. Asia Pacific Meal Replacement Foods Revenue (USD Million) by Product (2021-2032)
By Type
Powders
Bars
Drinks
Others
By Sales Channel
Online
Offline
Chapter 12. South America Meal Replacement Foods Analysis and Outlook
12.1. South America Meal Replacement Foods Revenue (USD Million), by Segments (2021-2032)
12.1.1. South America Meal Replacement Foods Revenue (USD Million) by Type (2021-2032)
12.1.2. South America Meal Replacement Foods Revenue (USD Million) by Application (2021-2032)
12.1.3. South America Meal Replacement Foods Revenue (USD Million) by Product (2021-2032)
By Type
Powders
Bars
Drinks
Others
By Sales Channel
Online
Offline
Chapter 13. Middle East and Africa Meal Replacement Foods Analysis and Outlook
13.1. Middle East and Africa Meal Replacement Foods Revenue (USD Million), by Segments (2021-2032)
13.1.1. Middle East and Africa Meal Replacement Foods Revenue (USD Million) by Type (2021-2032)
13.1.2. Middle East and Africa Meal Replacement Foods Revenue (USD Million) by Application (2021-2032)
13.1.3. Middle East and Africa Meal Replacement Foods Revenue (USD Million) by Product (2021-2032)
By Type
Powders
Bars
Drinks
Others
By Sales Channel
Online
Offline
Chapter 14. Meal Replacement Foods Company Profiles
14.1 Business Overview
14.2 Product Profiles
14.3 SWOT Profiles
14.5 Recent Developments
14.6 Financial Profile
List of Companies
Abbott Laboratories
Glanbia Plc
GlaxoSmithKline plc
Herbalife
Kellogg Company
Nestlé SA
Nutiva
Onnit Labs
Orgain
SlimFast
The Nature's Bounty Co.
Ultimate Superfoods
15. Methodology and Data Sources
15.1 Customization Offerings
15.2 Subscription Services
15.3 Related Reports
15.4 Publisher Expertise
LIST OF TABLES
Table 1 Market Segmentation Analysis
Table 2 Global Meal Replacement Foods Market Share of Leading Companies, 2023
Table 3 Product Offerings of Leading Companies
Table 4 Low Growth Scenario Forecasts
Table 5 Reference Case Growth Scenario
Table 6 High Growth Case Scenario
Table 7 Global Meal Replacement Foods Revenue (USD Million) And CAGR (%) By Type (2021-2032)
Table 8 Global Meal Replacement Foods Revenue (USD Million) And CAGR (%) By Application (2021-2032)
Table 9 Global Meal Replacement Foods Revenue (USD Million) And CAGR (%) By Product (2021-2032)
Table 10 Global Meal Replacement Foods Market Revenue (USD Million) By Regions (2021-2032)
Table 11 Global Meal Replacement Foods Market Share (%) By Regions (2021-2032)
Table 12 North America Meal Replacement Foods Revenue (USD Million) By Country (2021-2032)
Table 13 Europe Meal Replacement Foods Revenue (USD Million) By Country (2021-2032)
Table 14 Asia Pacific Meal Replacement Foods Revenue (USD Million) By Country (2021-2032)
Table 15 South America Meal Replacement Foods Revenue (USD Million) By Country (2021-2032)
Table 16 Middle East and Africa Meal Replacement Foods Revenue (USD Million) By Region (2021-2032)
Table 17 North America Meal Replacement Foods Revenue (USD Million) By Type (2021-2032)
Table 18 North America Meal Replacement Foods Revenue (USD Million) By Application (2021-2032)
Table 19 North America Meal Replacement Foods Revenue (USD Million) By Product (2021-2032)
Table 20 Europe Meal Replacement Foods Revenue (USD Million) By Type (2021-2032)
Table 21 Europe Meal Replacement Foods Revenue (USD Million) By Application (2021-2032)
Table 22 Europe Meal Replacement Foods Revenue (USD Million) By Product (2021-2032)
Table 23 Asia Pacific Meal Replacement Foods Revenue (USD Million) By Type (2021-2032)
Table 24 Asia Pacific Meal Replacement Foods Revenue (USD Million) By Application (2021-2032)
Table 25 Asia Pacific Meal Replacement Foods Revenue (USD Million) By Product (2021-2032)
Table 26 South America Meal Replacement Foods Revenue (USD Million) By Type (2021-2032)
Table 27 South America Meal Replacement Foods Revenue (USD Million) By Application (2021-2032)
Table 28 South America Meal Replacement Foods Revenue (USD Million) By Product (2021-2032)
Table 29 Middle East and Africa Meal Replacement Foods Revenue (USD Million) By Type (2021-2032)
Table 30 Middle East and Africa Meal Replacement Foods Revenue (USD Million) By Application (2021-2032)
Table 31 Middle East and Africa Meal Replacement Foods Revenue (USD Million) By Product (2021-2032)
LIST OF FIGURES
Figure 1. Market Scope
Figure 2. Pricing Forecasts Per Unit, 2023- 2032
Figure 3. Porter’s Five Forces
Figure 4. Global Meal Replacement Foods Market Revenue (USD Million) By Regions (2021-2032)
Figure 5. Global Meal Replacement Foods Market Share (%) By Regions (2023)
Figure 6. North America Meal Replacement Foods Revenue (USD Million) By Country (2021-2032)
Figure 7. United States Meal Replacement Foods Revenue (USD Million) By Country (2021-2032)
Figure 8. Canada Meal Replacement Foods Revenue (USD Million) By Country (2021-2032)
Figure 9. Mexico Meal Replacement Foods Revenue (USD Million) By Country (2021-2032)
Figure 10. Europe Meal Replacement Foods Revenue (USD Million) By Country (2021-2032)
Figure 11. Germany Meal Replacement Foods Revenue (USD Million) By Country (2021-2032)
Figure 12. France Meal Replacement Foods Revenue (USD Million) By Country (2021-2032)
Figure 13. United Kingdom Meal Replacement Foods Revenue (USD Million) By Country (2021-2032)
Figure 14. Spain Meal Replacement Foods Revenue (USD Million) By Country (2021-2032)
Figure 15. Italy Meal Replacement Foods Revenue (USD Million) By Country (2021-2032)
Figure 16. Russia Meal Replacement Foods Revenue (USD Million) By Country (2021-2032)
Figure 17. Rest of Europe Meal Replacement Foods Revenue (USD Million) By Country (2021-2032)
Figure 11. Asia Pacific Meal Replacement Foods Revenue (USD Million) By Country (2021-2032)
Figure 12. China Meal Replacement Foods Revenue (USD Million) By Country (2021-2032)
Figure 13. Japan Meal Replacement Foods Revenue (USD Million) By Country (2021-2032)
Figure 14. India Meal Replacement Foods Revenue (USD Million) By Country (2021-2032)
Figure 15. South Korea Meal Replacement Foods Revenue (USD Million) By Country (2021-2032)
Figure 16. Australia Meal Replacement Foods Revenue (USD Million) By Country (2021-2032)
Figure 17. South East Asia Meal Replacement Foods Revenue (USD Million) By Country (2021-2032)
Figure 18. South America Meal Replacement Foods Revenue (USD Million) By Country (2021-2032)
Figure 19. Brazil Meal Replacement Foods Revenue (USD Million) By Country (2021-2032)
Figure 20. Argentina Meal Replacement Foods Revenue (USD Million) By Country (2021-2032)
Figure 21. Rest of Asia Pacific Meal Replacement Foods Revenue (USD Million) By Country (2021-2032)
Figure 22. Middle East and Africa Meal Replacement Foods Revenue (USD Million) By Region (2021-2032)
Figure 23. Saudi Arabia Meal Replacement Foods Revenue (USD Million) By Region (2021-2032)
Figure 24. The UAE Meal Replacement Foods Revenue (USD Million) By Region (2021-2032)
Figure 25. Rest of Middle East Meal Replacement Foods Revenue (USD Million) By Region (2021-2032)
Figure 26. South Africa Meal Replacement Foods Revenue (USD Million) By Region (2021-2032)
Figure 27. Africa Meal Replacement Foods Revenue (USD Million) By Region (2021-2032)
Figure 28. North America Meal Replacement Foods Revenue (USD Million) By Type (2021-2032)
Figure 29. North America Meal Replacement Foods Revenue (USD Million) By Application (2021-2032)
Figure 30. North America Meal Replacement Foods Revenue (USD Million) By Product (2021-2032)
Figure 31. Europe Meal Replacement Foods Revenue (USD Million) By Type (2021-2032)
Figure 32. Europe Meal Replacement Foods Revenue (USD Million) By Application (2021-2032)
Figure 33. Europe Meal Replacement Foods Revenue (USD Million) By Product (2021-2032)
Figure 34. Asia Pacific Meal Replacement Foods Revenue (USD Million) By Type (2021-2032)
Figure 35. Asia Pacific Meal Replacement Foods Revenue (USD Million) By Application (2021-2032)
Figure 36. Asia Pacific Meal Replacement Foods Revenue (USD Million) By Product (2021-2032)
Figure 37. South America Meal Replacement Foods Revenue (USD Million) By Type (2021-2032)
Figure 38. South America Meal Replacement Foods Revenue (USD Million) By Application (2021-2032)
Figure 39. South America Meal Replacement Foods Revenue (USD Million) By Product (2021-2032)
Figure 40. Middle East and Africa Meal Replacement Foods Revenue (USD Million) By Type (2021-2032)
Figure 41. Middle East and Africa Meal Replacement Foods Revenue (USD Million) By Application (2021-2032)
Figure 42. Middle East and Africa Meal Replacement Foods Revenue (USD Million) By Product (2021-2032)
By Type
Powders
Bars
Drinks
Others
By Sales Channel
Online
Offline
Countries Analyzed
North America (US, Canada, Mexico)
Europe (Germany, UK, France, Spain, Italy, Russia, Rest of Europe)
Asia Pacific (China, India, Japan, South Korea, Australia, South East Asia, Rest of Asia)
South America (Brazil, Argentina, Rest of South America)
Middle East and Africa (Saudi Arabia, UAE, Rest of Middle East, South Africa, Egypt, Rest of Africa)
