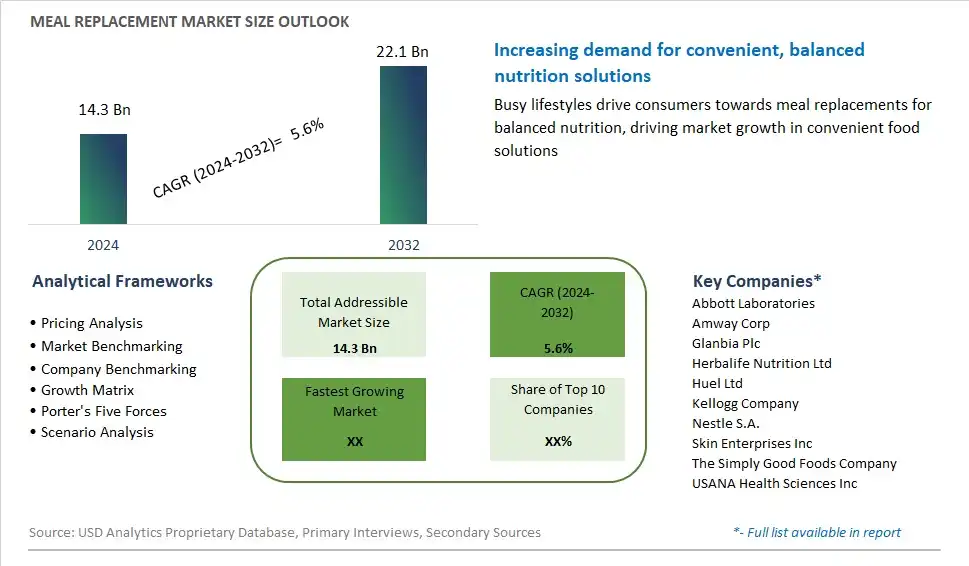
Global Meal Replacement Market Size is valued at $14.3 Billion in 2024 and is forecast to register a growth rate (CAGR) of 5.6% to reach $22.1 Billion by 2032.
The global Meal Replacement Market Comprehensive Study analyzes and forecasts the market size across 6 regions and 24 countries for diverse segments -By Product (Powder, Ready-to-drink, Bars, Others), By Distribution Channel (Offline, Online)
An Introduction to Meal Replacement Market
Meal replacements are food products designed to replace one or more regular meals while providing balanced nutrition, convenience, and portion control in 2024. These products come in various formats such as shakes, bars, powders, and ready-to-drink beverages, offering a convenient and portable alternative to traditional meals for busy consumers seeking quick and nutritious options. Meal replacements typically contain a mix of macronutrients, vitamins, minerals, and fiber to provide essential nutrients and support satiety and energy levels throughout the day. With advancements in nutritional science, formulation technology, and consumer insights, manufacturers can develop meal replacement products that cater to specific dietary needs and lifestyle preferences, including weight management, sports nutrition, and healthy aging. As consumer demand for convenience, health, and personalized nutrition grows, the market for meal replacements is expected to expand, driven by innovations in product development, packaging formats, and distribution channels that deliver convenient, nutritious, and satisfying meal solutions to meet evolving market demands and consumer expectations.
Meal Replacement Competitive Landscape
The market report analyses the leading companies in the industry including Abbott Laboratories, Amway Corp, Glanbia Plc, Herbalife Nutrition Ltd, Huel Ltd, Kellogg Company, Nestle S.A., Skin Enterprises Inc, The Simply Good Foods Company, USANA Health Sciences Inc, and Others.
Meal Replacement Market Dynamics
Meal Replacement Market Trend: Shift Towards Healthy and Convenient Eating Habits
The market trend for meal replacements is characterized by a shift towards healthy and convenient eating habits among consumers, driven by busy lifestyles, increasing health consciousness, and the demand for on-the-go nutrition solutions. Meal replacement products offer a convenient and nutritionally balanced alternative to traditional meals, providing essential nutrients, vitamins, and minerals in a convenient format. This trend is further accelerated by the rise of meal delivery services, subscription-based meal plans, and digital platforms offering personalized nutrition solutions tailored to individual dietary preferences and health goals. As consumers seek convenient ways to maintain a balanced diet amidst hectic schedules, meal replacements emerge as a viable option for satisfying nutritional needs without compromising on taste, quality, or convenience.
Market Driver: Growing Focus on Weight Management and Healthy Aging
A key driver propelling the market for meal replacements is the growing focus on weight management and healthy aging among consumers worldwide. Meal replacement products are widely used as part of weight loss and weight management programs, offering portion-controlled meals with controlled calorie and macronutrient content. Additionally, meal replacements play a crucial role in supporting healthy aging by providing nutrient-dense options for older adults who may have difficulty preparing or consuming traditional meals due to mobility issues or medical conditions. With obesity rates on the rise and an aging population seeking solutions to maintain vitality and independence, the demand for meal replacements as a convenient and effective tool for managing weight and supporting overall health continues to grow.
Market Opportunity: Expansion into Targeted Nutrition and Functional Ingredients
An opportunity within the meal replacement market lies in the expansion into targeted nutrition and the incorporation of functional ingredients to address specific health concerns and consumer preferences. While meal replacements traditionally focus on providing basic nutrition and meal replacement shakes, there's potential for innovation in formulations tailored to meet the diverse needs of different consumer segments. For example, meal replacements fortified with protein, fiber, and probiotics can appeal to fitness enthusiasts and athletes seeking muscle recovery and digestive health support. Similarly, meal replacements enriched with vitamins, antioxidants, and omega-3 fatty acids can target consumers interested in immune support, cognitive function, and heart health. By leveraging functional ingredients and personalized nutrition approaches, manufacturers can create value-added meal replacement products that cater to specific dietary requirements, lifestyles, and wellness goals, thus unlocking new opportunities for growth and market differentiation.
Meal Replacement Market Share Analysis: Ready-to-Drink held the dominant market share in 2024
Within the meal replacement market, the ready-to-drink segment is the largest, driven by its convenience, accessibility, and widespread adoption among consumers seeking on-the-go nutrition solutions. Ready-to-drink meal replacements offer a convenient and time-saving option for busy individuals looking to maintain a balanced diet amidst hectic lifestyles. These products are pre-packaged and require no preparation, making them ideal for consumption at home, work, or while traveling. Further, ready-to-drink meal replacements come in a variety of flavors and formulations to cater to different dietary preferences and nutritional needs, further expanding their appeal among consumers. As the demand for convenient and nutritionally balanced meal options continues to rise, the ready-to-drink segment maintains its dominance in the meal replacement market, solidifying its position as the preferred choice for consumers seeking convenient and nutritious alternatives to traditional meals.
Meal Replacement Market Share Analysis: Online market is poised to register the fastest growth rae over the forecast period to 2032
Among the distribution channels in the meal replacement market, the online segment is the fastest-growing, driven by the increasing consumer preference for e-commerce platforms and the convenience of online shopping. The online distribution channel offers consumers a convenient and efficient way to purchase meal replacement products from the comfort of their homes, with the added benefits of doorstep delivery and a wide selection of products. Additionally, the rise of digital marketing and social media platforms has enabled brands to reach a broader audience and engage with consumers directly, further driving sales through online channels. Further, the COVID-19 pandemic has accelerated the shift towards online shopping as consumers prioritize safety and convenience. As the trend towards digitalization and online shopping continues to evolve, the online segment of the meal replacement market is poised for significant growth, presenting lucrative opportunities for brands and retailers in the digital space.
Meal Replacement Market Segmentation
By Product
Powder
Ready-to-drink
Bars
Others
By Distribution Channel
Offline
-Hypermarkets/Supermarkets
-Convenience stores
-Specialty stores
-Others
Online
Countries Analyzed
North America (US, Canada, Mexico)
Europe (Germany, UK, France, Spain, Italy, Russia, Rest of Europe)
Asia Pacific (China, India, Japan, South Korea, Australia, South East Asia, Rest of Asia)
South America (Brazil, Argentina, Rest of South America)
Middle East and Africa (Saudi Arabia, UAE, Rest of Middle East, South Africa, Egypt, Rest of Africa)
Meal Replacement Companies Profiled in the Study
Abbott Laboratories
Amway Corp
Glanbia Plc
Herbalife Nutrition Ltd
Huel Ltd
Kellogg Company
Nestle S.A.
Skin Enterprises Inc
The Simply Good Foods Company
USANA Health Sciences Inc
*- List Not Exhaustive
Chapter 1. TABLE OF CONTENTS
Chapter 2. Introduction to Meal Replacement Market
2.1. Market Overview
2.2. Key Statistics and Report Highlights
2.3. Scope of the Comprehensive Study
2.3.1. Market Definition
2.3.2 Countries and Regions Covered
2.3.3 Research Objective
2.3.4 Units, Currency, and Conversions
2.3.5 Industry Value Chain
2.4. Key Market Segments
2.5. Key Companies
2.6. Study Period
Chapter 3. Strategic Analysis Review
3.1. Meal Replacement Pricing Analysis and Forecast
3.2. Porter’s Five Forces
3.3. Market Ecosystem
3.4. SWOT Analysis
3.5. Regulatory Scenario
3.3. Effects of Inflation, Russia-Ukraine War, moderating economic growth, and other macroeconomic factors
Chapter 4. Competitive Landscape
4.1. Market Share Analysis
4.1.1. Global Meal Replacement Market Share by Company, 2023
4.1.2. Product Offerings of Leading Meal Replacement Companies
4.2. Market Entropy
4.2.1. New Product Launches in the Industry
4.2.2. Mergers, Acquisitions, Joint ventures, and Partnerships
4.3. Key Strategies and Best Practices
Chapter 5. Global Market Projections: Best, Reference, and Low Case Scenarios
5.1. Growth Analysis- Case Scenario Definitions
5.2. Low Growth Case Scenario Forecasts
5.3. Reference Growth Case Scenario Forecasts
5.4. High Growth Case Scenario Forecasts
Chapter 6. Market Dynamics
6.1. Meal Replacement Market Drivers
6.2. Meal Replacement Market Challenges
6.6. Meal Replacement Market Opportunities
6.4. Meal Replacement Market Trends
Chapter 7. Global Meal Replacement Market Outlook Trends
7.1. Global Meal Replacement Revenue (USD Million) and CAGR (%) by Type (2021-2032)
7.2. Global Meal Replacement Revenue (USD Million) and CAGR (%) by Application (2021-2032)
7.3. Global Meal Replacement Revenue (USD Million) and CAGR (%) by Product (2021-2032)
By Product
Powder
Ready-to-drink
Bars
Others
By Distribution Channel
Offline
-Hypermarkets/Supermarkets
-Convenience stores
-Specialty stores
-Others
Online
Chapter 8. Global Meal Replacement Regional Analysis and Outlook
8.1. Global Meal Replacement Revenue (USD Million) By Regions (2021- 2032)
8.2. North America Meal Replacement Revenue (USD Million) by Country (2021-2032)
8.2.1. United States Meal Replacement Regional Analysis and Outlook
8.2.2. Canada Meal Replacement Regional Analysis and Outlook
8.2.3. Mexico Meal Replacement Regional Analysis and Outlook
8.3. Europe Meal Replacement Revenue (USD Million), by Country (2021-2032)
8.3.1. Germany Meal Replacement Regional Analysis and Outlook
8.3.2. France Meal Replacement Regional Analysis and Outlook
8.3.3. United Kingdom Meal Replacement Regional Analysis and Outlook
8.3.4. Spain Meal Replacement Regional Analysis and Outlook
8.3.5. Italy Meal Replacement Regional Analysis and Outlook
8.3.6. Russia Meal Replacement Regional Analysis and Outlook
8.3.7. Rest of Europe Meal Replacement Regional Analysis and Outlook
8.4. Asia Pacific Meal Replacement Revenue (USD Million) by Country (2021-2032)
8.4.1. China Meal Replacement Regional Analysis and Outlook
8.4.2. Japan Meal Replacement Regional Analysis and Outlook
8.4.3. India Meal Replacement Regional Analysis and Outlook
8.4.4. South Korea Meal Replacement Regional Analysis and Outlook
8.4.5. Australia Meal Replacement Regional Analysis and Outlook
8.4.6. South East Asia Meal Replacement Regional Analysis and Outlook
8.4.7. Rest of Asia Pacific Meal Replacement Regional Analysis and Outlook
8.5. South America Meal Replacement Revenue (USD Million), by Country (2021-2032)
8.5.1. Brazil Meal Replacement Regional Analysis and Outlook
8.5.2. Argentina Meal Replacement Regional Analysis and Outlook
8.5.3. Rest of South America Meal Replacement Regional Analysis and Outlook
8.6. Middle East and Africa Meal Replacement Revenue (USD Million) by Country (2021-2032)
8.6.1. Middle East Meal Replacement Regional Analysis and Outlook
8.6.2. Africa Meal Replacement Regional Analysis and Outlook
Chapter 9. North America Meal Replacement Analysis and Outlook
9.1. North America Meal Replacement Revenue (USD Million) by Segments (2021-2032)
9.1.1. North America Meal Replacement Revenue (USD Million) by Type (2021-2032)
9.1.2. North America Meal Replacement Revenue (USD Million) by Application (2021-2032)
9.1.3. North America Meal Replacement Revenue (USD Million) by Product (2021-2032)
By Product
Powder
Ready-to-drink
Bars
Others
By Distribution Channel
Offline
-Hypermarkets/Supermarkets
-Convenience stores
-Specialty stores
-Others
Online
Chapter 10. Europe Meal Replacement Analysis and Outlook
10.1. Europe Meal Replacement Revenue (USD Million), by Segments (USD Million) (2021-2032)
10.1.1. Europe Meal Replacement Revenue (USD Million) by Type (2021-2032)
10.1.2. Europe Meal Replacement Revenue (USD Million) by Application (2021-2032)
10.1.3. Europe Meal Replacement Revenue (USD Million) by Product (2021-2032)
By Product
Powder
Ready-to-drink
Bars
Others
By Distribution Channel
Offline
-Hypermarkets/Supermarkets
-Convenience stores
-Specialty stores
-Others
Online
Chapter 11. Asia Pacific Meal Replacement Analysis and Outlook
11.1. Asia Pacific Meal Replacement Revenue (USD Million), and Revenue (USD Million) by Segments (2021-2032)
11.1.1. Asia Pacific Meal Replacement Revenue (USD Million) by Type (2021-2032)
11.1.2. Asia Pacific Meal Replacement Revenue (USD Million) by Application (2021-2032)
11.1.3. Asia Pacific Meal Replacement Revenue (USD Million) by Product (2021-2032)
By Product
Powder
Ready-to-drink
Bars
Others
By Distribution Channel
Offline
-Hypermarkets/Supermarkets
-Convenience stores
-Specialty stores
-Others
Online
Chapter 12. South America Meal Replacement Analysis and Outlook
12.1. South America Meal Replacement Revenue (USD Million), by Segments (2021-2032)
12.1.1. South America Meal Replacement Revenue (USD Million) by Type (2021-2032)
12.1.2. South America Meal Replacement Revenue (USD Million) by Application (2021-2032)
12.1.3. South America Meal Replacement Revenue (USD Million) by Product (2021-2032)
By Product
Powder
Ready-to-drink
Bars
Others
By Distribution Channel
Offline
-Hypermarkets/Supermarkets
-Convenience stores
-Specialty stores
-Others
Online
Chapter 13. Middle East and Africa Meal Replacement Analysis and Outlook
13.1. Middle East and Africa Meal Replacement Revenue (USD Million), by Segments (2021-2032)
13.1.1. Middle East and Africa Meal Replacement Revenue (USD Million) by Type (2021-2032)
13.1.2. Middle East and Africa Meal Replacement Revenue (USD Million) by Application (2021-2032)
13.1.3. Middle East and Africa Meal Replacement Revenue (USD Million) by Product (2021-2032)
By Product
Powder
Ready-to-drink
Bars
Others
By Distribution Channel
Offline
-Hypermarkets/Supermarkets
-Convenience stores
-Specialty stores
-Others
Online
Chapter 14. Meal Replacement Company Profiles
14.1 Business Overview
14.2 Product Profiles
14.3 SWOT Profiles
14.5 Recent Developments
14.6 Financial Profile
List of Companies
Abbott Laboratories
Amway Corp
Glanbia Plc
Herbalife Nutrition Ltd
Huel Ltd
Kellogg Company
Nestle S.A.
Skin Enterprises Inc
The Simply Good Foods Company
USANA Health Sciences Inc
15. Methodology and Data Sources
15.1 Customization Offerings
15.2 Subscription Services
15.3 Related Reports
15.4 Publisher Expertise
LIST OF TABLES
Table 1 Market Segmentation Analysis
Table 2 Global Meal Replacement Market Share of Leading Companies, 2023
Table 3 Product Offerings of Leading Companies
Table 4 Low Growth Scenario Forecasts
Table 5 Reference Case Growth Scenario
Table 6 High Growth Case Scenario
Table 7 Global Meal Replacement Revenue (USD Million) And CAGR (%) By Type (2021-2032)
Table 8 Global Meal Replacement Revenue (USD Million) And CAGR (%) By Application (2021-2032)
Table 9 Global Meal Replacement Revenue (USD Million) And CAGR (%) By Product (2021-2032)
Table 10 Global Meal Replacement Market Revenue (USD Million) By Regions (2021-2032)
Table 11 Global Meal Replacement Market Share (%) By Regions (2021-2032)
Table 12 North America Meal Replacement Revenue (USD Million) By Country (2021-2032)
Table 13 Europe Meal Replacement Revenue (USD Million) By Country (2021-2032)
Table 14 Asia Pacific Meal Replacement Revenue (USD Million) By Country (2021-2032)
Table 15 South America Meal Replacement Revenue (USD Million) By Country (2021-2032)
Table 16 Middle East and Africa Meal Replacement Revenue (USD Million) By Region (2021-2032)
Table 17 North America Meal Replacement Revenue (USD Million) By Type (2021-2032)
Table 18 North America Meal Replacement Revenue (USD Million) By Application (2021-2032)
Table 19 North America Meal Replacement Revenue (USD Million) By Product (2021-2032)
Table 20 Europe Meal Replacement Revenue (USD Million) By Type (2021-2032)
Table 21 Europe Meal Replacement Revenue (USD Million) By Application (2021-2032)
Table 22 Europe Meal Replacement Revenue (USD Million) By Product (2021-2032)
Table 23 Asia Pacific Meal Replacement Revenue (USD Million) By Type (2021-2032)
Table 24 Asia Pacific Meal Replacement Revenue (USD Million) By Application (2021-2032)
Table 25 Asia Pacific Meal Replacement Revenue (USD Million) By Product (2021-2032)
Table 26 South America Meal Replacement Revenue (USD Million) By Type (2021-2032)
Table 27 South America Meal Replacement Revenue (USD Million) By Application (2021-2032)
Table 28 South America Meal Replacement Revenue (USD Million) By Product (2021-2032)
Table 29 Middle East and Africa Meal Replacement Revenue (USD Million) By Type (2021-2032)
Table 30 Middle East and Africa Meal Replacement Revenue (USD Million) By Application (2021-2032)
Table 31 Middle East and Africa Meal Replacement Revenue (USD Million) By Product (2021-2032)
LIST OF FIGURES
Figure 1. Market Scope
Figure 2. Pricing Forecasts Per Unit, 2023- 2032
Figure 3. Porter’s Five Forces
Figure 4. Global Meal Replacement Market Revenue (USD Million) By Regions (2021-2032)
Figure 5. Global Meal Replacement Market Share (%) By Regions (2023)
Figure 6. North America Meal Replacement Revenue (USD Million) By Country (2021-2032)
Figure 7. United States Meal Replacement Revenue (USD Million) By Country (2021-2032)
Figure 8. Canada Meal Replacement Revenue (USD Million) By Country (2021-2032)
Figure 9. Mexico Meal Replacement Revenue (USD Million) By Country (2021-2032)
Figure 10. Europe Meal Replacement Revenue (USD Million) By Country (2021-2032)
Figure 11. Germany Meal Replacement Revenue (USD Million) By Country (2021-2032)
Figure 12. France Meal Replacement Revenue (USD Million) By Country (2021-2032)
Figure 13. United Kingdom Meal Replacement Revenue (USD Million) By Country (2021-2032)
Figure 14. Spain Meal Replacement Revenue (USD Million) By Country (2021-2032)
Figure 15. Italy Meal Replacement Revenue (USD Million) By Country (2021-2032)
Figure 16. Russia Meal Replacement Revenue (USD Million) By Country (2021-2032)
Figure 17. Rest of Europe Meal Replacement Revenue (USD Million) By Country (2021-2032)
Figure 11. Asia Pacific Meal Replacement Revenue (USD Million) By Country (2021-2032)
Figure 12. China Meal Replacement Revenue (USD Million) By Country (2021-2032)
Figure 13. Japan Meal Replacement Revenue (USD Million) By Country (2021-2032)
Figure 14. India Meal Replacement Revenue (USD Million) By Country (2021-2032)
Figure 15. South Korea Meal Replacement Revenue (USD Million) By Country (2021-2032)
Figure 16. Australia Meal Replacement Revenue (USD Million) By Country (2021-2032)
Figure 17. South East Asia Meal Replacement Revenue (USD Million) By Country (2021-2032)
Figure 18. South America Meal Replacement Revenue (USD Million) By Country (2021-2032)
Figure 19. Brazil Meal Replacement Revenue (USD Million) By Country (2021-2032)
Figure 20. Argentina Meal Replacement Revenue (USD Million) By Country (2021-2032)
Figure 21. Rest of Asia Pacific Meal Replacement Revenue (USD Million) By Country (2021-2032)
Figure 22. Middle East and Africa Meal Replacement Revenue (USD Million) By Region (2021-2032)
Figure 23. Saudi Arabia Meal Replacement Revenue (USD Million) By Region (2021-2032)
Figure 24. The UAE Meal Replacement Revenue (USD Million) By Region (2021-2032)
Figure 25. Rest of Middle East Meal Replacement Revenue (USD Million) By Region (2021-2032)
Figure 26. South Africa Meal Replacement Revenue (USD Million) By Region (2021-2032)
Figure 27. Africa Meal Replacement Revenue (USD Million) By Region (2021-2032)
Figure 28. North America Meal Replacement Revenue (USD Million) By Type (2021-2032)
Figure 29. North America Meal Replacement Revenue (USD Million) By Application (2021-2032)
Figure 30. North America Meal Replacement Revenue (USD Million) By Product (2021-2032)
Figure 31. Europe Meal Replacement Revenue (USD Million) By Type (2021-2032)
Figure 32. Europe Meal Replacement Revenue (USD Million) By Application (2021-2032)
Figure 33. Europe Meal Replacement Revenue (USD Million) By Product (2021-2032)
Figure 34. Asia Pacific Meal Replacement Revenue (USD Million) By Type (2021-2032)
Figure 35. Asia Pacific Meal Replacement Revenue (USD Million) By Application (2021-2032)
Figure 36. Asia Pacific Meal Replacement Revenue (USD Million) By Product (2021-2032)
Figure 37. South America Meal Replacement Revenue (USD Million) By Type (2021-2032)
Figure 38. South America Meal Replacement Revenue (USD Million) By Application (2021-2032)
Figure 39. South America Meal Replacement Revenue (USD Million) By Product (2021-2032)
Figure 40. Middle East and Africa Meal Replacement Revenue (USD Million) By Type (2021-2032)
Figure 41. Middle East and Africa Meal Replacement Revenue (USD Million) By Application (2021-2032)
Figure 42. Middle East and Africa Meal Replacement Revenue (USD Million) By Product (2021-2032)
By Product
Powder
Ready-to-drink
Bars
Others
By Distribution Channel
Offline
-Hypermarkets/Supermarkets
-Convenience stores
-Specialty stores
-Others
Online
Countries Analyzed
North America (US, Canada, Mexico)
Europe (Germany, UK, France, Spain, Italy, Russia, Rest of Europe)
Asia Pacific (China, India, Japan, South Korea, Australia, South East Asia, Rest of Asia)
South America (Brazil, Argentina, Rest of South America)
Middle East and Africa (Saudi Arabia, UAE, Rest of Middle East, South Africa, Egypt, Rest of Africa)
