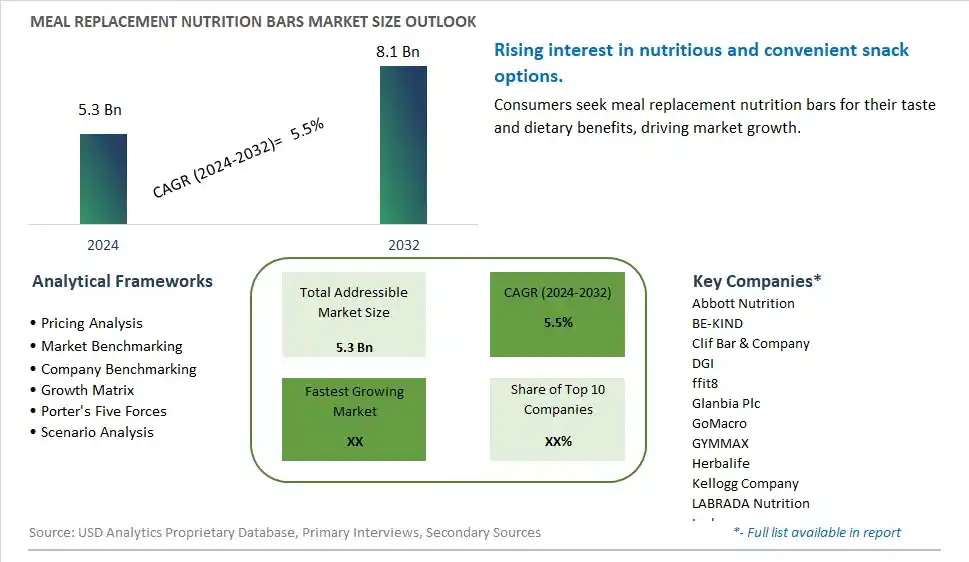
Global Meal Replacement Nutrition Bars Market Size is valued at $5.3 Billion in 2024 and is forecast to register a growth rate (CAGR) of 5.5% to reach $8.1 Billion by 2032.
The global Meal Replacement Nutrition Bars Market Comprehensive Study analyzes and forecasts the market size across 6 regions and 24 countries for diverse segments -By Type (Nuts, Fruit, Vegetable and Cereal, Others), By Sales Channel (Online, Offline)
An Introduction to Meal Replacement Nutrition Bars Market
In 2024, the meal replacement nutrition bars market is thriving, fueled by the demand for convenient, nutrient-dense snacks that cater to busy lifestyles and health-conscious consumers. Meal replacement nutrition bars, formulated to provide balanced nutrition, are popular for their portability and ease of use. The market benefits from innovations in bar formulations and ingredient sourcing that enhance taste, texture, and nutritional value. The trend towards clean label and natural ingredients is influencing product development. Increasing consumer interest in fitness, wellness, and dietary convenience is further supporting market growth for meal replacement nutrition bars.
Meal Replacement Nutrition Bars Competitive Landscape
The market report analyses the leading companies in the industry including Abbott Nutrition, BE-KIND, Clif Bar & Company, DGI, ffit8, Glanbia Plc, GoMacro, GYMMAX, Herbalife, Kellogg Company, LABRADA Nutrition, Lvshou, OPTISLIM, PhD, Quest Nutrition, Rise Bar, Simply Protein, and Others.
Meal Replacement Nutrition Bars Market Dynamics
Meal Replacement Nutrition Bars Market Trend: Growing Popularity of On-the-Go Nutritional Solutions
The most prominent trend in the Meal Replacement Nutrition Bars Market is the growing popularity of on-the-go nutritional solutions. Consumers are seeking meal replacement bars that provide balanced nutrition and can be easily consumed while traveling, working, or exercising. This trend is driven by busy lifestyles and the demand for quick and convenient meal options.
Meal Replacement Nutrition Bars Market Driver: Health Consciousness and Focus on Weight Management
A key driver in the Meal Replacement Nutrition Bars Market is health consciousness and the focus on weight management. As more individuals adopt healthier eating habits and seek to manage their weight, there is a rising demand for meal replacement bars that offer essential nutrients while supporting weight loss or maintenance. This driver supports the expansion of the market as manufacturers cater to health-conscious consumers.
Meal Replacement Nutrition Bars Market Opportunity: Innovation in Flavors and Functional Ingredients
One significant opportunity in the Meal Replacement Nutrition Bars Market lies in innovation in flavors and functional ingredients. Companies can develop new meal replacement bars with unique flavor profiles, such as exotic fruits or indulgent dessert flavors, and incorporate functional ingredients, such as protein, fiber, and probiotics. By offering diverse and health-focused options, manufacturers can attract a broader consumer base and drive market growth.
Meal Replacement Nutrition Bars Market Share Analysis: Nuts segment generated the highest revenue share in the industry
Nuts-based meal replacement nutrition bars emerge as the largest segment within the market. This segment's dominance is driven by the nutritional benefits and consumer preference for bars enriched with nuts such as almonds, peanuts, cashews, and walnuts. Nuts provide essential nutrients like protein, healthy fats, vitamins, and minerals, making them a popular choice among health-conscious consumers seeking satiety and sustained energy from their meal replacements. Nuts also contribute to the texture, flavor, and overall sensory appeal of nutrition bars, offering a crunchy and satisfying eating experience. Their natural goodness and perceived health benefits align with current dietary trends focused on whole foods and clean eating, further solidifying the nuts segment's position as the leading choice in the meal replacement nutrition bars market.
Meal Replacement Nutrition Bars Market Share Analysis: Online Sales Channel is the fastest growing segment over the forecast period to 2032
The online sales channel is anticipated to be the fastest growing segment in the Meal Replacement Nutrition Bars Market by 2032. This growth is fueled by the increasing popularity of e-commerce platforms, which offer convenience, accessibility, and a wide range of product options to consumers. Online channels provide a platform for consumers to explore and purchase meal replacement nutrition bars from various brands, compare prices, read reviews, and access special promotions and discounts. The flexibility of online shopping allows consumers to tailor their purchases to specific dietary needs and preferences, including gluten-free, vegan, or high-protein options. Manufacturers and retailers are leveraging digital marketing strategies, social media engagement, and seamless delivery services to enhance the online shopping experience for meal replacement bars, catering to a diverse and expanding market of health-conscious consumers seeking convenient nutrition solutions.
Meal Replacement Nutrition Bars Market Segmentation
By Type
Nuts
Fruit
Vegetable and Cereal
Others
By Sales Channel
Online
Offline
Countries Analyzed
North America (US, Canada, Mexico)
Europe (Germany, UK, France, Spain, Italy, Russia, Rest of Europe)
Asia Pacific (China, India, Japan, South Korea, Australia, South East Asia, Rest of Asia)
South America (Brazil, Argentina, Rest of South America)
Middle East and Africa (Saudi Arabia, UAE, Rest of Middle East, South Africa, Egypt, Rest of Africa)
Meal Replacement Nutrition Bars Companies Profiled in the Study
Abbott Nutrition
BE-KIND
Clif Bar & Company
DGI
ffit8
Glanbia Plc
GoMacro
GYMMAX
Herbalife
Kellogg Company
LABRADA Nutrition
Lvshou
OPTISLIM
PhD
Quest Nutrition
Rise Bar
Simply Protein
*- List Not Exhaustive
Chapter 1. TABLE OF CONTENTS
Chapter 2. Introduction to Meal Replacement Nutrition Bars Market
2.1. Market Overview
2.2. Key Statistics and Report Highlights
2.3. Scope of the Comprehensive Study
2.3.1. Market Definition
2.3.2 Countries and Regions Covered
2.3.3 Research Objective
2.3.4 Units, Currency, and Conversions
2.3.5 Industry Value Chain
2.4. Key Market Segments
2.5. Key Companies
2.6. Study Period
Chapter 3. Strategic Analysis Review
3.1. Meal Replacement Nutrition Bars Pricing Analysis and Forecast
3.2. Porter’s Five Forces
3.3. Market Ecosystem
3.4. SWOT Analysis
3.5. Regulatory Scenario
3.3. Effects of Inflation, Russia-Ukraine War, moderating economic growth, and other macroeconomic factors
Chapter 4. Competitive Landscape
4.1. Market Share Analysis
4.1.1. Global Meal Replacement Nutrition Bars Market Share by Company, 2023
4.1.2. Product Offerings of Leading Meal Replacement Nutrition Bars Companies
4.2. Market Entropy
4.2.1. New Product Launches in the Industry
4.2.2. Mergers, Acquisitions, Joint ventures, and Partnerships
4.3. Key Strategies and Best Practices
Chapter 5. Global Market Projections: Best, Reference, and Low Case Scenarios
5.1. Growth Analysis- Case Scenario Definitions
5.2. Low Growth Case Scenario Forecasts
5.3. Reference Growth Case Scenario Forecasts
5.4. High Growth Case Scenario Forecasts
Chapter 6. Market Dynamics
6.1. Meal Replacement Nutrition Bars Market Drivers
6.2. Meal Replacement Nutrition Bars Market Challenges
6.6. Meal Replacement Nutrition Bars Market Opportunities
6.4. Meal Replacement Nutrition Bars Market Trends
Chapter 7. Global Meal Replacement Nutrition Bars Market Outlook Trends
7.1. Global Meal Replacement Nutrition Bars Revenue (USD Million) and CAGR (%) by Type (2021-2032)
7.2. Global Meal Replacement Nutrition Bars Revenue (USD Million) and CAGR (%) by Application (2021-2032)
7.3. Global Meal Replacement Nutrition Bars Revenue (USD Million) and CAGR (%) by Product (2021-2032)
By Type
Nuts
Fruit
Vegetable and Cereal
Others
By Sales Channel
Online
Offline
Chapter 8. Global Meal Replacement Nutrition Bars Regional Analysis and Outlook
8.1. Global Meal Replacement Nutrition Bars Revenue (USD Million) By Regions (2021- 2032)
8.2. North America Meal Replacement Nutrition Bars Revenue (USD Million) by Country (2021-2032)
8.2.1. United States Meal Replacement Nutrition Bars Regional Analysis and Outlook
8.2.2. Canada Meal Replacement Nutrition Bars Regional Analysis and Outlook
8.2.3. Mexico Meal Replacement Nutrition Bars Regional Analysis and Outlook
8.3. Europe Meal Replacement Nutrition Bars Revenue (USD Million), by Country (2021-2032)
8.3.1. Germany Meal Replacement Nutrition Bars Regional Analysis and Outlook
8.3.2. France Meal Replacement Nutrition Bars Regional Analysis and Outlook
8.3.3. United Kingdom Meal Replacement Nutrition Bars Regional Analysis and Outlook
8.3.4. Spain Meal Replacement Nutrition Bars Regional Analysis and Outlook
8.3.5. Italy Meal Replacement Nutrition Bars Regional Analysis and Outlook
8.3.6. Russia Meal Replacement Nutrition Bars Regional Analysis and Outlook
8.3.7. Rest of Europe Meal Replacement Nutrition Bars Regional Analysis and Outlook
8.4. Asia Pacific Meal Replacement Nutrition Bars Revenue (USD Million) by Country (2021-2032)
8.4.1. China Meal Replacement Nutrition Bars Regional Analysis and Outlook
8.4.2. Japan Meal Replacement Nutrition Bars Regional Analysis and Outlook
8.4.3. India Meal Replacement Nutrition Bars Regional Analysis and Outlook
8.4.4. South Korea Meal Replacement Nutrition Bars Regional Analysis and Outlook
8.4.5. Australia Meal Replacement Nutrition Bars Regional Analysis and Outlook
8.4.6. South East Asia Meal Replacement Nutrition Bars Regional Analysis and Outlook
8.4.7. Rest of Asia Pacific Meal Replacement Nutrition Bars Regional Analysis and Outlook
8.5. South America Meal Replacement Nutrition Bars Revenue (USD Million), by Country (2021-2032)
8.5.1. Brazil Meal Replacement Nutrition Bars Regional Analysis and Outlook
8.5.2. Argentina Meal Replacement Nutrition Bars Regional Analysis and Outlook
8.5.3. Rest of South America Meal Replacement Nutrition Bars Regional Analysis and Outlook
8.6. Middle East and Africa Meal Replacement Nutrition Bars Revenue (USD Million) by Country (2021-2032)
8.6.1. Middle East Meal Replacement Nutrition Bars Regional Analysis and Outlook
8.6.2. Africa Meal Replacement Nutrition Bars Regional Analysis and Outlook
Chapter 9. North America Meal Replacement Nutrition Bars Analysis and Outlook
9.1. North America Meal Replacement Nutrition Bars Revenue (USD Million) by Segments (2021-2032)
9.1.1. North America Meal Replacement Nutrition Bars Revenue (USD Million) by Type (2021-2032)
9.1.2. North America Meal Replacement Nutrition Bars Revenue (USD Million) by Application (2021-2032)
9.1.3. North America Meal Replacement Nutrition Bars Revenue (USD Million) by Product (2021-2032)
By Type
Nuts
Fruit
Vegetable and Cereal
Others
By Sales Channel
Online
Offline
Chapter 10. Europe Meal Replacement Nutrition Bars Analysis and Outlook
10.1. Europe Meal Replacement Nutrition Bars Revenue (USD Million), by Segments (USD Million) (2021-2032)
10.1.1. Europe Meal Replacement Nutrition Bars Revenue (USD Million) by Type (2021-2032)
10.1.2. Europe Meal Replacement Nutrition Bars Revenue (USD Million) by Application (2021-2032)
10.1.3. Europe Meal Replacement Nutrition Bars Revenue (USD Million) by Product (2021-2032)
By Type
Nuts
Fruit
Vegetable and Cereal
Others
By Sales Channel
Online
Offline
Chapter 11. Asia Pacific Meal Replacement Nutrition Bars Analysis and Outlook
11.1. Asia Pacific Meal Replacement Nutrition Bars Revenue (USD Million), and Revenue (USD Million) by Segments (2021-2032)
11.1.1. Asia Pacific Meal Replacement Nutrition Bars Revenue (USD Million) by Type (2021-2032)
11.1.2. Asia Pacific Meal Replacement Nutrition Bars Revenue (USD Million) by Application (2021-2032)
11.1.3. Asia Pacific Meal Replacement Nutrition Bars Revenue (USD Million) by Product (2021-2032)
By Type
Nuts
Fruit
Vegetable and Cereal
Others
By Sales Channel
Online
Offline
Chapter 12. South America Meal Replacement Nutrition Bars Analysis and Outlook
12.1. South America Meal Replacement Nutrition Bars Revenue (USD Million), by Segments (2021-2032)
12.1.1. South America Meal Replacement Nutrition Bars Revenue (USD Million) by Type (2021-2032)
12.1.2. South America Meal Replacement Nutrition Bars Revenue (USD Million) by Application (2021-2032)
12.1.3. South America Meal Replacement Nutrition Bars Revenue (USD Million) by Product (2021-2032)
By Type
Nuts
Fruit
Vegetable and Cereal
Others
By Sales Channel
Online
Offline
Chapter 13. Middle East and Africa Meal Replacement Nutrition Bars Analysis and Outlook
13.1. Middle East and Africa Meal Replacement Nutrition Bars Revenue (USD Million), by Segments (2021-2032)
13.1.1. Middle East and Africa Meal Replacement Nutrition Bars Revenue (USD Million) by Type (2021-2032)
13.1.2. Middle East and Africa Meal Replacement Nutrition Bars Revenue (USD Million) by Application (2021-2032)
13.1.3. Middle East and Africa Meal Replacement Nutrition Bars Revenue (USD Million) by Product (2021-2032)
By Type
Nuts
Fruit
Vegetable and Cereal
Others
By Sales Channel
Online
Offline
Chapter 14. Meal Replacement Nutrition Bars Company Profiles
14.1 Business Overview
14.2 Product Profiles
14.3 SWOT Profiles
14.5 Recent Developments
14.6 Financial Profile
List of Companies
Abbott Nutrition
BE-KIND
Clif Bar & Company
DGI
ffit8
Glanbia Plc
GoMacro
GYMMAX
Herbalife
Kellogg Company
LABRADA Nutrition
Lvshou
OPTISLIM
PhD
Quest Nutrition
Rise Bar
Simply Protein
15. Methodology and Data Sources
15.1 Customization Offerings
15.2 Subscription Services
15.3 Related Reports
15.4 Publisher Expertise
LIST OF TABLES
Table 1 Market Segmentation Analysis
Table 2 Global Meal Replacement Nutrition Bars Market Share of Leading Companies, 2023
Table 3 Product Offerings of Leading Companies
Table 4 Low Growth Scenario Forecasts
Table 5 Reference Case Growth Scenario
Table 6 High Growth Case Scenario
Table 7 Global Meal Replacement Nutrition Bars Revenue (USD Million) And CAGR (%) By Type (2021-2032)
Table 8 Global Meal Replacement Nutrition Bars Revenue (USD Million) And CAGR (%) By Application (2021-2032)
Table 9 Global Meal Replacement Nutrition Bars Revenue (USD Million) And CAGR (%) By Product (2021-2032)
Table 10 Global Meal Replacement Nutrition Bars Market Revenue (USD Million) By Regions (2021-2032)
Table 11 Global Meal Replacement Nutrition Bars Market Share (%) By Regions (2021-2032)
Table 12 North America Meal Replacement Nutrition Bars Revenue (USD Million) By Country (2021-2032)
Table 13 Europe Meal Replacement Nutrition Bars Revenue (USD Million) By Country (2021-2032)
Table 14 Asia Pacific Meal Replacement Nutrition Bars Revenue (USD Million) By Country (2021-2032)
Table 15 South America Meal Replacement Nutrition Bars Revenue (USD Million) By Country (2021-2032)
Table 16 Middle East and Africa Meal Replacement Nutrition Bars Revenue (USD Million) By Region (2021-2032)
Table 17 North America Meal Replacement Nutrition Bars Revenue (USD Million) By Type (2021-2032)
Table 18 North America Meal Replacement Nutrition Bars Revenue (USD Million) By Application (2021-2032)
Table 19 North America Meal Replacement Nutrition Bars Revenue (USD Million) By Product (2021-2032)
Table 20 Europe Meal Replacement Nutrition Bars Revenue (USD Million) By Type (2021-2032)
Table 21 Europe Meal Replacement Nutrition Bars Revenue (USD Million) By Application (2021-2032)
Table 22 Europe Meal Replacement Nutrition Bars Revenue (USD Million) By Product (2021-2032)
Table 23 Asia Pacific Meal Replacement Nutrition Bars Revenue (USD Million) By Type (2021-2032)
Table 24 Asia Pacific Meal Replacement Nutrition Bars Revenue (USD Million) By Application (2021-2032)
Table 25 Asia Pacific Meal Replacement Nutrition Bars Revenue (USD Million) By Product (2021-2032)
Table 26 South America Meal Replacement Nutrition Bars Revenue (USD Million) By Type (2021-2032)
Table 27 South America Meal Replacement Nutrition Bars Revenue (USD Million) By Application (2021-2032)
Table 28 South America Meal Replacement Nutrition Bars Revenue (USD Million) By Product (2021-2032)
Table 29 Middle East and Africa Meal Replacement Nutrition Bars Revenue (USD Million) By Type (2021-2032)
Table 30 Middle East and Africa Meal Replacement Nutrition Bars Revenue (USD Million) By Application (2021-2032)
Table 31 Middle East and Africa Meal Replacement Nutrition Bars Revenue (USD Million) By Product (2021-2032)
LIST OF FIGURES
Figure 1. Market Scope
Figure 2. Pricing Forecasts Per Unit, 2023- 2032
Figure 3. Porter’s Five Forces
Figure 4. Global Meal Replacement Nutrition Bars Market Revenue (USD Million) By Regions (2021-2032)
Figure 5. Global Meal Replacement Nutrition Bars Market Share (%) By Regions (2023)
Figure 6. North America Meal Replacement Nutrition Bars Revenue (USD Million) By Country (2021-2032)
Figure 7. United States Meal Replacement Nutrition Bars Revenue (USD Million) By Country (2021-2032)
Figure 8. Canada Meal Replacement Nutrition Bars Revenue (USD Million) By Country (2021-2032)
Figure 9. Mexico Meal Replacement Nutrition Bars Revenue (USD Million) By Country (2021-2032)
Figure 10. Europe Meal Replacement Nutrition Bars Revenue (USD Million) By Country (2021-2032)
Figure 11. Germany Meal Replacement Nutrition Bars Revenue (USD Million) By Country (2021-2032)
Figure 12. France Meal Replacement Nutrition Bars Revenue (USD Million) By Country (2021-2032)
Figure 13. United Kingdom Meal Replacement Nutrition Bars Revenue (USD Million) By Country (2021-2032)
Figure 14. Spain Meal Replacement Nutrition Bars Revenue (USD Million) By Country (2021-2032)
Figure 15. Italy Meal Replacement Nutrition Bars Revenue (USD Million) By Country (2021-2032)
Figure 16. Russia Meal Replacement Nutrition Bars Revenue (USD Million) By Country (2021-2032)
Figure 17. Rest of Europe Meal Replacement Nutrition Bars Revenue (USD Million) By Country (2021-2032)
Figure 11. Asia Pacific Meal Replacement Nutrition Bars Revenue (USD Million) By Country (2021-2032)
Figure 12. China Meal Replacement Nutrition Bars Revenue (USD Million) By Country (2021-2032)
Figure 13. Japan Meal Replacement Nutrition Bars Revenue (USD Million) By Country (2021-2032)
Figure 14. India Meal Replacement Nutrition Bars Revenue (USD Million) By Country (2021-2032)
Figure 15. South Korea Meal Replacement Nutrition Bars Revenue (USD Million) By Country (2021-2032)
Figure 16. Australia Meal Replacement Nutrition Bars Revenue (USD Million) By Country (2021-2032)
Figure 17. South East Asia Meal Replacement Nutrition Bars Revenue (USD Million) By Country (2021-2032)
Figure 18. South America Meal Replacement Nutrition Bars Revenue (USD Million) By Country (2021-2032)
Figure 19. Brazil Meal Replacement Nutrition Bars Revenue (USD Million) By Country (2021-2032)
Figure 20. Argentina Meal Replacement Nutrition Bars Revenue (USD Million) By Country (2021-2032)
Figure 21. Rest of Asia Pacific Meal Replacement Nutrition Bars Revenue (USD Million) By Country (2021-2032)
Figure 22. Middle East and Africa Meal Replacement Nutrition Bars Revenue (USD Million) By Region (2021-2032)
Figure 23. Saudi Arabia Meal Replacement Nutrition Bars Revenue (USD Million) By Region (2021-2032)
Figure 24. The UAE Meal Replacement Nutrition Bars Revenue (USD Million) By Region (2021-2032)
Figure 25. Rest of Middle East Meal Replacement Nutrition Bars Revenue (USD Million) By Region (2021-2032)
Figure 26. South Africa Meal Replacement Nutrition Bars Revenue (USD Million) By Region (2021-2032)
Figure 27. Africa Meal Replacement Nutrition Bars Revenue (USD Million) By Region (2021-2032)
Figure 28. North America Meal Replacement Nutrition Bars Revenue (USD Million) By Type (2021-2032)
Figure 29. North America Meal Replacement Nutrition Bars Revenue (USD Million) By Application (2021-2032)
Figure 30. North America Meal Replacement Nutrition Bars Revenue (USD Million) By Product (2021-2032)
Figure 31. Europe Meal Replacement Nutrition Bars Revenue (USD Million) By Type (2021-2032)
Figure 32. Europe Meal Replacement Nutrition Bars Revenue (USD Million) By Application (2021-2032)
Figure 33. Europe Meal Replacement Nutrition Bars Revenue (USD Million) By Product (2021-2032)
Figure 34. Asia Pacific Meal Replacement Nutrition Bars Revenue (USD Million) By Type (2021-2032)
Figure 35. Asia Pacific Meal Replacement Nutrition Bars Revenue (USD Million) By Application (2021-2032)
Figure 36. Asia Pacific Meal Replacement Nutrition Bars Revenue (USD Million) By Product (2021-2032)
Figure 37. South America Meal Replacement Nutrition Bars Revenue (USD Million) By Type (2021-2032)
Figure 38. South America Meal Replacement Nutrition Bars Revenue (USD Million) By Application (2021-2032)
Figure 39. South America Meal Replacement Nutrition Bars Revenue (USD Million) By Product (2021-2032)
Figure 40. Middle East and Africa Meal Replacement Nutrition Bars Revenue (USD Million) By Type (2021-2032)
Figure 41. Middle East and Africa Meal Replacement Nutrition Bars Revenue (USD Million) By Application (2021-2032)
Figure 42. Middle East and Africa Meal Replacement Nutrition Bars Revenue (USD Million) By Product (2021-2032)
By Type
Nuts
Fruit
Vegetable and Cereal
Others
By Sales Channel
Online
Offline
Countries Analyzed
North America (US, Canada, Mexico)
Europe (Germany, UK, France, Spain, Italy, Russia, Rest of Europe)
Asia Pacific (China, India, Japan, South Korea, Australia, South East Asia, Rest of Asia)
South America (Brazil, Argentina, Rest of South America)
Middle East and Africa (Saudi Arabia, UAE, Rest of Middle East, South Africa, Egypt, Rest of Africa)
