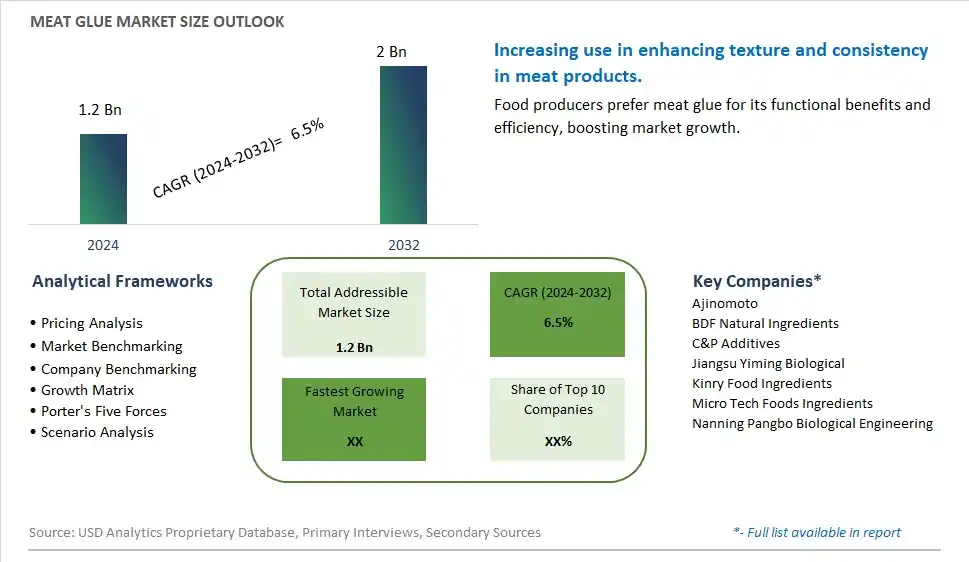
Global Meat Glue Market Size is valued at $1.2 Billion in 2024 and is forecast to register a growth rate (CAGR) of 6.5% to reach $2 Billion by 2032.
The global Meat Glue Market Comprehensive Study analyzes and forecasts the market size across 6 regions and 24 countries for diverse segments -By Type (Animal, Plant, Microbial), By Application (Meat, Fish, Processed food)
An Introduction to Meat Glue Market
In 2024, the meat glue market is thriving, driven by the demand for efficient and versatile binding agents in the meat processing industry. Meat glue, also known as transglutaminase, is used to bind meat pieces together, improve texture, and enhance product appearance. The market benefits from advancements in enzyme technology and formulation, ensuring high efficacy and safety. The trend towards clean label and natural ingredients is influencing product development. Increasing consumer demand for value-added meat products and the popularity of innovative culinary techniques are further supporting market growth.
Meat Glue Competitive Landscape
The market report analyses the leading companies in the industry including Ajinomoto, BDF Natural Ingredients, C&P Additives, Jiangsu Yiming Biological, Kinry Food Ingredients, Micro Tech Foods Ingredients, Nanning Pangbo Biological Engineering, and Others.
Meat Glue Market Dynamics
Meat Glue Market Trend: Increasing Use of Meat Glue in Food Processing
The most prominent trend in the Meat Glue Market is the increasing use of meat glue (transglutaminase) in food processing. Meat glue is used to bind pieces of meat together, improve texture, and create uniform products, making it a popular ingredient in the meat and food processing industries. This trend is driven by the demand for high-quality and consistent meat products.
Meat Glue Market Driver: Growth of the Meat Processing Industry
A key driver in the Meat Glue Market is the growth of the meat processing industry. As the demand for processed meat products, such as sausages, nuggets, and deli meats, continues to rise, there is an increasing need for ingredients that enhance product quality and efficiency. Meat glue, which offers functional benefits in meat processing, caters to this demand and supports market growth.
Meat Glue Market Opportunity: Development of Clean Label and Natural Alternatives
One significant opportunity in the Meat Glue Market lies in the development of clean label and natural alternatives. Companies can innovate by creating meat glue products that use natural ingredients and meet clean label standards, catering to the growing consumer preference for transparency and natural formulations. By offering high-quality and natural meat glue options, manufacturers can attract health-conscious consumers and drive market growth.
Meat Glue Market Share Analysis: Animal segment generated the highest revenue share in the industry
Animal-based meat glue emerges as the largest segment within the Meat Glue Market. This type of meat glue, also known as transglutaminase, is derived from animal sources such as blood plasma or tissues. It is widely used in food processing to bind proteins together, enhance texture, and improve the appearance of meat products. Animal-derived transglutaminase is valued for its strong bonding capabilities, which contribute to the production of uniform and appealing meat cuts, including steaks, fillets, and deli meats. Its applications extend across various segments of the food industry, from large-scale meat processing plants to gourmet kitchens, where it aids in creating innovative culinary presentations and optimizing meat utilization.
Meat Glue Market Share Analysis: Processed Food is the fastest growing segment over the forecast period to 2032
The processed food segment is expected to be the fastest growing in the Meat Glue Market by 2032. This growth is driven by increasing consumer demand for convenience foods, ready-to-eat meals, and processed meat products that offer enhanced texture, appearance, and mouthfeel. Meat glue, particularly transglutaminase, plays a crucial role in the processed food industry by binding meat and seafood proteins together to create uniform shapes, textures, and structures. Processed food manufacturers utilize meat glue to develop value-added products such as formed meat patties, nuggets, and surimi-based seafood analogs. The versatility of meat glue in enhancing product consistency and sensory attributes appeals to food manufacturers seeking to meet consumer expectations for quality, convenience, and appealing food experiences in a competitive market landscape.
Meat Glue Market Segmentation
By Type
Animal
Plant
Microbial
By Application
Meat
Fish
Processed food
Countries Analyzed
North America (US, Canada, Mexico)
Europe (Germany, UK, France, Spain, Italy, Russia, Rest of Europe)
Asia Pacific (China, India, Japan, South Korea, Australia, South East Asia, Rest of Asia)
South America (Brazil, Argentina, Rest of South America)
Middle East and Africa (Saudi Arabia, UAE, Rest of Middle East, South Africa, Egypt, Rest of Africa)
Meat Glue Companies Profiled in the Study
Ajinomoto
BDF Natural Ingredients
C&P Additives
Jiangsu Yiming Biological
Kinry Food Ingredients
Micro Tech Foods Ingredients
Nanning Pangbo Biological Engineering
*- List Not Exhaustive
Chapter 1. TABLE OF CONTENTS
Chapter 2. Introduction to Meat Glue Market
2.1. Market Overview
2.2. Key Statistics and Report Highlights
2.3. Scope of the Comprehensive Study
2.3.1. Market Definition
2.3.2 Countries and Regions Covered
2.3.3 Research Objective
2.3.4 Units, Currency, and Conversions
2.3.5 Industry Value Chain
2.4. Key Market Segments
2.5. Key Companies
2.6. Study Period
Chapter 3. Strategic Analysis Review
3.1. Meat Glue Pricing Analysis and Forecast
3.2. Porter’s Five Forces
3.3. Market Ecosystem
3.4. SWOT Analysis
3.5. Regulatory Scenario
3.3. Effects of Inflation, Russia-Ukraine War, moderating economic growth, and other macroeconomic factors
Chapter 4. Competitive Landscape
4.1. Market Share Analysis
4.1.1. Global Meat Glue Market Share by Company, 2023
4.1.2. Product Offerings of Leading Meat Glue Companies
4.2. Market Entropy
4.2.1. New Product Launches in the Industry
4.2.2. Mergers, Acquisitions, Joint ventures, and Partnerships
4.3. Key Strategies and Best Practices
Chapter 5. Global Market Projections: Best, Reference, and Low Case Scenarios
5.1. Growth Analysis- Case Scenario Definitions
5.2. Low Growth Case Scenario Forecasts
5.3. Reference Growth Case Scenario Forecasts
5.4. High Growth Case Scenario Forecasts
Chapter 6. Market Dynamics
6.1. Meat Glue Market Drivers
6.2. Meat Glue Market Challenges
6.6. Meat Glue Market Opportunities
6.4. Meat Glue Market Trends
Chapter 7. Global Meat Glue Market Outlook Trends
7.1. Global Meat Glue Revenue (USD Million) and CAGR (%) by Type (2021-2032)
7.2. Global Meat Glue Revenue (USD Million) and CAGR (%) by Application (2021-2032)
7.3. Global Meat Glue Revenue (USD Million) and CAGR (%) by Product (2021-2032)
By Type
Animal
Plant
Microbial
By Application
Meat
Fish
Processed food
Chapter 8. Global Meat Glue Regional Analysis and Outlook
8.1. Global Meat Glue Revenue (USD Million) By Regions (2021- 2032)
8.2. North America Meat Glue Revenue (USD Million) by Country (2021-2032)
8.2.1. United States Meat Glue Regional Analysis and Outlook
8.2.2. Canada Meat Glue Regional Analysis and Outlook
8.2.3. Mexico Meat Glue Regional Analysis and Outlook
8.3. Europe Meat Glue Revenue (USD Million), by Country (2021-2032)
8.3.1. Germany Meat Glue Regional Analysis and Outlook
8.3.2. France Meat Glue Regional Analysis and Outlook
8.3.3. United Kingdom Meat Glue Regional Analysis and Outlook
8.3.4. Spain Meat Glue Regional Analysis and Outlook
8.3.5. Italy Meat Glue Regional Analysis and Outlook
8.3.6. Russia Meat Glue Regional Analysis and Outlook
8.3.7. Rest of Europe Meat Glue Regional Analysis and Outlook
8.4. Asia Pacific Meat Glue Revenue (USD Million) by Country (2021-2032)
8.4.1. China Meat Glue Regional Analysis and Outlook
8.4.2. Japan Meat Glue Regional Analysis and Outlook
8.4.3. India Meat Glue Regional Analysis and Outlook
8.4.4. South Korea Meat Glue Regional Analysis and Outlook
8.4.5. Australia Meat Glue Regional Analysis and Outlook
8.4.6. South East Asia Meat Glue Regional Analysis and Outlook
8.4.7. Rest of Asia Pacific Meat Glue Regional Analysis and Outlook
8.5. South America Meat Glue Revenue (USD Million), by Country (2021-2032)
8.5.1. Brazil Meat Glue Regional Analysis and Outlook
8.5.2. Argentina Meat Glue Regional Analysis and Outlook
8.5.3. Rest of South America Meat Glue Regional Analysis and Outlook
8.6. Middle East and Africa Meat Glue Revenue (USD Million) by Country (2021-2032)
8.6.1. Middle East Meat Glue Regional Analysis and Outlook
8.6.2. Africa Meat Glue Regional Analysis and Outlook
Chapter 9. North America Meat Glue Analysis and Outlook
9.1. North America Meat Glue Revenue (USD Million) by Segments (2021-2032)
9.1.1. North America Meat Glue Revenue (USD Million) by Type (2021-2032)
9.1.2. North America Meat Glue Revenue (USD Million) by Application (2021-2032)
9.1.3. North America Meat Glue Revenue (USD Million) by Product (2021-2032)
By Type
Animal
Plant
Microbial
By Application
Meat
Fish
Processed food
Chapter 10. Europe Meat Glue Analysis and Outlook
10.1. Europe Meat Glue Revenue (USD Million), by Segments (USD Million) (2021-2032)
10.1.1. Europe Meat Glue Revenue (USD Million) by Type (2021-2032)
10.1.2. Europe Meat Glue Revenue (USD Million) by Application (2021-2032)
10.1.3. Europe Meat Glue Revenue (USD Million) by Product (2021-2032)
By Type
Animal
Plant
Microbial
By Application
Meat
Fish
Processed food
Chapter 11. Asia Pacific Meat Glue Analysis and Outlook
11.1. Asia Pacific Meat Glue Revenue (USD Million), and Revenue (USD Million) by Segments (2021-2032)
11.1.1. Asia Pacific Meat Glue Revenue (USD Million) by Type (2021-2032)
11.1.2. Asia Pacific Meat Glue Revenue (USD Million) by Application (2021-2032)
11.1.3. Asia Pacific Meat Glue Revenue (USD Million) by Product (2021-2032)
By Type
Animal
Plant
Microbial
By Application
Meat
Fish
Processed food
Chapter 12. South America Meat Glue Analysis and Outlook
12.1. South America Meat Glue Revenue (USD Million), by Segments (2021-2032)
12.1.1. South America Meat Glue Revenue (USD Million) by Type (2021-2032)
12.1.2. South America Meat Glue Revenue (USD Million) by Application (2021-2032)
12.1.3. South America Meat Glue Revenue (USD Million) by Product (2021-2032)
By Type
Animal
Plant
Microbial
By Application
Meat
Fish
Processed food
Chapter 13. Middle East and Africa Meat Glue Analysis and Outlook
13.1. Middle East and Africa Meat Glue Revenue (USD Million), by Segments (2021-2032)
13.1.1. Middle East and Africa Meat Glue Revenue (USD Million) by Type (2021-2032)
13.1.2. Middle East and Africa Meat Glue Revenue (USD Million) by Application (2021-2032)
13.1.3. Middle East and Africa Meat Glue Revenue (USD Million) by Product (2021-2032)
By Type
Animal
Plant
Microbial
By Application
Meat
Fish
Processed food
Chapter 14. Meat Glue Company Profiles
14.1 Business Overview
14.2 Product Profiles
14.3 SWOT Profiles
14.5 Recent Developments
14.6 Financial Profile
List of Companies
Ajinomoto
BDF Natural Ingredients
C&P Additives
Jiangsu Yiming Biological
Kinry Food Ingredients
Micro Tech Foods Ingredients
Nanning Pangbo Biological Engineering
15. Methodology and Data Sources
15.1 Customization Offerings
15.2 Subscription Services
15.3 Related Reports
15.4 Publisher Expertise
LIST OF TABLES
Table 1 Market Segmentation Analysis
Table 2 Global Meat Glue Market Share of Leading Companies, 2023
Table 3 Product Offerings of Leading Companies
Table 4 Low Growth Scenario Forecasts
Table 5 Reference Case Growth Scenario
Table 6 High Growth Case Scenario
Table 7 Global Meat Glue Revenue (USD Million) And CAGR (%) By Type (2021-2032)
Table 8 Global Meat Glue Revenue (USD Million) And CAGR (%) By Application (2021-2032)
Table 9 Global Meat Glue Revenue (USD Million) And CAGR (%) By Product (2021-2032)
Table 10 Global Meat Glue Market Revenue (USD Million) By Regions (2021-2032)
Table 11 Global Meat Glue Market Share (%) By Regions (2021-2032)
Table 12 North America Meat Glue Revenue (USD Million) By Country (2021-2032)
Table 13 Europe Meat Glue Revenue (USD Million) By Country (2021-2032)
Table 14 Asia Pacific Meat Glue Revenue (USD Million) By Country (2021-2032)
Table 15 South America Meat Glue Revenue (USD Million) By Country (2021-2032)
Table 16 Middle East and Africa Meat Glue Revenue (USD Million) By Region (2021-2032)
Table 17 North America Meat Glue Revenue (USD Million) By Type (2021-2032)
Table 18 North America Meat Glue Revenue (USD Million) By Application (2021-2032)
Table 19 North America Meat Glue Revenue (USD Million) By Product (2021-2032)
Table 20 Europe Meat Glue Revenue (USD Million) By Type (2021-2032)
Table 21 Europe Meat Glue Revenue (USD Million) By Application (2021-2032)
Table 22 Europe Meat Glue Revenue (USD Million) By Product (2021-2032)
Table 23 Asia Pacific Meat Glue Revenue (USD Million) By Type (2021-2032)
Table 24 Asia Pacific Meat Glue Revenue (USD Million) By Application (2021-2032)
Table 25 Asia Pacific Meat Glue Revenue (USD Million) By Product (2021-2032)
Table 26 South America Meat Glue Revenue (USD Million) By Type (2021-2032)
Table 27 South America Meat Glue Revenue (USD Million) By Application (2021-2032)
Table 28 South America Meat Glue Revenue (USD Million) By Product (2021-2032)
Table 29 Middle East and Africa Meat Glue Revenue (USD Million) By Type (2021-2032)
Table 30 Middle East and Africa Meat Glue Revenue (USD Million) By Application (2021-2032)
Table 31 Middle East and Africa Meat Glue Revenue (USD Million) By Product (2021-2032)
LIST OF FIGURES
Figure 1. Market Scope
Figure 2. Pricing Forecasts Per Unit, 2023- 2032
Figure 3. Porter’s Five Forces
Figure 4. Global Meat Glue Market Revenue (USD Million) By Regions (2021-2032)
Figure 5. Global Meat Glue Market Share (%) By Regions (2023)
Figure 6. North America Meat Glue Revenue (USD Million) By Country (2021-2032)
Figure 7. United States Meat Glue Revenue (USD Million) By Country (2021-2032)
Figure 8. Canada Meat Glue Revenue (USD Million) By Country (2021-2032)
Figure 9. Mexico Meat Glue Revenue (USD Million) By Country (2021-2032)
Figure 10. Europe Meat Glue Revenue (USD Million) By Country (2021-2032)
Figure 11. Germany Meat Glue Revenue (USD Million) By Country (2021-2032)
Figure 12. France Meat Glue Revenue (USD Million) By Country (2021-2032)
Figure 13. United Kingdom Meat Glue Revenue (USD Million) By Country (2021-2032)
Figure 14. Spain Meat Glue Revenue (USD Million) By Country (2021-2032)
Figure 15. Italy Meat Glue Revenue (USD Million) By Country (2021-2032)
Figure 16. Russia Meat Glue Revenue (USD Million) By Country (2021-2032)
Figure 17. Rest of Europe Meat Glue Revenue (USD Million) By Country (2021-2032)
Figure 11. Asia Pacific Meat Glue Revenue (USD Million) By Country (2021-2032)
Figure 12. China Meat Glue Revenue (USD Million) By Country (2021-2032)
Figure 13. Japan Meat Glue Revenue (USD Million) By Country (2021-2032)
Figure 14. India Meat Glue Revenue (USD Million) By Country (2021-2032)
Figure 15. South Korea Meat Glue Revenue (USD Million) By Country (2021-2032)
Figure 16. Australia Meat Glue Revenue (USD Million) By Country (2021-2032)
Figure 17. South East Asia Meat Glue Revenue (USD Million) By Country (2021-2032)
Figure 18. South America Meat Glue Revenue (USD Million) By Country (2021-2032)
Figure 19. Brazil Meat Glue Revenue (USD Million) By Country (2021-2032)
Figure 20. Argentina Meat Glue Revenue (USD Million) By Country (2021-2032)
Figure 21. Rest of Asia Pacific Meat Glue Revenue (USD Million) By Country (2021-2032)
Figure 22. Middle East and Africa Meat Glue Revenue (USD Million) By Region (2021-2032)
Figure 23. Saudi Arabia Meat Glue Revenue (USD Million) By Region (2021-2032)
Figure 24. The UAE Meat Glue Revenue (USD Million) By Region (2021-2032)
Figure 25. Rest of Middle East Meat Glue Revenue (USD Million) By Region (2021-2032)
Figure 26. South Africa Meat Glue Revenue (USD Million) By Region (2021-2032)
Figure 27. Africa Meat Glue Revenue (USD Million) By Region (2021-2032)
Figure 28. North America Meat Glue Revenue (USD Million) By Type (2021-2032)
Figure 29. North America Meat Glue Revenue (USD Million) By Application (2021-2032)
Figure 30. North America Meat Glue Revenue (USD Million) By Product (2021-2032)
Figure 31. Europe Meat Glue Revenue (USD Million) By Type (2021-2032)
Figure 32. Europe Meat Glue Revenue (USD Million) By Application (2021-2032)
Figure 33. Europe Meat Glue Revenue (USD Million) By Product (2021-2032)
Figure 34. Asia Pacific Meat Glue Revenue (USD Million) By Type (2021-2032)
Figure 35. Asia Pacific Meat Glue Revenue (USD Million) By Application (2021-2032)
Figure 36. Asia Pacific Meat Glue Revenue (USD Million) By Product (2021-2032)
Figure 37. South America Meat Glue Revenue (USD Million) By Type (2021-2032)
Figure 38. South America Meat Glue Revenue (USD Million) By Application (2021-2032)
Figure 39. South America Meat Glue Revenue (USD Million) By Product (2021-2032)
Figure 40. Middle East and Africa Meat Glue Revenue (USD Million) By Type (2021-2032)
Figure 41. Middle East and Africa Meat Glue Revenue (USD Million) By Application (2021-2032)
Figure 42. Middle East and Africa Meat Glue Revenue (USD Million) By Product (2021-2032)
By Type
Animal
Plant
Microbial
By Application
Meat
Fish
Processed food
Countries Analyzed
North America (US, Canada, Mexico)
Europe (Germany, UK, France, Spain, Italy, Russia, Rest of Europe)
Asia Pacific (China, India, Japan, South Korea, Australia, South East Asia, Rest of Asia)
South America (Brazil, Argentina, Rest of South America)
Middle East and Africa (Saudi Arabia, UAE, Rest of Middle East, South Africa, Egypt, Rest of Africa)
