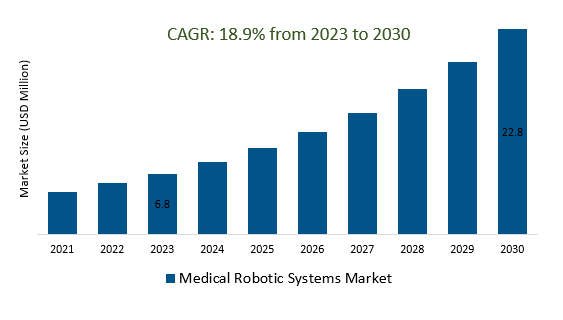
The global Medical Robotic Systems Market Size is estimated to be US$ 6.8 Billion in 2023 and is poised to register 18.9% growth over the forecast period from 2023 to 2030 to reach US $ 22.8 billion in 2030.
The market growth is driven predominantly by the increasing availability of high-speed internet and improved communication technologies allowed for telemedicine and remote surgery applications. Surgeons could operate on patients located in different geographical locations using robotic systems. Leading Companies are focusing on Increased Surgical Specialties, AI-driven automation, Global Reach through Telemedicine, Hybrid Operating Rooms, Patient-Specific Implants and Prosthetics, and others to boost market shares in the industry.
Market Overview
The medical robotic systems market encompasses surgical, rehabilitation, diagnostic, and telemedicine robots aimed at improving medical interventions. Key players include Intuitive Surgical, Stryker, and Medtronic. Despite challenges like costs and training, the field is expected to grow as technology advances, integrating AI and machine learning for more accurate and less invasive procedures, with collaborations between robotics companies, medical institutions, and regulators driving safe and effective healthcare applications.
Market Trends- Companies are launching Telemedicine and Remote Surgery to attract a consumer base
The medical robotic systems market includes telemedicine and remote surgery solutions, enabling remote medical consultations and surgical procedures. Telemedicine robots facilitate virtual healthcare interactions, benefiting underserved areas, while remote surgery systems allow surgeons to perform procedures from a distance using robotic assistance. These technologies offer increased access to healthcare and precision in surgery, although challenges like connectivity and regulatory considerations must be addressed for wider adoption. The market is poised to expand as advancements continue, bridging geographical gaps and transforming the landscape of medical care.
Data analytics and AI integration are pivotal aspects of the medical robotic systems market, driving enhanced efficiency and precision. These technologies enable real-time monitoring, predictive insights, and personalized treatment plans. By analyzing vast amounts of patient and procedural data, AI can optimize surgical techniques, improve diagnosis accuracy, and streamline workflow. Moreover, AI-driven automation can aid in decision-making during surgery and facilitate robotic-assisted procedures. Challenges include data security and ethical considerations, but the synergy of data analytics and AI in medical robotics holds substantial potential for advancing patient care, reducing complications, and shaping the future of healthcare.
The healthcare infrastructure is vital for the medical robotic systems market, necessitating upgraded facilities, proper training, secure data networks, and regulatory frameworks. With improved infrastructure, robotic technologies can effectively contribute to accurate diagnoses, minimally invasive procedures, and telemedicine, enhancing patient outcomes and healthcare accessibility.
The global Medical Robotic Systems Market is analyzed across Surgical Robotic Systems, Rehabilitative Robotic Systems, and others. Of these, Surgical Robotic Systems is poised to register the fastest growth. Surgical robotic systems represent a significant segment within the medical robotic systems market, offering precise and minimally invasive surgical interventions. Led by companies like Intuitive Surgical and Stryker, these systems assist surgeons in complex procedures through smaller incisions, leading to quicker recovery times and improved patient outcomes. Challenges such as costs and training are being addressed as technology advances, making surgical robotic systems a promising avenue for transforming surgical practices and enhancing patient care.
The global Medical Robotic Systems Market is analyzed across a wide range of end user including Hospitals, Ambulatory Surgery Centers, Rehabilitation Centers, and others. Of these, hospitals held a significant market share in 2023. Hospitals are pivotal in the medical robotic systems market, providing the essential infrastructure and training for deploying advanced technologies. Equipped with specialized facilities and staff training, hospitals enhance surgical precision, diagnostics, and patient care, driving growth and transformation in the medical field.
By Type
• Surgical Robotic Systems
• Rehabilitative Robotic Systems
• Non-invasive Radiosurgery Robots
• Hospital and Pharmacy Robotic Systems
• Others
By End-User
• Hospitals
• Ambulatory Surgery Centers
• Rehabilitation Centers
• Others
By Region
• North America (United States, Canada, Mexico)
• Europe (Germany, France, United Kingdom, Spain, Italy, Others)
• Asia Pacific (China, India, Japan, South Korea, Australia, Others)
• Latin America (Brazil, Argentina, Others)
• Middle East and Africa (Saudi Arabia, UAE, Kuwait, Other Middle East, South Africa, Nigeria, Other Africa)
Medical Robotic Systems Market companies
• Accuray Inc
• iRobot Corporation
• Health Robotics SLR
• Medrobotics Corporation
• Renishaw Plc
• OR Productivity plc
• Intuitive Surgical
• Titan Medical Inc.
• Mako Surgical Corp.
• Varian Medical Systems
• Smith & Nephew
• Stereotaxis Inc.
• Medtronic
• Stryker
• Zimmer Biomet
• Mazor Robotics
* List not exhaustive
Medical Robotic Systems Market Outlook 2023
1 Market Overview
1.1 Introduction to the Medical Robotic Systems Market
1.2 Scope of the Study
1.3 Research Objective
1.3.1 Key Market Scope and Segments
1.3.2 Players Covered
1.3.3 Years Considered
2 Executive Summary
2.1 2023 Medical Robotic Systems Industry- Market Statistics
3 Market Dynamics
3.1 Market Drivers
3.2 Market Challenges
3.3 Market Opportunities
3.4 Market Trends
4 Market Factor Analysis
4.1 Porter’s Five Forces
4.2 Market Entropy
4.2.1 Global Medical Robotic Systems Market Companies with Area Served
4.2.2 Products Offerings Global Medical Robotic Systems Market
5 COVID-19 Impact Analysis and Outlook Scenarios
5.1.1 Covid-19 Impact Analysis
5.1.2 Post-COVID-19 Scenario- Low Growth Case
5.1.3 Post-COVID-19 Scenario- Reference Growth Case
5.1.4 Post-COVID-19 Scenario- Low Growth Case
6 Global Medical Robotic Systems Market Trends
6.1 Global Medical Robotic Systems Revenue (USD Million) and CAGR (%) by Type (2018-2030)
6.2 Global Medical Robotic Systems Revenue (USD Million) and CAGR (%) by Applications (2018-2030)
6.3 Global Medical Robotic Systems Revenue (USD Million) and CAGR (%) by Regions (2018-2030)
7 Global Medical Robotic Systems Market Revenue (USD Million) by Type, and Applications (2018-2022)
7.1 Global Medical Robotic Systems Revenue (USD Million) by Type (2018-2022)
7.1.1 Global Medical Robotic Systems Revenue (USD Million), Market Share (%) by Type (2018-2022)
7.2 Global Medical Robotic Systems Revenue (USD Million) by Applications (2018-2022)
7.2.1 Global Medical Robotic Systems Revenue (USD Million), Market Share (%) by Applications (2018-2022)
8 Global Medical Robotic Systems Development Regional Status and Outlook
8.1 Global Medical Robotic Systems Revenue (USD Million) By Regions (2018-2022)
8.2 North America Medical Robotic Systems Revenue (USD Million) by Type, and Application (2018-2022)
8.2.1 North America Medical Robotic Systems Revenue (USD Million) by Country (2018-2022)
8.2.2 North America Medical Robotic Systems Revenue (USD Million) by Type (2018-2022)
8.2.3 North America Medical Robotic Systems Revenue (USD Million) by Applications (2018-2022)
8.3 Europe Medical Robotic Systems Revenue (USD Million), by Type, and Applications (USD Million) (2018-2022)
8.3.1 Europe Medical Robotic Systems Revenue (USD Million), by Country (2018-2022)
8.3.2 Europe Medical Robotic Systems Revenue (USD Million) by Type (2018-2022)
8.3.3 Europe Medical Robotic Systems Revenue (USD Million) by Applications (2018-2022)
8.4 Asia Pacific Medical Robotic Systems Revenue (USD Million), and Revenue (USD Million) by Type, and Applications (2018-2022)
8.4.1 Asia Pacific Medical Robotic Systems Revenue (USD Million) by Country (2018-2022)
8.4.2 Asia Pacific Medical Robotic Systems Revenue (USD Million) by Type (2018-2022)
8.4.3 Asia Pacific Medical Robotic Systems Revenue (USD Million) by Applications (2018-2022)
8.5 South America Medical Robotic Systems Revenue (USD Million), by Type, and Applications (2018-2022)
8.5.1 South America Medical Robotic Systems Revenue (USD Million), by Country (2018-2022)
8.5.2 South America Medical Robotic Systems Revenue (USD Million) by Type (2018-2022)
8.5.3 South America Medical Robotic Systems Revenue (USD Million) by Applications (2018-2022)
8.6 Middle East and Africa Medical Robotic Systems Revenue (USD Million), by Type, Technology, Application, Thickness (2018-2022)
8.6.1 Middle East and Africa Medical Robotic Systems Revenue (USD Million) by Country (2018-2022)
8.6.2 Middle East and Africa Medical Robotic Systems Revenue (USD Million) by Type (2018-2022)
8.6.3 Middle East and Africa Medical Robotic Systems Revenue (USD Million) by Applications (2018-2022)
9 Company Profiles
10 Global Medical Robotic Systems Market Revenue (USD Million), by Type, and Applications (2023-2030)
10.1 Global Medical Robotic Systems Revenue (USD Million) and Market Share (%) by Type (2023-2030)
10.1.1 Global Medical Robotic Systems Revenue (USD Million), and Market Share (%) by Type (2023-2030)
10.2 Global Medical Robotic Systems Revenue (USD Million) and Market Share (%) by Applications (2023-2030)
10.2.1 Global Medical Robotic Systems Revenue (USD Million), and Market Share (%) by Applications (2023-2030)
11 Global Medical Robotic Systems Development Regional Status and Outlook Forecast
11.1 Global Medical Robotic Systems Revenue (USD Million) By Regions (2023-2030)
11.2 North America Medical Robotic Systems Revenue (USD Million) by Type, and Applications (2023-2030)
11.2.1 North America Medical Robotic Systems Revenue (USD) Million by Country (2023-2030)
11.2.2 North America Medical Robotic Systems Revenue (USD Million), by Type (2023-2030)
11.2.3 North America Medical Robotic Systems Revenue (USD Million), Market Share (%) by Applications (2023-2030)
11.3 Europe Medical Robotic Systems Revenue (USD Million), by Type, and Applications (2023-2030)
11.3.1 Europe Medical Robotic Systems Revenue (USD Million), by Country (2023-2030)
11.3.2 Europe Medical Robotic Systems Revenue (USD Million), by Type (2023-2030)
11.3.3 Europe Medical Robotic Systems Revenue (USD Million), by Applications (2023-2030)
11.4 Asia Pacific Medical Robotic Systems Revenue (USD Million) by Type, and Applications (2023-2030)
11.4.1 Asia Pacific Medical Robotic Systems Revenue (USD Million), by Country (2023-2030)
11.4.2 Asia Pacific Medical Robotic Systems Revenue (USD Million), by Type (2023-2030)
11.4.3 Asia Pacific Medical Robotic Systems Revenue (USD Million), by Applications (2023-2030)
11.5 South America Medical Robotic Systems Revenue (USD Million), by Type, and Applications (2023-2030)
11.5.1 South America Medical Robotic Systems Revenue (USD Million), by Country (2023-2030)
11.5.2 South America Medical Robotic Systems Revenue (USD Million), by Type (2023-2030)
11.5.3 South America Medical Robotic Systems Revenue (USD Million), by Applications (2023-2030)
11.6 Middle East and Africa Medical Robotic Systems Revenue (USD Million), by Type, and Applications (2023-2030)
11.6.1 Middle East and Africa Medical Robotic Systems Revenue (USD Million), by Region (2023-2030)
11.6.2 Middle East and Africa Medical Robotic Systems Revenue (USD Million), by Type (2023-2030)
11.6.3 Middle East and Africa Medical Robotic Systems Revenue (USD Million), by Applications (2023-2030)
12 Methodology and Data Sources
12.1 Methodology/Research Approach
12.1.1 Research Programs/Design
12.1.2 Market Size Estimation
12.1.3 Market Breakdown and Data Triangulation
12.2 Data Sources
12.2.1 Secondary Sources
12.2.2 Primary Sources
12.3 Disclaimer
List of Tables
Table 1 Market Segmentation Analysis
Table 2 Global Medical Robotic Systems Market Companies with Areas Served
Table 3 Products Offerings Global Medical Robotic Systems Market
Table 4 Low Growth Scenario Forecasts
Table 5 Reference Case Growth Scenario
Table 6 High Growth Case Scenario
Table 7 Global Medical Robotic Systems Revenue (USD Million) And CAGR (%) By Type (2018-2030)
Table 8 Global Medical Robotic Systems Revenue (USD Million) And CAGR (%) By Applications (2018-2030)
Table 9 Global Medical Robotic Systems Revenue (USD Million) And CAGR (%) By Regions (2018-2030)
Table 10 Global Medical Robotic Systems Revenue (USD Million) By Type (2018-2022)
Table 11 Global Medical Robotic Systems Revenue Market Share (%) By Type (2018-2022)
Table 12 Global Medical Robotic Systems Revenue (USD Million) By Applications (2018-2022)
Table 13 Global Medical Robotic Systems Revenue Market Share (%) By Applications (2018-2022)
Table 14 Global Medical Robotic Systems Market Revenue (USD Million) By Regions (2018-2022)
Table 15 Global Medical Robotic Systems Market Share (%) By Regions (2018-2022)
Table 16 North America Medical Robotic Systems Revenue (USD Million) By Country (2018-2022)
Table 17 North America Medical Robotic Systems Revenue (USD Million) By Type (2018-2022)
Table 18 North America Medical Robotic Systems Revenue (USD Million) By Applications (2018-2022)
Table 19 Europe Medical Robotic Systems Revenue (USD Million) By Country (2018-2022)
Table 20 Europe Medical Robotic Systems Revenue (USD Million) By Type (2018-2022)
Table 21 Europe Medical Robotic Systems Revenue (USD Million) By Applications (2018-2022)
Table 22 Asia Pacific Medical Robotic Systems Revenue (USD Million) By Country (2018-2022)
Table 23 Asia Pacific Medical Robotic Systems Revenue (USD Million) By Type (2018-2022)
Table 24 Asia Pacific Medical Robotic Systems Revenue (USD Million) By Applications (2018-2022)
Table 25 South America Medical Robotic Systems Revenue (USD Million) By Country (2018-2022)
Table 26 South America Medical Robotic Systems Revenue (USD Million) By Type (2018-2022)
Table 27 South America Medical Robotic Systems Revenue (USD Million) By Applications (2018-2022)
Table 28 Middle East and Africa Medical Robotic Systems Revenue (USD Million) By Region (2018-2022)
Table 29 Middle East and Africa Medical Robotic Systems Revenue (USD Million) By Type (2018-2022)
Table 30 Middle East and Africa Medical Robotic Systems Revenue (USD Million) By Applications (2018-2022)
Table 31 Financial Analysis
Table 32 Global Medical Robotic Systems Revenue (USD Million) By Type (2023-2030)
Table 33 Global Medical Robotic Systems Revenue Market Share (%) By Type (2023-2030)
Table 34 Global Medical Robotic Systems Revenue (USD Million) By Applications (2023-2030)
Table 35 Global Medical Robotic Systems Revenue Market Share (%) By Applications (2023-2030)
Table 36 Global Medical Robotic Systems Market Revenue (USD Million), And Revenue (USD Million) By Regions (2023-2030)
Table 37 North America Medical Robotic Systems Revenue (USD)By Country (2023-2030)
Table 38 North America Medical Robotic Systems Revenue (USD Million) By Type (2023-2030)
Table 39 North America Medical Robotic Systems Revenue (USD Million) By Applications (2023-2030)
Table 40 Europe Medical Robotic Systems Revenue (USD Million) By Country (2023-2030)
Table 41 Europe Medical Robotic Systems Revenue (USD Million) By Type (2023-2030)
Table 42 Europe Medical Robotic Systems Revenue (USD Million) By Applications (2023-2030)
Table 43 Asia Pacific Medical Robotic Systems Revenue (USD Million) By Country (2023-2030)
Table 44 Asia Pacific Medical Robotic Systems Revenue (USD Million) By Type (2023-2030)
Table 45 Asia Pacific Medical Robotic Systems Revenue (USD Million) By Applications (2023-2030)
Table 46 South America Medical Robotic Systems Revenue (USD Million) By Country (2023-2030)
Table 47 South America Medical Robotic Systems Revenue (USD Million) By Type (2023-2030)
Table 48 South America Medical Robotic Systems Revenue (USD Million) By Applications (2023-2030)
Table 49 Middle East and Africa Medical Robotic Systems Revenue (USD Million) By Region (2023-2030)
Table 50 Middle East and Africa Medical Robotic Systems Revenue (USD Million) By Region (2023-2030)
Table 51 Middle East and Africa Medical Robotic Systems Revenue (USD Million) By Type (2023-2030)
Table 52 Middle East and Africa Medical Robotic Systems Revenue (USD Million) By Applications (2023-2030)
Table 53 Research Programs/Design for This Report
Table 54 Key Data Information from Secondary Sources
Table 55 Key Data Information from Primary Sources
List of Figures
Figure 1 Market Scope
Figure 2 Porter’s Five Forces
Figure 3 Global Medical Robotic Systems Revenue (USD Million) By Type (2018-2022)
Figure 4 Global Medical Robotic Systems Revenue Market Share (%) By Type (2022)
Figure 5 Global Medical Robotic Systems Revenue (USD Million) By Applications (2018-2022)
Figure 6 Global Medical Robotic Systems Revenue Market Share (%) By Applications (2022)
Figure 7 Global Medical Robotic Systems Market Revenue (USD Million) By Regions (2018-2022)
Figure 8 Global Medical Robotic Systems Market Share (%) By Regions (2022)
Figure 9 North America Medical Robotic Systems Revenue (USD Million) By Country (2018-2022)
Figure 10 North America Medical Robotic Systems Revenue (USD Million) By Type (2018-2022)
Figure 11 North America Medical Robotic Systems Revenue (USD Million) By Applications (2018-2022)
Figure 12 Europe Medical Robotic Systems Revenue (USD Million) By Country (2018-2022)
Figure 13 Europe Medical Robotic Systems Revenue (USD Million) By Type (2018-2022)
Figure 14 Europe Medical Robotic Systems Revenue (USD Million) By Applications (2018-2022)
Figure 15 Asia Pacific Medical Robotic Systems Revenue (USD Million) By Country (2018-2022)
Figure 16 Asia Pacific Medical Robotic Systems Revenue (USD Million) By Type (2018-2022)
Figure 17 Asia Pacific Medical Robotic Systems Revenue (USD Million) By Applications (2018-2022)
Figure 18 South America Medical Robotic Systems Revenue (USD Million) By Country (2018-2022)
Figure 19 South America Medical Robotic Systems Revenue (USD Million) By Type (2018-2022)
Figure 20 South America Medical Robotic Systems Revenue (USD Million) By Applications (2018-2022)
Figure 21 Middle East and Africa Medical Robotic Systems Revenue (USD Million) By Region (2018-2022)
Figure 22 Middle East and Africa Medical Robotic Systems Revenue (USD Million) By Type (2018-2022)
Figure 23 Middle East and Africa Medical Robotic Systems Revenue (USD Million) By Applications (2018-2022)
Figure 24 Global Medical Robotic Systems Revenue (USD Million) By Type (2023-2030)
Figure 25 Global Medical Robotic Systems Revenue Market Share (%) By Type (2030)
Figure 26 Global Medical Robotic Systems Revenue (USD Million) By Applications (2023-2030)
Figure 27 Global Medical Robotic Systems Revenue Market Share (%) By Applications (2030)
Figure 28 Global Medical Robotic Systems Market Revenue (USD Million) By Regions (2023-2030)
Figure 29 North America Medical Robotic Systems Revenue (USD Million) By Country (2023-2030)
Figure 30 North America Medical Robotic Systems Revenue (USD Million) By Type (2023-2030)
Figure 31 North America Medical Robotic Systems Revenue (USD Million) By Applications (2023-2030)
Figure 32 Europe Medical Robotic Systems Revenue (USD Million) By Country (2023-2030)
Figure 33 Europe Medical Robotic Systems Revenue (USD Million) By Type (2023-2030)
Figure 34 Europe Medical Robotic Systems Revenue (USD Million) By Applications (2023-2030)
Figure 35 Asia Pacific Medical Robotic Systems Revenue (USD Million) By Country (2023-2030)
Figure 36 Asia Pacific Medical Robotic Systems Revenue (USD Million) By Type (2023-2030)
Figure 37 Asia Pacific Medical Robotic Systems Revenue (USD Million) By Applications (2023-2030)
Figure 38 South America Medical Robotic Systems Revenue (USD Million) By Country (2023-2030)
Figure 39 South America Medical Robotic Systems Revenue (USD Million) By Type (2023-2030)
Figure 40 South America Medical Robotic Systems Revenue (USD Million) By Applications (2023-2030)
Figure 41 Middle East and Africa Medical Robotic Systems Revenue (USD Million) By Region (2023-2030)
Figure 42 Middle East and Africa Medical Robotic Systems Revenue (USD Million) By Region (2023-2030)
Figure 43 Middle East and Africa Medical Robotic Systems Revenue (USD Million) By Type (2023-2030)
Figure 44 Middle East and Africa Medical Robotic Systems Revenue (USD Million) By Applications (2023-2030)
Figure 45 Bottom-Up and Top-Down Approaches For This Report
Figure 46 Data Triangulation
