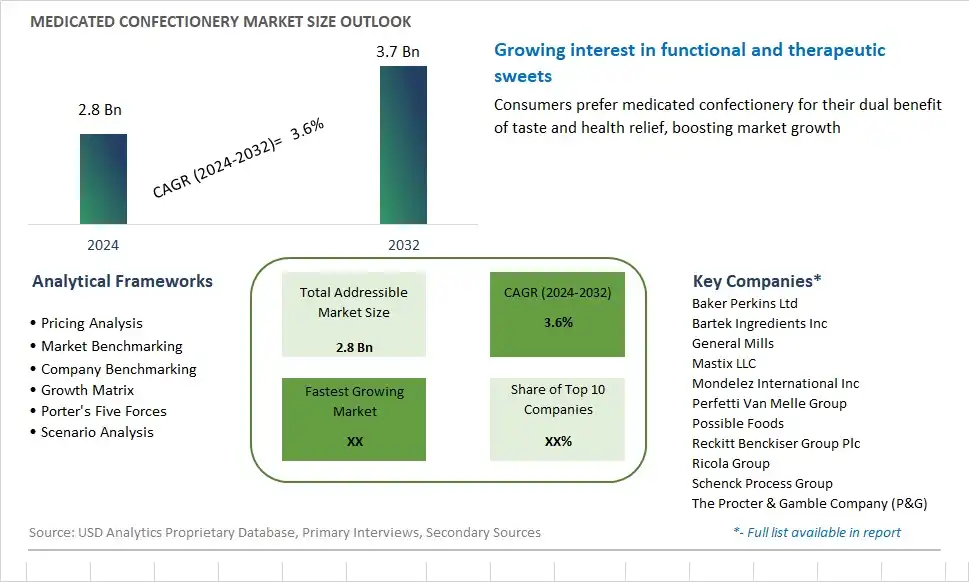
Global Medicated Confectionery Market Size is valued at $2.8 Billion in 2024 and is forecast to register a growth rate (CAGR) of 3.6% to reach $3.7 Billion by 2032.
The global Medicated Confectionery Market Comprehensive Study analyzes and forecasts the market size across 6 regions and 24 countries for diverse segments -By Type (Chocolate, Snack Bars, Candy & Sugar Confectionery, Gum & Mint), By Distribution Channel (Supermarkets/Hypermarkets, Convenience Stores, Pharmaceuticals, Online Retail, Others)
An Introduction to Medicated Confectionery Market
In 2024, the medicated confectionery market is experiencing steady growth, driven by a growing awareness of the therapeutic benefits of functional ingredients combined with indulgent treats. These products offer consumers a convenient and discreet way to address common health concerns such as coughs, sore throats, and digestive issues while satisfying their sweet cravings. Manufacturers are incorporating a variety of active ingredients such as menthol, honey, herbal extracts, and vitamins into candies, lozenges, and gums to provide targeted relief and immune support. Additionally, there's a trend towards sugar-free and natural formulations to appeal to health-conscious consumers seeking alternatives to traditional over-the-counter remedies. As demand for wellness-focused confectionery rises, expect to see continued innovation in flavors, textures, and packaging formats that cater to specific health needs and taste preferences.
Medicated Confectionery Competitive Landscape
The market report analyses the leading companies in the industry including Baker Perkins Ltd, Bartek Ingredients Inc, General Mills, Mastix LLC, Mondelez International Inc, Perfetti Van Melle Group, Possible Foods, Reckitt Benckiser Group Plc, Ricola Group, Schenck Process Group, The Procter & Gamble Company (P&G), and Others.
Medicated Confectionery Market Dynamics
Medicated Confectionery Market Trend: Growing Demand for Functional and Health-Conscious Products
A significant trend in the medicated confectionery market is the increasing consumer demand for functional and health-conscious products. As consumers become more proactive about their health and well-being, there is a growing interest in medicated confectionery that offers additional benefits beyond traditional sweet treats. Products infused with vitamins, minerals, herbal extracts, and other functional ingredients are gaining popularity, as they provide consumers with a convenient and enjoyable way to supplement their daily wellness routines. This trend is driven by a desire for convenient and accessible health solutions that fit seamlessly into busy lifestyles, reflecting a broader shift towards preventive healthcare and holistic wellness.
Market Driver: Rising Awareness of Health Benefits
A key driver for the medicated confectionery market is the increasing awareness of the health benefits associated with specific ingredients and formulations. Consumers are actively seeking products that offer targeted health benefits, such as immune support, stress relief, and energy enhancement, through the incorporation of vitamins, botanicals, and other therapeutic ingredients. This heightened awareness is fueled by factors such as growing concerns about immune health, stress management, and overall well-being, as well as the influence of healthcare professionals, wellness experts, and social media influencers promoting the use of medicated confectionery as part of a balanced lifestyle. As a result, there's a growing demand for innovative and scientifically backed products that address specific health needs and preferences, driving market growth in the medicated confectionery segment.
Market Opportunity: Expansion into Niche and Functional Categories
An opportunity for the medicated confectionery market lies in the expansion into niche and functional categories to meet the diverse needs and preferences of consumers. This includes the development of products tailored to specific health concerns or dietary requirements, such as sugar-free, gluten-free, or vegan options, to cater to individuals with unique dietary restrictions or preferences. Moreover, there's an opportunity to explore emerging functional ingredients and formulations, such as CBD-infused confectionery for relaxation and pain relief, probiotic-enriched candies for digestive health, or adaptogen-infused treats for stress management. By leveraging innovation and differentiation in product development, companies can tap into niche markets, attract new consumer segments, and establish themselves as leaders in the evolving landscape of medicated confectionery.
Medicated Confectionery Market Share Analysis: Candy & Sugar Confectionery held the dominant market share in 2024
In the medicated confectionery market, the largest segment is candy & sugar confectionery, owing to its widespread popularity, consumer preference, and diverse product offerings. Candy & sugar confectionery, including lozenges, gummies, and chewable tablets, are favored for their convenient dosage forms and enjoyable flavors, making them a preferred choice for consumers seeking both medicinal benefits and indulgence. Additionally, the sweet taste and pleasant mouthfeel of candy & sugar confectionery help mask the taste of active ingredients, enhancing the overall consumer experience. Further, the convenience of candy & sugar confectionery allows for on-the-go consumption and easy administration, appealing to busy lifestyles and diverse consumer demographics. As manufacturers continue to innovate and introduce new formulations with added health benefits, such as vitamins, minerals, and herbal extracts, candy & sugar confectionery maintains its position as the largest segment in the medicated confectionery market, driving sustained growth and market leadership within the industry.
Medicated Confectionery Market Share Analysis: Online Retail market is poised to register the fastest growth rae over the forecast period to 2032
Among the segments in the medicated confectionery market, online retail is the fastest growing segment, propelled by the increasing adoption of e-commerce platforms, convenience, and changing consumer shopping behaviors. The online retail channel offers consumers the convenience of purchasing medicated confectionery products from the comfort of their homes, with options for doorstep delivery and hassle-free transactions. Additionally, the wide availability of medicated confectionery products on various e-commerce platforms expands access to consumers in remote areas or those with limited mobility. Furthermore, online retailers often offer a broader range of products, competitive pricing, and promotional discounts, attracting price-conscious consumers seeking value for money. Further, the COVID-19 pandemic has accelerated the shift towards online shopping, with consumers prioritizing safety and minimizing in-person interactions. As online retail continues to gain traction and evolve with technological advancements, it is the fastest growing segment in the medicated confectionery market, driving significant growth and market expansion within the industry.
Medicated Confectionery Market Segmentation
By Type
Chocolate
Snack Bars
Candy & Sugar Confectionery
Gum & Mint
By Distribution Channel
Supermarkets/Hypermarkets
Convenience Stores
Pharmaceuticals
Online Retail
Others
Countries Analyzed
North America (US, Canada, Mexico)
Europe (Germany, UK, France, Spain, Italy, Russia, Rest of Europe)
Asia Pacific (China, India, Japan, South Korea, Australia, South East Asia, Rest of Asia)
South America (Brazil, Argentina, Rest of South America)
Middle East and Africa (Saudi Arabia, UAE, Rest of Middle East, South Africa, Egypt, Rest of Africa)
Medicated Confectionery Companies Profiled in the Study
Baker Perkins Ltd
Bartek Ingredients Inc
General Mills
Mastix LLC
Mondelez International Inc
Perfetti Van Melle Group
Possible Foods
Reckitt Benckiser Group Plc
Ricola Group
Schenck Process Group
The Procter & Gamble Company (P&G)
*- List Not Exhaustive
Chapter 1. TABLE OF CONTENTS
Chapter 2. Introduction to Medicated Confectionery Market
2.1. Market Overview
2.2. Key Statistics and Report Highlights
2.3. Scope of the Comprehensive Study
2.3.1. Market Definition
2.3.2 Countries and Regions Covered
2.3.3 Research Objective
2.3.4 Units, Currency, and Conversions
2.3.5 Industry Value Chain
2.4. Key Market Segments
2.5. Key Companies
2.6. Study Period
Chapter 3. Strategic Analysis Review
3.1. Medicated Confectionery Pricing Analysis and Forecast
3.2. Porter’s Five Forces
3.3. Market Ecosystem
3.4. SWOT Analysis
3.5. Regulatory Scenario
3.3. Effects of Inflation, Russia-Ukraine War, moderating economic growth, and other macroeconomic factors
Chapter 4. Competitive Landscape
4.1. Market Share Analysis
4.1.1. Global Medicated Confectionery Market Share by Company, 2023
4.1.2. Product Offerings of Leading Medicated Confectionery Companies
4.2. Market Entropy
4.2.1. New Product Launches in the Industry
4.2.2. Mergers, Acquisitions, Joint ventures, and Partnerships
4.3. Key Strategies and Best Practices
Chapter 5. Global Market Projections: Best, Reference, and Low Case Scenarios
5.1. Growth Analysis- Case Scenario Definitions
5.2. Low Growth Case Scenario Forecasts
5.3. Reference Growth Case Scenario Forecasts
5.4. High Growth Case Scenario Forecasts
Chapter 6. Market Dynamics
6.1. Medicated Confectionery Market Drivers
6.2. Medicated Confectionery Market Challenges
6.6. Medicated Confectionery Market Opportunities
6.4. Medicated Confectionery Market Trends
Chapter 7. Global Medicated Confectionery Market Outlook Trends
7.1. Global Medicated Confectionery Revenue (USD Million) and CAGR (%) by Type (2021-2032)
7.2. Global Medicated Confectionery Revenue (USD Million) and CAGR (%) by Application (2021-2032)
7.3. Global Medicated Confectionery Revenue (USD Million) and CAGR (%) by Product (2021-2032)
By Type
Chocolate
Snack Bars
Candy & Sugar Confectionery
Gum & Mint
By Distribution Channel
Supermarkets/Hypermarkets
Convenience Stores
Pharmaceuticals
Online Retail
Others
Chapter 8. Global Medicated Confectionery Regional Analysis and Outlook
8.1. Global Medicated Confectionery Revenue (USD Million) By Regions (2021- 2032)
8.2. North America Medicated Confectionery Revenue (USD Million) by Country (2021-2032)
8.2.1. United States Medicated Confectionery Regional Analysis and Outlook
8.2.2. Canada Medicated Confectionery Regional Analysis and Outlook
8.2.3. Mexico Medicated Confectionery Regional Analysis and Outlook
8.3. Europe Medicated Confectionery Revenue (USD Million), by Country (2021-2032)
8.3.1. Germany Medicated Confectionery Regional Analysis and Outlook
8.3.2. France Medicated Confectionery Regional Analysis and Outlook
8.3.3. United Kingdom Medicated Confectionery Regional Analysis and Outlook
8.3.4. Spain Medicated Confectionery Regional Analysis and Outlook
8.3.5. Italy Medicated Confectionery Regional Analysis and Outlook
8.3.6. Russia Medicated Confectionery Regional Analysis and Outlook
8.3.7. Rest of Europe Medicated Confectionery Regional Analysis and Outlook
8.4. Asia Pacific Medicated Confectionery Revenue (USD Million) by Country (2021-2032)
8.4.1. China Medicated Confectionery Regional Analysis and Outlook
8.4.2. Japan Medicated Confectionery Regional Analysis and Outlook
8.4.3. India Medicated Confectionery Regional Analysis and Outlook
8.4.4. South Korea Medicated Confectionery Regional Analysis and Outlook
8.4.5. Australia Medicated Confectionery Regional Analysis and Outlook
8.4.6. South East Asia Medicated Confectionery Regional Analysis and Outlook
8.4.7. Rest of Asia Pacific Medicated Confectionery Regional Analysis and Outlook
8.5. South America Medicated Confectionery Revenue (USD Million), by Country (2021-2032)
8.5.1. Brazil Medicated Confectionery Regional Analysis and Outlook
8.5.2. Argentina Medicated Confectionery Regional Analysis and Outlook
8.5.3. Rest of South America Medicated Confectionery Regional Analysis and Outlook
8.6. Middle East and Africa Medicated Confectionery Revenue (USD Million) by Country (2021-2032)
8.6.1. Middle East Medicated Confectionery Regional Analysis and Outlook
8.6.2. Africa Medicated Confectionery Regional Analysis and Outlook
Chapter 9. North America Medicated Confectionery Analysis and Outlook
9.1. North America Medicated Confectionery Revenue (USD Million) by Segments (2021-2032)
9.1.1. North America Medicated Confectionery Revenue (USD Million) by Type (2021-2032)
9.1.2. North America Medicated Confectionery Revenue (USD Million) by Application (2021-2032)
9.1.3. North America Medicated Confectionery Revenue (USD Million) by Product (2021-2032)
By Type
Chocolate
Snack Bars
Candy & Sugar Confectionery
Gum & Mint
By Distribution Channel
Supermarkets/Hypermarkets
Convenience Stores
Pharmaceuticals
Online Retail
Others
Chapter 10. Europe Medicated Confectionery Analysis and Outlook
10.1. Europe Medicated Confectionery Revenue (USD Million), by Segments (USD Million) (2021-2032)
10.1.1. Europe Medicated Confectionery Revenue (USD Million) by Type (2021-2032)
10.1.2. Europe Medicated Confectionery Revenue (USD Million) by Application (2021-2032)
10.1.3. Europe Medicated Confectionery Revenue (USD Million) by Product (2021-2032)
By Type
Chocolate
Snack Bars
Candy & Sugar Confectionery
Gum & Mint
By Distribution Channel
Supermarkets/Hypermarkets
Convenience Stores
Pharmaceuticals
Online Retail
Others
Chapter 11. Asia Pacific Medicated Confectionery Analysis and Outlook
11.1. Asia Pacific Medicated Confectionery Revenue (USD Million), and Revenue (USD Million) by Segments (2021-2032)
11.1.1. Asia Pacific Medicated Confectionery Revenue (USD Million) by Type (2021-2032)
11.1.2. Asia Pacific Medicated Confectionery Revenue (USD Million) by Application (2021-2032)
11.1.3. Asia Pacific Medicated Confectionery Revenue (USD Million) by Product (2021-2032)
By Type
Chocolate
Snack Bars
Candy & Sugar Confectionery
Gum & Mint
By Distribution Channel
Supermarkets/Hypermarkets
Convenience Stores
Pharmaceuticals
Online Retail
Others
Chapter 12. South America Medicated Confectionery Analysis and Outlook
12.1. South America Medicated Confectionery Revenue (USD Million), by Segments (2021-2032)
12.1.1. South America Medicated Confectionery Revenue (USD Million) by Type (2021-2032)
12.1.2. South America Medicated Confectionery Revenue (USD Million) by Application (2021-2032)
12.1.3. South America Medicated Confectionery Revenue (USD Million) by Product (2021-2032)
By Type
Chocolate
Snack Bars
Candy & Sugar Confectionery
Gum & Mint
By Distribution Channel
Supermarkets/Hypermarkets
Convenience Stores
Pharmaceuticals
Online Retail
Others
Chapter 13. Middle East and Africa Medicated Confectionery Analysis and Outlook
13.1. Middle East and Africa Medicated Confectionery Revenue (USD Million), by Segments (2021-2032)
13.1.1. Middle East and Africa Medicated Confectionery Revenue (USD Million) by Type (2021-2032)
13.1.2. Middle East and Africa Medicated Confectionery Revenue (USD Million) by Application (2021-2032)
13.1.3. Middle East and Africa Medicated Confectionery Revenue (USD Million) by Product (2021-2032)
By Type
Chocolate
Snack Bars
Candy & Sugar Confectionery
Gum & Mint
By Distribution Channel
Supermarkets/Hypermarkets
Convenience Stores
Pharmaceuticals
Online Retail
Others
Chapter 14. Medicated Confectionery Company Profiles
14.1 Business Overview
14.2 Product Profiles
14.3 SWOT Profiles
14.5 Recent Developments
14.6 Financial Profile
List of Companies
Baker Perkins Ltd
Bartek Ingredients Inc
General Mills
Mastix LLC
Mondelez International Inc
Perfetti Van Melle Group
Possible Foods
Reckitt Benckiser Group Plc
Ricola Group
Schenck Process Group
The Procter & Gamble Company (P&G)
15. Methodology and Data Sources
15.1 Customization Offerings
15.2 Subscription Services
15.3 Related Reports
15.4 Publisher Expertise
LIST OF TABLES
Table 1 Market Segmentation Analysis
Table 2 Global Medicated Confectionery Market Share of Leading Companies, 2023
Table 3 Product Offerings of Leading Companies
Table 4 Low Growth Scenario Forecasts
Table 5 Reference Case Growth Scenario
Table 6 High Growth Case Scenario
Table 7 Global Medicated Confectionery Revenue (USD Million) And CAGR (%) By Type (2021-2032)
Table 8 Global Medicated Confectionery Revenue (USD Million) And CAGR (%) By Application (2021-2032)
Table 9 Global Medicated Confectionery Revenue (USD Million) And CAGR (%) By Product (2021-2032)
Table 10 Global Medicated Confectionery Market Revenue (USD Million) By Regions (2021-2032)
Table 11 Global Medicated Confectionery Market Share (%) By Regions (2021-2032)
Table 12 North America Medicated Confectionery Revenue (USD Million) By Country (2021-2032)
Table 13 Europe Medicated Confectionery Revenue (USD Million) By Country (2021-2032)
Table 14 Asia Pacific Medicated Confectionery Revenue (USD Million) By Country (2021-2032)
Table 15 South America Medicated Confectionery Revenue (USD Million) By Country (2021-2032)
Table 16 Middle East and Africa Medicated Confectionery Revenue (USD Million) By Region (2021-2032)
Table 17 North America Medicated Confectionery Revenue (USD Million) By Type (2021-2032)
Table 18 North America Medicated Confectionery Revenue (USD Million) By Application (2021-2032)
Table 19 North America Medicated Confectionery Revenue (USD Million) By Product (2021-2032)
Table 20 Europe Medicated Confectionery Revenue (USD Million) By Type (2021-2032)
Table 21 Europe Medicated Confectionery Revenue (USD Million) By Application (2021-2032)
Table 22 Europe Medicated Confectionery Revenue (USD Million) By Product (2021-2032)
Table 23 Asia Pacific Medicated Confectionery Revenue (USD Million) By Type (2021-2032)
Table 24 Asia Pacific Medicated Confectionery Revenue (USD Million) By Application (2021-2032)
Table 25 Asia Pacific Medicated Confectionery Revenue (USD Million) By Product (2021-2032)
Table 26 South America Medicated Confectionery Revenue (USD Million) By Type (2021-2032)
Table 27 South America Medicated Confectionery Revenue (USD Million) By Application (2021-2032)
Table 28 South America Medicated Confectionery Revenue (USD Million) By Product (2021-2032)
Table 29 Middle East and Africa Medicated Confectionery Revenue (USD Million) By Type (2021-2032)
Table 30 Middle East and Africa Medicated Confectionery Revenue (USD Million) By Application (2021-2032)
Table 31 Middle East and Africa Medicated Confectionery Revenue (USD Million) By Product (2021-2032)
LIST OF FIGURES
Figure 1. Market Scope
Figure 2. Pricing Forecasts Per Unit, 2023- 2032
Figure 3. Porter’s Five Forces
Figure 4. Global Medicated Confectionery Market Revenue (USD Million) By Regions (2021-2032)
Figure 5. Global Medicated Confectionery Market Share (%) By Regions (2023)
Figure 6. North America Medicated Confectionery Revenue (USD Million) By Country (2021-2032)
Figure 7. United States Medicated Confectionery Revenue (USD Million) By Country (2021-2032)
Figure 8. Canada Medicated Confectionery Revenue (USD Million) By Country (2021-2032)
Figure 9. Mexico Medicated Confectionery Revenue (USD Million) By Country (2021-2032)
Figure 10. Europe Medicated Confectionery Revenue (USD Million) By Country (2021-2032)
Figure 11. Germany Medicated Confectionery Revenue (USD Million) By Country (2021-2032)
Figure 12. France Medicated Confectionery Revenue (USD Million) By Country (2021-2032)
Figure 13. United Kingdom Medicated Confectionery Revenue (USD Million) By Country (2021-2032)
Figure 14. Spain Medicated Confectionery Revenue (USD Million) By Country (2021-2032)
Figure 15. Italy Medicated Confectionery Revenue (USD Million) By Country (2021-2032)
Figure 16. Russia Medicated Confectionery Revenue (USD Million) By Country (2021-2032)
Figure 17. Rest of Europe Medicated Confectionery Revenue (USD Million) By Country (2021-2032)
Figure 11. Asia Pacific Medicated Confectionery Revenue (USD Million) By Country (2021-2032)
Figure 12. China Medicated Confectionery Revenue (USD Million) By Country (2021-2032)
Figure 13. Japan Medicated Confectionery Revenue (USD Million) By Country (2021-2032)
Figure 14. India Medicated Confectionery Revenue (USD Million) By Country (2021-2032)
Figure 15. South Korea Medicated Confectionery Revenue (USD Million) By Country (2021-2032)
Figure 16. Australia Medicated Confectionery Revenue (USD Million) By Country (2021-2032)
Figure 17. South East Asia Medicated Confectionery Revenue (USD Million) By Country (2021-2032)
Figure 18. South America Medicated Confectionery Revenue (USD Million) By Country (2021-2032)
Figure 19. Brazil Medicated Confectionery Revenue (USD Million) By Country (2021-2032)
Figure 20. Argentina Medicated Confectionery Revenue (USD Million) By Country (2021-2032)
Figure 21. Rest of Asia Pacific Medicated Confectionery Revenue (USD Million) By Country (2021-2032)
Figure 22. Middle East and Africa Medicated Confectionery Revenue (USD Million) By Region (2021-2032)
Figure 23. Saudi Arabia Medicated Confectionery Revenue (USD Million) By Region (2021-2032)
Figure 24. The UAE Medicated Confectionery Revenue (USD Million) By Region (2021-2032)
Figure 25. Rest of Middle East Medicated Confectionery Revenue (USD Million) By Region (2021-2032)
Figure 26. South Africa Medicated Confectionery Revenue (USD Million) By Region (2021-2032)
Figure 27. Africa Medicated Confectionery Revenue (USD Million) By Region (2021-2032)
Figure 28. North America Medicated Confectionery Revenue (USD Million) By Type (2021-2032)
Figure 29. North America Medicated Confectionery Revenue (USD Million) By Application (2021-2032)
Figure 30. North America Medicated Confectionery Revenue (USD Million) By Product (2021-2032)
Figure 31. Europe Medicated Confectionery Revenue (USD Million) By Type (2021-2032)
Figure 32. Europe Medicated Confectionery Revenue (USD Million) By Application (2021-2032)
Figure 33. Europe Medicated Confectionery Revenue (USD Million) By Product (2021-2032)
Figure 34. Asia Pacific Medicated Confectionery Revenue (USD Million) By Type (2021-2032)
Figure 35. Asia Pacific Medicated Confectionery Revenue (USD Million) By Application (2021-2032)
Figure 36. Asia Pacific Medicated Confectionery Revenue (USD Million) By Product (2021-2032)
Figure 37. South America Medicated Confectionery Revenue (USD Million) By Type (2021-2032)
Figure 38. South America Medicated Confectionery Revenue (USD Million) By Application (2021-2032)
Figure 39. South America Medicated Confectionery Revenue (USD Million) By Product (2021-2032)
Figure 40. Middle East and Africa Medicated Confectionery Revenue (USD Million) By Type (2021-2032)
Figure 41. Middle East and Africa Medicated Confectionery Revenue (USD Million) By Application (2021-2032)
Figure 42. Middle East and Africa Medicated Confectionery Revenue (USD Million) By Product (2021-2032)
By Type
Chocolate
Snack Bars
Candy & Sugar Confectionery
Gum & Mint
By Distribution Channel
Supermarkets/Hypermarkets
Convenience Stores
Pharmaceuticals
Online Retail
Others
Countries Analyzed
North America (US, Canada, Mexico)
Europe (Germany, UK, France, Spain, Italy, Russia, Rest of Europe)
Asia Pacific (China, India, Japan, South Korea, Australia, South East Asia, Rest of Asia)
South America (Brazil, Argentina, Rest of South America)
Middle East and Africa (Saudi Arabia, UAE, Rest of Middle East, South Africa, Egypt, Rest of Africa)
