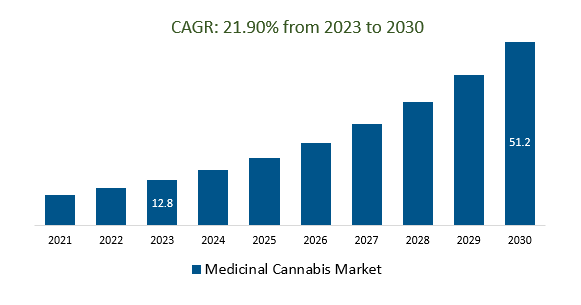
The global Medicinal Cannabis Systems Market Size is estimated to be US$ 12.8 Billion in 2023 and is poised to register 21.90% growth over the forecast period from 2023 to 2030 to reach $51.2 billion in 2030.
The market growth is driven by an increasing global trend toward the legalization and regulation of medical cannabis has been a major driver in the industry. Countries and states are recognizing the potential therapeutic benefits of cannabis and are establishing frameworks to ensure safe and controlled access and the medical applications of cannabis are ongoing, with promising findings for conditions such as chronic pain, epilepsy, multiple sclerosis, and certain mental health disorders clinical evidence emerges, the range of medical applications to expand.
Leading companies are focusing on Wider Legalization and Regulation, Patient Education and Awareness, Healthcare Professional Training, Global Trade and Supply Chains, Research and Clinical Advancements, Investment and Research Funding, and others to boost market shares in the industry.
Market Overview
The growing wave of legalization and regulation of medical cannabis is expanding the potential customer base leading to increased access to medical cannabis products for patients suffering from various conditions, driving the market growth and providing a framework for quality control, safety standards, and consumer protection. It also reduces the stigma associated with cannabis, encouraging more patients to explore its potential development of pharmaceutical-grade cannabis-based medications lends credibility to the industry. These medications undergo rigorous testing and regulatory approval, instilling confidence in healthcare professionals and patients.
Market Dynamics
Market Trends: Companies are launching Integration of Technology to attract a consumer base
The integration of technology in the medicinal cannabis market is having a profound impact on various aspects of the industry, from cultivation and processing to distribution, patient care, and research. Cultivation and Processing Efficiency technology-driven cultivation systems, such as automated lighting, nutrient delivery, and environmental controls, optimize plant growth, leading to higher consistency of blockchain technology that enables transparent records of the entire supply chain, providing consumers and regulators with real-time information on product origins and quality.
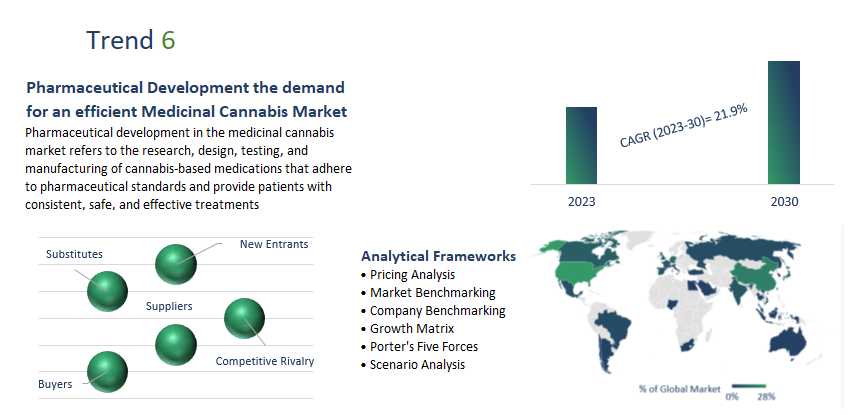
Market Drives: Pharmaceutical Development the demand for an efficient Medicinal Cannabis Market
Pharmaceutical development in the medicinal cannabis market refers to the research, design, testing, and manufacturing of cannabis-based medications that adhere to pharmaceutical standards and provide patients with consistent, safe, and effective treatments while also gaining the confidence of medical professionals and regulator development involves rigorous quality control measures to ensure consistent cannabinoid content, dosage accuracy, and product uniformity. This standardization is crucial for providing reliable and predictable therapeutic outcomes for patients.
Market Opportunity: Introduction of Increasing Acceptance and Awareness
Growing public awareness and acceptance of the potential medical benefits of cannabis drive patient demand and encourage further research and development and increasing acceptance and awareness in the medicinal cannabis market refers to the growing recognition of the potential medical benefits of cannabis and the broader understanding of its applications. This shift in perception is significantly influencing patient behavior, healthcare practices, research initiatives, and policy decisions. Here's a detailed elaboration of the impact of increasing acceptance and awareness in the medicinal cannabis market Patient Engagement and Adoption, Market Growth, Media and Entertainment Influence, and Medical Professional Support.
Market Segmentation
Cannabis Extracts: These contain a wide range of cannabinoids, terpenes, and other plant compounds found in the cannabis plant. They are believed to create an entourage effect the combination of multiple compounds enhances therapeutic benefits.
Mental Disorders: The increasing evidence that cannabinoids, the active ingredients in cannabis, can be effective in treating a variety of mental health conditions, including anxiety, depression, post-traumatic stress disorder (PTSD), schizophrenia, and attention deficit hyperactivity disorder (ADHD).
The most common cannabinoid for the treatment of mental disorders is cannabidiol (CBD). CBD is a non-psychoactive compound that has been shown to have anti-anxiety, anti-depressant, and anti-psychotic effects. CBD has also been shown to improve sleep quality and reduce pain, which can be beneficial for people with mental health conditions.
Research & Development Centers: Research and development (R&D) centers play a crucial role in advancing the medicinal cannabis market by conducting scientific research, clinical trials, and developing innovative products and technologies. These centers contribute to the understanding of cannabis's medical applications, safety profiles, and potential benefits for various health conditions.
Market Segmentation
By Point of Sale
- Dispensaries
- Online Pharmacy
- Hospital Pharmacy
By Active Ingredient
- Tetrahydrocannabinol
- Cannabidiol
By Therapeutic Application
- Pain
- Arthritis
- Neurological Disease
- Others
By Region
- North America (United States, Canada, Mexico)
- Europe (Germany, France, United Kingdom, Spain, Italy, Others)
- Asia Pacific (China, India, Japan, South Korea, Australia, Others)
- Latin America (Brazil, Argentina, Others)
- Middle East and Africa (Saudi Arabia, UAE, Kuwait, Other Middle East, South Africa, Nigeria, Other Africa)
Key Players
Leading companies profiled in the study include-
- BOL Pharma
- Tilray Brands Inc
- Medreleaf Corporation
- Aurora Cannabis Inc
- Canopy Growth Corporation
- Insys Therapeutics Inc
- Aphria Inc
- MGC Pharmaceuticals Ltd
- GW Pharmaceuticals plc
- Medical Marijuana Inc
Medicinal Cannabis Market Systems Market Outlook 2023
1 Market Overview
1.1 Introduction to Medicinal Cannabis Market Systems Market
1.2 Scope of the Study
1.3 Research Objective
1.3.1 Key Market Scope and Segments
1.3.2 Players Covered
1.3.3 Years Considered
2 Executive Summary
2.1 2023 Medicinal Cannabis Market Systems Industry- Market Statistics
3 Market Dynamics
3.1 Market Drivers
3.2 Market Challenges
3.3 Market Opportunities
3.4 Market Trends
4 Market Factor Analysis
4.1 Porter’s Five Forces
4.2 Market Entropy
4.2.1 Global Medicinal Cannabis Market Systems Market Companies with Area Served
4.2.2 Products Offerings Global Medicinal Cannabis Market Systems Market
5 COVID-19 Impact Analysis and Outlook Scenarios
5.1.1 Covid-19 Impact Analysis
5.1.2 Post-COVID-19 Scenario- Low Growth Case
5.1.3 Post-COVID-19 Scenario- Reference Growth Case
5.1.4 Post-COVID-19 Scenario- Low Growth Case
6 Global Medicinal Cannabis Market Systems Market Trends
6.1 Global Medicinal Cannabis Market Systems Revenue (USD Million) and CAGR (%) by Type (2018-2030)
6.2 Global Medicinal Cannabis Market Systems Revenue (USD Million) and CAGR (%) by Applications (2018-2030)
6.3 Global Medicinal Cannabis Market Systems Revenue (USD Million) and CAGR (%) by Regions (2018-2030)
7 Global Medicinal Cannabis Market Systems Market Revenue (USD Million) by Type, and Applications (2018-2022)
7.1 Global Medicinal Cannabis Market Systems Revenue (USD Million) by Type (2018-2022)
7.1.1 Global Medicinal Cannabis Market Systems Revenue (USD Million), Market Share (%) by Type (2018-2022)
7.2 Global Medicinal Cannabis Market Systems Revenue (USD Million) by Applications (2018-2022)
7.2.1 Global Medicinal Cannabis Market Systems Revenue (USD Million), Market Share (%) by Applications (2018-2022)
8 Global Medicinal Cannabis Market Systems Development Regional Status and Outlook
8.1 Global Medicinal Cannabis Market Systems Revenue (USD Million) By Regions (2018-2022)
8.2 North America Medicinal Cannabis Market Systems Revenue (USD Million) by Type, and Application (2018-2022)
8.2.1 North America Medicinal Cannabis Market Systems Revenue (USD Million) by Country (2018-2022)
8.2.2 North America Medicinal Cannabis Market Systems Revenue (USD Million) by Type (2018-2022)
8.2.3 North America Medicinal Cannabis Market Systems Revenue (USD Million) by Applications (2018-2022)
8.3 Europe Medicinal Cannabis Market Systems Revenue (USD Million), by Type, and Applications (USD Million) (2018-2022)
8.3.1 Europe Medicinal Cannabis Market Systems Revenue (USD Million), by Country (2018-2022)
8.3.2 Europe Medicinal Cannabis Market Systems Revenue (USD Million) by Type (2018-2022)
8.3.3 Europe Medicinal Cannabis Market Systems Revenue (USD Million) by Applications (2018-2022)
8.4 Asia Pacific Medicinal Cannabis Market Systems Revenue (USD Million), and Revenue (USD Million) by Type, and Applications (2018-2022)
8.4.1 Asia Pacific Medicinal Cannabis Market Systems Revenue (USD Million) by Country (2018-2022)
8.4.2 Asia Pacific Medicinal Cannabis Market Systems Revenue (USD Million) by Type (2018-2022)
8.4.3 Asia Pacific Medicinal Cannabis Market Systems Revenue (USD Million) by Applications (2018-2022)
8.5 South America Medicinal Cannabis Market Systems Revenue (USD Million), by Type, and Applications (2018-2022)
8.5.1 South America Medicinal Cannabis Market Systems Revenue (USD Million), by Country (2018-2022)
8.5.2 South America Medicinal Cannabis Market Systems Revenue (USD Million) by Type (2018-2022)
8.5.3 South America Medicinal Cannabis Market Systems Revenue (USD Million) by Applications (2018-2022)
8.6 Middle East and Africa Medicinal Cannabis Market Systems Revenue (USD Million), by Type, Technology, Application, Thickness (2018-2022)
8.6.1 Middle East and Africa Medicinal Cannabis Market Systems Revenue (USD Million) by Country (2018-2022)
8.6.2 Middle East and Africa Medicinal Cannabis Market Systems Revenue (USD Million) by Type (2018-2022)
8.6.3 Middle East and Africa Medicinal Cannabis Market Systems Revenue (USD Million) by Applications (2018-2022)
9 Company Profiles
10 Global Medicinal Cannabis Market Systems Market Revenue (USD Million), by Type, and Applications (2023-2030)
10.1 Global Medicinal Cannabis Market Systems Revenue (USD Million) and Market Share (%) by Type (2023-2030)
10.1.1 Global Medicinal Cannabis Market Systems Revenue (USD Million), and Market Share (%) by Type (2023-2030)
10.2 Global Medicinal Cannabis Market Systems Revenue (USD Million) and Market Share (%) by Applications (2023-2030)
10.2.1 Global Medicinal Cannabis Market Systems Revenue (USD Million), and Market Share (%) by Applications (2023-2030)
11 Global Medicinal Cannabis Market Systems Development Regional Status and Outlook Forecast
11.1 Global Medicinal Cannabis Market Systems Revenue (USD Million) By Regions (2023-2030)
11.2 North America Medicinal Cannabis Market Systems Revenue (USD Million) by Type, and Applications (2023-2030)
11.2.1 North America Medicinal Cannabis Market Systems Revenue (USD) Million by Country (2023-2030)
11.2.2 North America Medicinal Cannabis Market Systems Revenue (USD Million), by Type (2023-2030)
11.2.3 North America Medicinal Cannabis Market Systems Revenue (USD Million), Market Share (%) by Applications (2023-2030)
11.3 Europe Medicinal Cannabis Market Systems Revenue (USD Million), by Type, and Applications (2023-2030)
11.3.1 Europe Medicinal Cannabis Market Systems Revenue (USD Million), by Country (2023-2030)
11.3.2 Europe Medicinal Cannabis Market Systems Revenue (USD Million), by Type (2023-2030)
11.3.3 Europe Medicinal Cannabis Market Systems Revenue (USD Million), by Applications (2023-2030)
11.4 Asia Pacific Medicinal Cannabis Market Systems Revenue (USD Million) by Type, and Applications (2023-2030)
11.4.1 Asia Pacific Medicinal Cannabis Market Systems Revenue (USD Million), by Country (2023-2030)
11.4.2 Asia Pacific Medicinal Cannabis Market Systems Revenue (USD Million), by Type (2023-2030)
11.4.3 Asia Pacific Medicinal Cannabis Market Systems Revenue (USD Million), by Applications (2023-2030)
11.5 South America Medicinal Cannabis Market Systems Revenue (USD Million), by Type, and Applications (2023-2030)
11.5.1 South America Medicinal Cannabis Market Systems Revenue (USD Million), by Country (2023-2030)
11.5.2 South America Medicinal Cannabis Market Systems Revenue (USD Million), by Type (2023-2030)
11.5.3 South America Medicinal Cannabis Market Systems Revenue (USD Million), by Applications (2023-2030)
11.6 Middle East and Africa Medicinal Cannabis Market Systems Revenue (USD Million), by Type, and Applications (2023-2030)
11.6.1 Middle East and Africa Medicinal Cannabis Market Systems Revenue (USD Million), by Region (2023-2030)
11.6.2 Middle East and Africa Medicinal Cannabis Market Systems Revenue (USD Million), by Type (2023-2030)
11.6.3 Middle East and Africa Medicinal Cannabis Market Systems Revenue (USD Million), by Applications (2023-2030)
12 Methodology and Data Sources
12.1 Methodology/Research Approach
12.1.1 Research Programs/Design
12.1.2 Market Size Estimation
12.1.3 Market Breakdown and Data Triangulation
12.2 Data Sources
12.2.1 Secondary Sources
12.2.2 Primary Sources
12.3 Disclaimer
List Of Tables
Table 1 Market Segmentation Analysis
Table 2 Global Medicinal Cannabis Market Systems Market Companies with Areas Served
Table 3 Products Offerings Global Medicinal Cannabis Market Systems Market
Table 4 Low Growth Scenario Forecasts
Table 5 Reference Case Growth Scenario
Table 6 High Growth Case Scenario
Table 7 Global Medicinal Cannabis Market Systems Revenue (USD Million) And CAGR (%) By Type (2018-2030)
Table 8 Global Medicinal Cannabis Market Systems Revenue (USD Million) And CAGR (%) By Applications (2018-2030)
Table 9 Global Medicinal Cannabis Market Systems Revenue (USD Million) And CAGR (%) By Regions (2018-2030)
Table 10 Global Medicinal Cannabis Market Systems Revenue (USD Million) By Type (2018-2022)
Table 11 Global Medicinal Cannabis Market Systems Revenue Market Share (%) By Type (2018-2022)
Table 12 Global Medicinal Cannabis Market Systems Revenue (USD Million) By Applications (2018-2022)
Table 13 Global Medicinal Cannabis Market Systems Revenue Market Share (%) By Applications (2018-2022)
Table 14 Global Medicinal Cannabis Market Systems Market Revenue (USD Million) By Regions (2018-2022)
Table 15 Global Medicinal Cannabis Market Systems Market Share (%) By Regions (2018-2022)
Table 16 North America Medicinal Cannabis Market Systems Revenue (USD Million) By Country (2018-2022)
Table 17 North America Medicinal Cannabis Market Systems Revenue (USD Million) By Type (2018-2022)
Table 18 North America Medicinal Cannabis Market Systems Revenue (USD Million) By Applications (2018-2022)
Table 19 Europe Medicinal Cannabis Market Systems Revenue (USD Million) By Country (2018-2022)
Table 20 Europe Medicinal Cannabis Market Systems Revenue (USD Million) By Type (2018-2022)
Table 21 Europe Medicinal Cannabis Market Systems Revenue (USD Million) By Applications (2018-2022)
Table 22 Asia Pacific Medicinal Cannabis Market Systems Revenue (USD Million) By Country (2018-2022)
Table 23 Asia Pacific Medicinal Cannabis Market Systems Revenue (USD Million) By Type (2018-2022)
Table 24 Asia Pacific Medicinal Cannabis Market Systems Revenue (USD Million) By Applications (2018-2022)
Table 25 South America Medicinal Cannabis Market Systems Revenue (USD Million) By Country (2018-2022)
Table 26 South America Medicinal Cannabis Market Systems Revenue (USD Million) By Type (2018-2022)
Table 27 South America Medicinal Cannabis Market Systems Revenue (USD Million) By Applications (2018-2022)
Table 28 Middle East and Africa Medicinal Cannabis Market Systems Revenue (USD Million) By Region (2018-2022)
Table 29 Middle East and Africa Medicinal Cannabis Market Systems Revenue (USD Million) By Type (2018-2022)
Table 30 Middle East and Africa Medicinal Cannabis Market Systems Revenue (USD Million) By Applications (2018-2022)
Table 31 Financial Analysis
Table 32 Global Medicinal Cannabis Market Systems Revenue (USD Million) By Type (2023-2030)
Table 33 Global Medicinal Cannabis Market Systems Revenue Market Share (%) By Type (2023-2030)
Table 34 Global Medicinal Cannabis Market Systems Revenue (USD Million) By Applications (2023-2030)
Table 35 Global Medicinal Cannabis Market Systems Revenue Market Share (%) By Applications (2023-2030)
Table 36 Global Medicinal Cannabis Market Systems Market Revenue (USD Million), And Revenue (USD Million) By Regions (2023-2030)
Table 37 North America Medicinal Cannabis Market Systems Revenue (USD)By Country (2023-2030)
Table 38 North America Medicinal Cannabis Market Systems Revenue (USD Million) By Type (2023-2030)
Table 39 North America Medicinal Cannabis Market Systems Revenue (USD Million) By Applications (2023-2030)
Table 40 Europe Medicinal Cannabis Market Systems Revenue (USD Million) By Country (2023-2030)
Table 41 Europe Medicinal Cannabis Market Systems Revenue (USD Million) By Type (2023-2030)
Table 42 Europe Medicinal Cannabis Market Systems Revenue (USD Million) By Applications (2023-2030)
Table 43 Asia Pacific Medicinal Cannabis Market Systems Revenue (USD Million) By Country (2023-2030)
Table 44 Asia Pacific Medicinal Cannabis Market Systems Revenue (USD Million) By Type (2023-2030)
Table 45 Asia Pacific Medicinal Cannabis Market Systems Revenue (USD Million) By Applications (2023-2030)
Table 46 South America Medicinal Cannabis Market Systems Revenue (USD Million) By Country (2023-2030)
Table 47 South America Medicinal Cannabis Market Systems Revenue (USD Million) By Type (2023-2030)
Table 48 South America Medicinal Cannabis Market Systems Revenue (USD Million) By Applications (2023-2030)
Table 49 Middle East and Africa Medicinal Cannabis Market Systems Revenue (USD Million) By Region (2023-2030)
Table 50 Middle East and Africa Medicinal Cannabis Market Systems Revenue (USD Million) By Region (2023-2030)
Table 51 Middle East and Africa Medicinal Cannabis Market Systems Revenue (USD Million) By Type (2023-2030)
Table 52 Middle East and Africa Medicinal Cannabis Market Systems Revenue (USD Million) By Applications (2023-2030)
Table 53 Research Programs/Design for This Report
Table 54 Key Data Information from Secondary Sources
Table 55 Key Data Information from Primary Sources
List Of Figures
Figure 1 Market Scope
Figure 2 Porter’s Five Forces
Figure 3 Global Medicinal Cannabis Market Systems Revenue (USD Million) By Type (2018-2022)
Figure 4 Global Medicinal Cannabis Market Systems Revenue Market Share (%) By Type (2022)
Figure 5 Global Medicinal Cannabis Market Systems Revenue (USD Million) By Applications (2018-2022)
Figure 6 Global Medicinal Cannabis Market Systems Revenue Market Share (%) By Applications (2022)
Figure 7 Global Medicinal Cannabis Market Systems Market Revenue (USD Million) By Regions (2018-2022)
Figure 8 Global Medicinal Cannabis Market Systems Market Share (%) By Regions (2022)
Figure 9 North America Medicinal Cannabis Market Systems Revenue (USD Million) By Country (2018-2022)
Figure 10 North America Medicinal Cannabis Market Systems Revenue (USD Million) By Type (2018-2022)
Figure 11 North America Medicinal Cannabis Market Systems Revenue (USD Million) By Applications (2018-2022)
Figure 12 Europe Medicinal Cannabis Market Systems Revenue (USD Million) By Country (2018-2022)
Figure 13 Europe Medicinal Cannabis Market Systems Revenue (USD Million) By Type (2018-2022)
Figure 14 Europe Medicinal Cannabis Market Systems Revenue (USD Million) By Applications (2018-2022)
Figure 15 Asia Pacific Medicinal Cannabis Market Systems Revenue (USD Million) By Country (2018-2022)
Figure 16 Asia Pacific Medicinal Cannabis Market Systems Revenue (USD Million) By Type (2018-2022)
Figure 17 Asia Pacific Medicinal Cannabis Market Systems Revenue (USD Million) By Applications (2018-2022)
Figure 18 South America Medicinal Cannabis Market Systems Revenue (USD Million) By Country (2018-2022)
Figure 19 South America Medicinal Cannabis Market Systems Revenue (USD Million) By Type (2018-2022)
Figure 20 South America Medicinal Cannabis Market Systems Revenue (USD Million) By Applications (2018-2022)
Figure 21 Middle East and Africa Medicinal Cannabis Market Systems Revenue (USD Million) By Region (2018-2022)
Figure 22 Middle East and Africa Medicinal Cannabis Market Systems Revenue (USD Million) By Type (2018-2022)
Figure 23 Middle East and Africa Medicinal Cannabis Market Systems Revenue (USD Million) By Applications (2018-2022)
Figure 24 Global Medicinal Cannabis Market Systems Revenue (USD Million) By Type (2023-2030)
Figure 25 Global Medicinal Cannabis Market Systems Revenue Market Share (%) By Type (2030)
Figure 26 Global Medicinal Cannabis Market Systems Revenue (USD Million) By Applications (2023-2030)
Figure 27 Global Medicinal Cannabis Market Systems Revenue Market Share (%) By Applications (2030)
Figure 28 Global Medicinal Cannabis Market Systems Market Revenue (USD Million) By Regions (2023-2030)
Figure 29 North America Medicinal Cannabis Market Systems Revenue (USD Million) By Country (2023-2030)
Figure 30 North America Medicinal Cannabis Market Systems Revenue (USD Million) By Type (2023-2030)
Figure 31 North America Medicinal Cannabis Market Systems Revenue (USD Million) By Applications (2023-2030)
Figure 32 Europe Medicinal Cannabis Market Systems Revenue (USD Million) By Country (2023-2030)
Figure 33 Europe Medicinal Cannabis Market Systems Revenue (USD Million) By Type (2023-2030)
Figure 34 Europe Medicinal Cannabis Market Systems Revenue (USD Million) By Applications (2023-2030)
Figure 35 Asia Pacific Medicinal Cannabis Market Systems Revenue (USD Million) By Country (2023-2030)
Figure 36 Asia Pacific Medicinal Cannabis Market Systems Revenue (USD Million) By Type (2023-2030)
Figure 37 Asia Pacific Medicinal Cannabis Market Systems Revenue (USD Million) By Applications (2023-2030)
Figure 38 South America Medicinal Cannabis Market Systems Revenue (USD Million) By Country (2023-2030)
Figure 39 South America Medicinal Cannabis Market Systems Revenue (USD Million) By Type (2023-2030)
Figure 40 South America Medicinal Cannabis Market Systems Revenue (USD Million) By Applications (2023-2030)
Figure 41 Middle East and Africa Medicinal Cannabis Market Systems Revenue (USD Million) By Region (2023-2030)
Figure 42 Middle East and Africa Medicinal Cannabis Market Systems Revenue (USD Million) By Region (2023-2030)
Figure 43 Middle East and Africa Medicinal Cannabis Market Systems Revenue (USD Million) By Type (2023-2030)
Figure 44 Middle East and Africa Medicinal Cannabis Market Systems Revenue (USD Million) By Applications (2023-2030)
Figure 45 Bottom-Up and Top-Down Approaches For This Report
Figure 46 Data Triangulation
