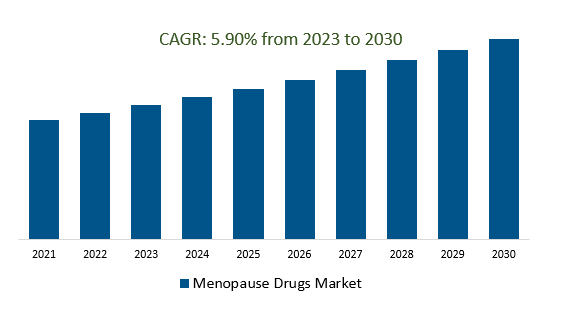
The global Menopause Drugs Market Size is estimated to register 5.9% growth over the forecast period from 2023 to 2030.
The market growth is driven by the integration of digital health platforms, including apps and wearable devices, which have enabled women to monitor their health, track symptoms, and access information about menopause management. Further, Menopause drugs are increasingly being developed with a focus on improving the overall quality of life for women by addressing not only physical symptoms but also emotional and psychological well-being. Leading companies are Personalized Medicine, Non-Hormonal Therapies, Digital Health Solutions, Focus on Quality of Life, and others to boost market shares in the industry.
Market Overview
The Menopause Drugs Market encompasses pharmaceutical products designed to manage symptoms of menopause; a natural process marked by hormonal changes in women as they age. It includes hormone replacement therapies, non-hormonal prescriptions, vaginal estrogen products, herbal supplements, and osteoporosis medications. Influenced by factors like the aging population, awareness, and technological advancements, the market trends towards non-hormonal options, personalized treatments, and holistic approaches, with key players including pharmaceutical companies like Pfizer and Novo Nordisk. The market's landscape is shaped by changing demographics, healthcare trends, regulatory considerations, and innovations in drug delivery methods.
Market Dynamics
Market Trends- Companies are launching Digital Health Solutions to attract a consumer base
Digital health solutions are revolutionizing the Menopause Drugs Market by offering personalized symptom tracking, educational resources, telemedicine services, and emotional support through mobile apps, wearables, and online platforms. These technologies empower women to manage symptoms, access medical guidance, and connect with a community, ultimately enhancing treatment adherence, well-being, and engagement in their menopause journey.
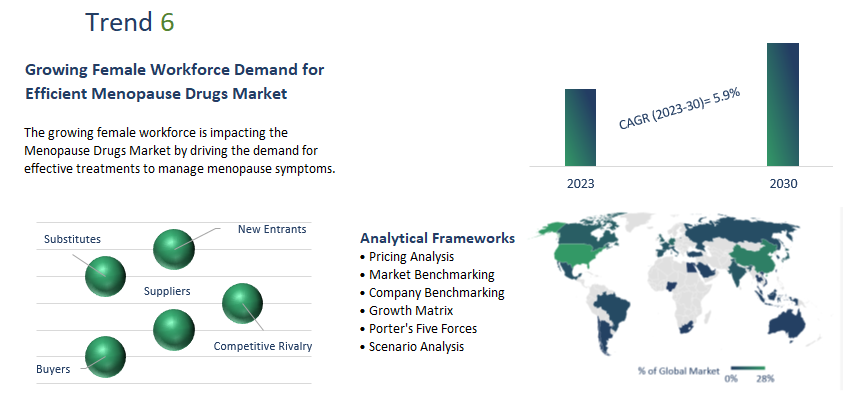
Market Driver- Growing Female Workforce Demand for Efficient Menopause Drugs Market
The growing female workforce is impacting the Menopause Drugs Market by driving the demand for effective treatments to manage menopause symptoms. As women continue to work during their menopausal years, there is an increased need for solutions that address issues like hot flashes, mood swings, and reduced concentration, which can affect job performance and quality of life. This trend is prompting pharmaceutical companies to develop tailored medications and interventions that cater to the specific needs of working women experiencing menopause, ultimately contributing to the expansion of the market.
Market Opportunity-Introduction of Natural and Herbal Remedies
Natural and herbal remedies are influencing the Menopause Drugs Market by offering alternative options for managing menopause symptoms. Many women are seeking holistic and non-pharmaceutical approaches to alleviate hot flashes, mood swings, and other discomforts associated with menopause. The market is responding with a range of herbal supplements, plant-based therapies, and traditional remedies that aim to address these concerns. This trend is driven by a growing consumer preference for natural products and a desire to minimize potential side effects often associated with pharmaceutical interventions, thereby diversifying the treatment landscape within the market.
Market Share Analysis- Parenteral Menopause Drugs Market tools will register the fastest growth
The global Menopause Drugs market is analyzed across Parenteral and on-premise types. Of these, - Parenteral is poised to register the fastest growth. Parenteral administration involves delivering drugs directly into the body through methods other than the digestive tract, such as injections or infusions. In the Menopause Drugs Market, parenteral administration could be a delivery method for medications designed to alleviate menopausal symptoms. This approach allows for rapid and precise drug delivery, ensuring that the active compounds are absorbed directly into the bloodstream. Parenteral menopause drugs may include hormone therapies, biologics, or other pharmaceuticals designed to address symptoms like hot flashes, mood swings, and bone health, offering an alternative to oral medications.
Market Share Analysis- Individuals held a significant market share in 2023
The global Menopause Drugs market is analyzed across a wide range of applications including Hospitals, Drugstores, Online Pharmacies, and Specialty Clinics. Of these, individuals held a significant market share in 2023. Drugstores play a significant role in distributing menopause drugs, which are medications designed to alleviate the symptoms associated with menopause. These establishments offer a convenient and accessible channel for individuals to purchase prescription and over-the-counter menopause drugs, including hormone therapies, herbal supplements, and other pharmaceutical treatments. Drugstores often have trained pharmacists who can provide information, guidance, and recommendations to customers seeking relief from menopausal symptoms, contributing to the overall management of women's health during this life stage.
Menopause Drugs Market Segmentation
By Type
- Parenteral
- Transdermal
- Oral
- Nasal
- Topical
By Application
- Hospitals
- Drugstores
- Online Pharmacies
- Specialty Clinics
By Therapy
- Hormone Replacement Therapy
- Non-Hormonal Therapy
- By Drug Class
- Estrogen
- Progestogen
- Combination Drugs
- SSRI
- SNRI
- Gabapentin
- Others
By Region
- North America (United States, Canada, Mexico)
- Europe (Germany, France, United Kingdom, Spain, Italy, Others)
- Asia Pacific (China, India, Japan, South Korea, Australia, Others)
- Latin America (Brazil, Argentina, Others)
- Middle East and Africa (Saudi Arabia, UAE, Kuwait, Other Middle East, South Africa, Nigeria, Other Africa)
Menopause Drugs Market Companies
- Menopause Drugs Market Companies
- Leading companies profiled in the study include-
- AbbVie
- Eli Lilly
- Bayer
- Novo Nordisk
- Abbott
- Merck KGaA
- Mylan
- Pfizer
- Teva
- Novartis
- ANI Pharmaceuticals
- Endo International
- Ipsen
Menopause Drugs Market Outlook 2023
1 Market Overview
1.1 Introduction to the Menopause Drugs Market
1.2 Scope of the Study
1.3 Research Objective
1.3.1 Key Market Scope and Segments
1.3.2 Players Covered
1.3.3 Years Considered
2 Executive Summary
2.1 2023 Menopause Drugs Industry- Market Statistics
3 Market Dynamics
3.1 Market Drivers
3.2 Market Challenges
3.3 Market Opportunities
3.4 Market Trends
4 Market Factor Analysis
4.1 Porter’s Five Forces
4.2 Market Entropy
4.2.1 Global Menopause Drugs Market Companies with Area Served
4.2.2 Products Offerings Global Menopause Drugs Market
5 COVID-19 Impact Analysis and Outlook Scenarios
5.1.1 Covid-19 Impact Analysis
5.1.2 Post-COVID-19 Scenario- Low Growth Case
5.1.3 Post-COVID-19 Scenario- Reference Growth Case
5.1.4 Post-COVID-19 Scenario- Low Growth Case
6 Global Menopause Drugs Market Trends
6.1 Global Menopause Drugs Revenue (USD Million) and CAGR (%) by Type (2018-2030)
6.2 Global Menopause Drugs Revenue (USD Million) and CAGR (%) by Applications (2018-2030)
6.3 Global Menopause Drugs Revenue (USD Million) and CAGR (%) by Regions (2018-2030)
7 Global Menopause Drugs Market Revenue (USD Million) by Type, and Applications (2018-2022)
7.1 Global Menopause Drugs Revenue (USD Million) by Type (2018-2022)
7.1.1 Global Menopause Drugs Revenue (USD Million), Market Share (%) by Type (2018-2022)
7.2 Global Menopause Drugs Revenue (USD Million) by Applications (2018-2022)
7.2.1 Global Menopause Drugs Revenue (USD Million), Market Share (%) by Applications (2018-2022)
8 Global Menopause Drugs Development Regional Status and Outlook
8.1 Global Menopause Drugs Revenue (USD Million) By Regions (2018-2022)
8.2 North America Menopause Drugs Revenue (USD Million) by Type, and Application (2018-2022)
8.2.1 North America Menopause Drugs Revenue (USD Million) by Country (2018-2022)
8.2.2 North America Menopause Drugs Revenue (USD Million) by Type (2018-2022)
8.2.3 North America Menopause Drugs Revenue (USD Million) by Applications (2018-2022)
8.3 Europe Menopause Drugs Revenue (USD Million), by Type, and Applications (USD Million) (2018-2022)
8.3.1 Europe Menopause Drugs Revenue (USD Million), by Country (2018-2022)
8.3.2 Europe Menopause Drugs Revenue (USD Million) by Type (2018-2022)
8.3.3 Europe Menopause Drugs Revenue (USD Million) by Applications (2018-2022)
8.4 Asia Pacific Menopause Drugs Revenue (USD Million), and Revenue (USD Million) by Type, and Applications (2018-2022)
8.4.1 Asia Pacific Menopause Drugs Revenue (USD Million) by Country (2018-2022)
8.4.2 Asia Pacific Menopause Drugs Revenue (USD Million) by Type (2018-2022)
8.4.3 Asia Pacific Menopause Drugs Revenue (USD Million) by Applications (2018-2022)
8.5 South America Menopause Drugs Revenue (USD Million), by Type, and Applications (2018-2022)
8.5.1 South America Menopause Drugs Revenue (USD Million), by Country (2018-2022)
8.5.2 South America Menopause Drugs Revenue (USD Million) by Type (2018-2022)
8.5.3 South America Menopause Drugs Revenue (USD Million) by Applications (2018-2022)
8.6 Middle East and Africa Menopause Drugs Revenue (USD Million), by Type, Technology, Application, Thickness (2018-2022)
8.6.1 Middle East and Africa Menopause Drugs Revenue (USD Million) by Country (2018-2022)
8.6.2 Middle East and Africa Menopause Drugs Revenue (USD Million) by Type (2018-2022)
8.6.3 Middle East and Africa Menopause Drugs Revenue (USD Million) by Applications (2018-2022)
9 Company Profiles
10 Global Menopause Drugs Market Revenue (USD Million), by Type, and Applications (2023-2030)
10.1 Global Menopause Drugs Revenue (USD Million) and Market Share (%) by Type (2023-2030)
10.1.1 Global Menopause Drugs Revenue (USD Million), and Market Share (%) by Type (2023-2030)
10.2 Global Menopause Drugs Revenue (USD Million) and Market Share (%) by Applications (2023-2030)
10.2.1 Global Menopause Drugs Revenue (USD Million), and Market Share (%) by Applications (2023-2030)
11 Global Menopause Drugs Development Regional Status and Outlook Forecast
11.1 Global Menopause Drugs Revenue (USD Million) By Regions (2023-2030)
11.2 North America Menopause Drugs Revenue (USD Million) by Type, and Applications (2023-2030)
11.2.1 North America Menopause Drugs Revenue (USD) Million by Country (2023-2030)
11.2.2 North America Menopause Drugs Revenue (USD Million), by Type (2023-2030)
11.2.3 North America Menopause Drugs Revenue (USD Million), Market Share (%) by Applications (2023-2030)
11.3 Europe Menopause Drugs Revenue (USD Million), by Type, and Applications (2023-2030)
11.3.1 Europe Menopause Drugs Revenue (USD Million), by Country (2023-2030)
11.3.2 Europe Menopause Drugs Revenue (USD Million), by Type (2023-2030)
11.3.3 Europe Menopause Drugs Revenue (USD Million), by Applications (2023-2030)
11.4 Asia Pacific Menopause Drugs Revenue (USD Million) by Type, and Applications (2023-2030)
11.4.1 Asia Pacific Menopause Drugs Revenue (USD Million), by Country (2023-2030)
11.4.2 Asia Pacific Menopause Drugs Revenue (USD Million), by Type (2023-2030)
11.4.3 Asia Pacific Menopause Drugs Revenue (USD Million), by Applications (2023-2030)
11.5 South America Menopause Drugs Revenue (USD Million), by Type, and Applications (2023-2030)
11.5.1 South America Menopause Drugs Revenue (USD Million), by Country (2023-2030)
11.5.2 South America Menopause Drugs Revenue (USD Million), by Type (2023-2030)
11.5.3 South America Menopause Drugs Revenue (USD Million), by Applications (2023-2030)
11.6 Middle East and Africa Menopause Drugs Revenue (USD Million), by Type, and Applications (2023-2030)
11.6.1 Middle East and Africa Menopause Drugs Revenue (USD Million), by Region (2023-2030)
11.6.2 Middle East and Africa Menopause Drugs Revenue (USD Million), by Type (2023-2030)
11.6.3 Middle East and Africa Menopause Drugs Revenue (USD Million), by Applications (2023-2030)
12 Methodology and Data Sources
12.1 Methodology/Research Approach
12.1.1 Research Programs/Design
12.1.2 Market Size Estimation
12.1.3 Market Breakdown and Data Triangulation
12.2 Data Sources
12.2.1 Secondary Sources
12.2.2 Primary Sources
12.3 Disclaimer
List of Tables
Table 1 Market Segmentation Analysis
Table 2 Global Menopause Drugs Market Companies with Areas Served
Table 3 Products Offerings Global Menopause Drugs Market
Table 4 Low Growth Scenario Forecasts
Table 5 Reference Case Growth Scenario
Table 6 High Growth Case Scenario
Table 7 Global Menopause Drugs Revenue (USD Million) And CAGR (%) By Type (2018-2030)
Table 8 Global Menopause Drugs Revenue (USD Million) And CAGR (%) By Applications (2018-2030)
Table 9 Global Menopause Drugs Revenue (USD Million) And CAGR (%) By Regions (2018-2030)
Table 10 Global Menopause Drugs Revenue (USD Million) By Type (2018-2022)
Table 11 Global Menopause Drugs Revenue Market Share (%) By Type (2018-2022)
Table 12 Global Menopause Drugs Revenue (USD Million) By Applications (2018-2022)
Table 13 Global Menopause Drugs Revenue Market Share (%) By Applications (2018-2022)
Table 14 Global Menopause Drugs Market Revenue (USD Million) By Regions (2018-2022)
Table 15 Global Menopause Drugs Market Share (%) By Regions (2018-2022)
Table 16 North America Menopause Drugs Revenue (USD Million) By Country (2018-2022)
Table 17 North America Menopause Drugs Revenue (USD Million) By Type (2018-2022)
Table 18 North America Menopause Drugs Revenue (USD Million) By Applications (2018-2022)
Table 19 Europe Menopause Drugs Revenue (USD Million) By Country (2018-2022)
Table 20 Europe Menopause Drugs Revenue (USD Million) By Type (2018-2022)
Table 21 Europe Menopause Drugs Revenue (USD Million) By Applications (2018-2022)
Table 22 Asia Pacific Menopause Drugs Revenue (USD Million) By Country (2018-2022)
Table 23 Asia Pacific Menopause Drugs Revenue (USD Million) By Type (2018-2022)
Table 24 Asia Pacific Menopause Drugs Revenue (USD Million) By Applications (2018-2022)
Table 25 South America Menopause Drugs Revenue (USD Million) By Country (2018-2022)
Table 26 South America Menopause Drugs Revenue (USD Million) By Type (2018-2022)
Table 27 South America Menopause Drugs Revenue (USD Million) By Applications (2018-2022)
Table 28 Middle East and Africa Menopause Drugs Revenue (USD Million) By Region (2018-2022)
Table 29 Middle East and Africa Menopause Drugs Revenue (USD Million) By Type (2018-2022)
Table 30 Middle East and Africa Menopause Drugs Revenue (USD Million) By Applications (2018-2022)
Table 31 Financial Analysis
Table 32 Global Menopause Drugs Revenue (USD Million) By Type (2023-2030)
Table 33 Global Menopause Drugs Revenue Market Share (%) By Type (2023-2030)
Table 34 Global Menopause Drugs Revenue (USD Million) By Applications (2023-2030)
Table 35 Global Menopause Drugs Revenue Market Share (%) By Applications (2023-2030)
Table 36 Global Menopause Drugs Market Revenue (USD Million), And Revenue (USD Million) By Regions (2023-2030)
Table 37 North America Menopause Drugs Revenue (USD)By Country (2023-2030)
Table 38 North America Menopause Drugs Revenue (USD Million) By Type (2023-2030)
Table 39 North America Menopause Drugs Revenue (USD Million) By Applications (2023-2030)
Table 40 Europe Menopause Drugs Revenue (USD Million) By Country (2023-2030)
Table 41 Europe Menopause Drugs Revenue (USD Million) By Type (2023-2030)
Table 42 Europe Menopause Drugs Revenue (USD Million) By Applications (2023-2030)
Table 43 Asia Pacific Menopause Drugs Revenue (USD Million) By Country (2023-2030)
Table 44 Asia Pacific Menopause Drugs Revenue (USD Million) By Type (2023-2030)
Table 45 Asia Pacific Menopause Drugs Revenue (USD Million) By Applications (2023-2030)
Table 46 South America Menopause Drugs Revenue (USD Million) By Country (2023-2030)
Table 47 South America Menopause Drugs Revenue (USD Million) By Type (2023-2030)
Table 48 South America Menopause Drugs Revenue (USD Million) By Applications (2023-2030)
Table 49 Middle East and Africa Menopause Drugs Revenue (USD Million) By Region (2023-2030)
Table 50 Middle East and Africa Menopause Drugs Revenue (USD Million) By Region (2023-2030)
Table 51 Middle East and Africa Menopause Drugs Revenue (USD Million) By Type (2023-2030)
Table 52 Middle East and Africa Menopause Drugs Revenue (USD Million) By Applications (2023-2030)
Table 53 Research Programs/Design for This Report
Table 54 Key Data Information from Secondary Sources
Table 55 Key Data Information from Primary Sources
List of Figures
Figure 1 Market Scope
Figure 2 Porter’s Five Forces
Figure 3 Global Menopause Drugs Revenue (USD Million) By Type (2018-2022)
Figure 4 Global Menopause Drugs Revenue Market Share (%) By Type (2022)
Figure 5 Global Menopause Drugs Revenue (USD Million) By Applications (2018-2022)
Figure 6 Global Menopause Drugs Revenue Market Share (%) By Applications (2022)
Figure 7 Global Menopause Drugs Market Revenue (USD Million) By Regions (2018-2022)
Figure 8 Global Menopause Drugs Market Share (%) By Regions (2022)
Figure 9 North America Menopause Drugs Revenue (USD Million) By Country (2018-2022)
Figure 10 North America Menopause Drugs Revenue (USD Million) By Type (2018-2022)
Figure 11 North America Menopause Drugs Revenue (USD Million) By Applications (2018-2022)
Figure 12 Europe Menopause Drugs Revenue (USD Million) By Country (2018-2022)
Figure 13 Europe Menopause Drugs Revenue (USD Million) By Type (2018-2022)
Figure 14 Europe Menopause Drugs Revenue (USD Million) By Applications (2018-2022)
Figure 15 Asia Pacific Menopause Drugs Revenue (USD Million) By Country (2018-2022)
Figure 16 Asia Pacific Menopause Drugs Revenue (USD Million) By Type (2018-2022)
Figure 17 Asia Pacific Menopause Drugs Revenue (USD Million) By Applications (2018-2022)
Figure 18 South America Menopause Drugs Revenue (USD Million) By Country (2018-2022)
Figure 19 South America Menopause Drugs Revenue (USD Million) By Type (2018-2022)
Figure 20 South America Menopause Drugs Revenue (USD Million) By Applications (2018-2022)
Figure 21 Middle East and Africa Menopause Drugs Revenue (USD Million) By Region (2018-2022)
Figure 22 Middle East and Africa Menopause Drugs Revenue (USD Million) By Type (2018-2022)
Figure 23 Middle East and Africa Menopause Drugs Revenue (USD Million) By Applications (2018-2022)
Figure 24 Global Menopause Drugs Revenue (USD Million) By Type (2023-2030)
Figure 25 Global Menopause Drugs Revenue Market Share (%) By Type (2030)
Figure 26 Global Menopause Drugs Revenue (USD Million) By Applications (2023-2030)
Figure 27 Global Menopause Drugs Revenue Market Share (%) By Applications (2030)
Figure 28 Global Menopause Drugs Market Revenue (USD Million) By Regions (2023-2030)
Figure 29 North America Menopause Drugs Revenue (USD Million) By Country (2023-2030)
Figure 30 North America Menopause Drugs Revenue (USD Million) By Type (2023-2030)
Figure 31 North America Menopause Drugs Revenue (USD Million) By Applications (2023-2030)
Figure 32 Europe Menopause Drugs Revenue (USD Million) By Country (2023-2030)
Figure 33 Europe Menopause Drugs Revenue (USD Million) By Type (2023-2030)
Figure 34 Europe Menopause Drugs Revenue (USD Million) By Applications (2023-2030)
Figure 35 Asia Pacific Menopause Drugs Revenue (USD Million) By Country (2023-2030)
Figure 36 Asia Pacific Menopause Drugs Revenue (USD Million) By Type (2023-2030)
Figure 37 Asia Pacific Menopause Drugs Revenue (USD Million) By Applications (2023-2030)
Figure 38 South America Menopause Drugs Revenue (USD Million) By Country (2023-2030)
Figure 39 South America Menopause Drugs Revenue (USD Million) By Type (2023-2030)
Figure 40 South America Menopause Drugs Revenue (USD Million) By Applications (2023-2030)
Figure 41 Middle East and Africa Menopause Drugs Revenue (USD Million) By Region (2023-2030)
Figure 42 Middle East and Africa Menopause Drugs Revenue (USD Million) By Region (2023-2030)
Figure 43 Middle East and Africa Menopause Drugs Revenue (USD Million) By Type (2023-2030)
Figure 44 Middle East and Africa Menopause Drugs Revenue (USD Million) By Applications (2023-2030)
Figure 45 Bottom-Up and Top-Down Approaches For This Report
Figure 46 Data Triangulation
