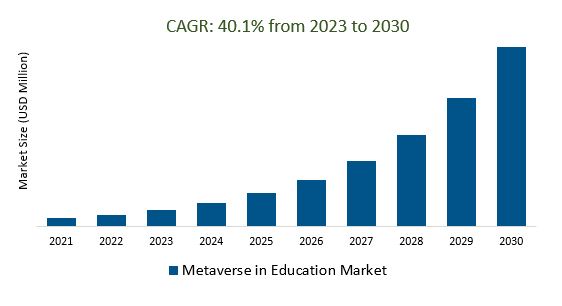
The global Metaverse in Education Market Size is estimated to register 40.1% growth over the forecast period from 2023 to 2030.
The metaverse offers immersive and interactive learning experiences that engage students on a deeper level, encouraging sales growth across end-user categories. It enables students from around the world to collaborate and engage in shared virtual environments. Further, Metaverse technologies can adapt content and activities based on individual student needs and learning styles, providing personalized learning paths. Applications such as the development of skills like creativity, collaboration, critical thinking, and digital literacy are witnessing robust demand across the industry.
Key market trends including the growing preference for Virtual classrooms within the metaverse, the creation of virtual labs, Social Learning Spaces, and gamified learning within the metaverse are widely observed. In addition to guest speakers and experts, educators are using the metaverse for professional development by attending virtual conferences, workshops, and training sessions. The ability to revolutionize the way students learn and educators teach by providing immersive and interactive learning environments coupled with ease of market penetration is set to drive a robust market outlook in 2023 and beyond.
Market Dynamics
Augmented Reality (AR) and Virtual Reality (VR) integration in the Metaverse for education offers immersive, interactive, and multi-sensory learning experiences, enabling students to explore virtual worlds, simulations, and 3D models, while also facilitating collaborative learning, teacher training, and global collaboration. It enhances engagement, accessibility, and cost savings, making it a transformative tool for personalized and effective education within the Metaverse.
Market Driver- Personalized Education demand for efficient Metaverse in Education Market
Personalized education in the Metaverse employs data-driven AI algorithms to customize learning experiences for individual students, optimizing their comprehension and retention through adaptive content delivery and targeted support. It empowers both students and educators, fostering self-directed learning and data-informed instructional decisions, ultimately elevating the quality of education in the Metaverse.
Market Opportunity-Introduction of Personalized Education
Personalized education in the Metaverse education market harnesses AI and data analytics to tailor learning experiences to individual students, optimizing comprehension and retention. It offers adaptive content delivery, targeted support, and fosters self-directed learning, benefiting both students and educators. This approach enhances the overall quality of education within the Metaverse.
Market Share Analysis- Hardware Metaverse in Education Market will register the fastest growth.
The global Metaverse in Education Market is analyzed across, Hardware, Software, and others. Of these, Hardware is poised to register the fastest growth. Hardware in the Metaverse education market encompasses VR headsets, AR devices, PCs, mobile devices, motion controllers, sensors, haptic feedback devices, audio equipment, networking infrastructure, storage solutions, interactive whiteboards, 3D printers, gaming consoles, wearable health tech, security systems, and blockchain infrastructure, all serving to facilitate immersive and interactive learning experiences while connecting students and educators to the Metaverse, each with specific roles in enhancing education.
Market Share Analysis- Academic held a significant market share in 2023
The global Metaverse in Education Market is analyzed across a wide range of End users including Academic, Corporate, and others. Of these, Academic held a significant market share in 2023. Academic institutions and professionals are central to the Metaverse education market, providing educational content, expertise, and curriculum development. They enable immersive learning experiences, expand educational offerings, and guide students within virtual environments. Academic researchers and developers contribute to technology advancements, ensuring the ongoing evolution and effectiveness of Metaverse-based education.
Metaverse in Education Market Segmentation
By Type
By End-User
By Region
- North America (United States, Canada, Mexico)
- Europe (Germany, France, United Kingdom, Spain, Italy, Others)
- Asia Pacific (China, India, Japan, South Korea, Australia, Others)
- Latin America (Brazil, Argentina, Others)
- Middle East and Africa (Saudi Arabia, UAE, Kuwait, Other Middle East, South Africa, Nigeria, Other Africa)
Metaverse in Education Market companies
- Adobe Inc
- Microsoft Corporation
- Unity Software Inc
- Meta Platforms, Inc
- HP Inc
- Samsung Electronics
- Roblox Corporation
- Lenovo
- Epic Games
- Baidu Inc
* List not exhaustive
Metaverse in Education Market Outlook 2023
1 Market Overview
1.1 Introduction to the Metaverse in Education Market
1.2 Scope of the Study
1.3 Research Objective
1.3.1 Key Market Scope and Segments
1.3.2 Players Covered
1.3.3 Years Considered
2 Executive Summary
2.1 2023 Metaverse in Education Industry- Market Statistics
3 Market Dynamics
3.1 Market Drivers
3.2 Market Challenges
3.3 Market Opportunities
3.4 Market Trends
4 Market Factor Analysis
4.1 Porter’s Five Forces
4.2 Market Entropy
4.2.1 Global Metaverse in Education Market Companies with Area Served
4.2.2 Products Offerings Global Metaverse in Education Market
5 COVID-19 Impact Analysis and Outlook Scenarios
5.1.1 Covid-19 Impact Analysis
5.1.2 Post-COVID-19 Scenario- Low Growth Case
5.1.3 Post-COVID-19 Scenario- Reference Growth Case
5.1.4 Post-COVID-19 Scenario- Low Growth Case
6 Global Metaverse in Education Market Trends
6.1 Global Metaverse in Education Revenue (USD Million) and CAGR (%) by Type (2018-2030)
6.2 Global Metaverse in Education Revenue (USD Million) and CAGR (%) by Applications (2018-2030)
6.3 Global Metaverse in Education Revenue (USD Million) and CAGR (%) by Regions (2018-2030)
7 Global Metaverse in Education Market Revenue (USD Million) by Type, and Applications (2018-2022)
7.1 Global Metaverse in Education Revenue (USD Million) by Type (2018-2022)
7.1.1 Global Metaverse in Education Revenue (USD Million), Market Share (%) by Type (2018-2022)
7.2 Global Metaverse in Education Revenue (USD Million) by Applications (2018-2022)
7.2.1 Global Metaverse in Education Revenue (USD Million), Market Share (%) by Applications (2018-2022)
8 Global Metaverse in Education Development Regional Status and Outlook
8.1 Global Metaverse in Education Revenue (USD Million) By Regions (2018-2022)
8.2 North America Metaverse in Education Revenue (USD Million) by Type, and Application (2018-2022)
8.2.1 North America Metaverse in Education Revenue (USD Million) by Country (2018-2022)
8.2.2 North America Metaverse in Education Revenue (USD Million) by Type (2018-2022)
8.2.3 North America Metaverse in Education Revenue (USD Million) by Applications (2018-2022)
8.3 Europe Metaverse in Education Revenue (USD Million), by Type, and Applications (USD Million) (2018-2022)
8.3.1 Europe Metaverse in Education Revenue (USD Million), by Country (2018-2022)
8.3.2 Europe Metaverse in Education Revenue (USD Million) by Type (2018-2022)
8.3.3 Europe Metaverse in Education Revenue (USD Million) by Applications (2018-2022)
8.4 Asia Pacific Metaverse in Education Revenue (USD Million), and Revenue (USD Million) by Type, and Applications (2018-2022)
8.4.1 Asia Pacific Metaverse in Education Revenue (USD Million) by Country (2018-2022)
8.4.2 Asia Pacific Metaverse in Education Revenue (USD Million) by Type (2018-2022)
8.4.3 Asia Pacific Metaverse in Education Revenue (USD Million) by Applications (2018-2022)
8.5 South America Metaverse in Education Revenue (USD Million), by Type, and Applications (2018-2022)
8.5.1 South America Metaverse in Education Revenue (USD Million), by Country (2018-2022)
8.5.2 South America Metaverse in Education Revenue (USD Million) by Type (2018-2022)
8.5.3 South America Metaverse in Education Revenue (USD Million) by Applications (2018-2022)
8.6 Middle East and Africa Metaverse in Education Revenue (USD Million), by Type, Technology, Application, Thickness (2018-2022)
8.6.1 Middle East and Africa Metaverse in Education Revenue (USD Million) by Country (2018-2022)
8.6.2 Middle East and Africa Metaverse in Education Revenue (USD Million) by Type (2018-2022)
8.6.3 Middle East and Africa Metaverse in Education Revenue (USD Million) by Applications (2018-2022)
9 Company Profiles
10 Global Metaverse in Education Market Revenue (USD Million), by Type, and Applications (2023-2030)
10.1 Global Metaverse in Education Revenue (USD Million) and Market Share (%) by Type (2023-2030)
10.1.1 Global Metaverse in Education Revenue (USD Million), and Market Share (%) by Type (2023-2030)
10.2 Global Metaverse in Education Revenue (USD Million) and Market Share (%) by Applications (2023-2030)
10.2.1 Global Metaverse in Education Revenue (USD Million), and Market Share (%) by Applications (2023-2030)
11 Global Metaverse in Education Development Regional Status and Outlook Forecast
11.1 Global Metaverse in Education Revenue (USD Million) By Regions (2023-2030)
11.2 North America Metaverse in Education Revenue (USD Million) by Type, and Applications (2023-2030)
11.2.1 North America Metaverse in Education Revenue (USD) Million by Country (2023-2030)
11.2.2 North America Metaverse in Education Revenue (USD Million), by Type (2023-2030)
11.2.3 North America Metaverse in Education Revenue (USD Million), Market Share (%) by Applications (2023-2030)
11.3 Europe Metaverse in Education Revenue (USD Million), by Type, and Applications (2023-2030)
11.3.1 Europe Metaverse in Education Revenue (USD Million), by Country (2023-2030)
11.3.2 Europe Metaverse in Education Revenue (USD Million), by Type (2023-2030)
11.3.3 Europe Metaverse in Education Revenue (USD Million), by Applications (2023-2030)
11.4 Asia Pacific Metaverse in Education Revenue (USD Million) by Type, and Applications (2023-2030)
11.4.1 Asia Pacific Metaverse in Education Revenue (USD Million), by Country (2023-2030)
11.4.2 Asia Pacific Metaverse in Education Revenue (USD Million), by Type (2023-2030)
11.4.3 Asia Pacific Metaverse in Education Revenue (USD Million), by Applications (2023-2030)
11.5 South America Metaverse in Education Revenue (USD Million), by Type, and Applications (2023-2030)
11.5.1 South America Metaverse in Education Revenue (USD Million), by Country (2023-2030)
11.5.2 South America Metaverse in Education Revenue (USD Million), by Type (2023-2030)
11.5.3 South America Metaverse in Education Revenue (USD Million), by Applications (2023-2030)
11.6 Middle East and Africa Metaverse in Education Revenue (USD Million), by Type, and Applications (2023-2030)
11.6.1 Middle East and Africa Metaverse in Education Revenue (USD Million), by Region (2023-2030)
11.6.2 Middle East and Africa Metaverse in Education Revenue (USD Million), by Type (2023-2030)
11.6.3 Middle East and Africa Metaverse in Education Revenue (USD Million), by Applications (2023-2030)
12 Methodology and Data Sources
12.1 Methodology/Research Approach
12.1.1 Research Programs/Design
12.1.2 Market Size Estimation
12.1.3 Market Breakdown and Data Triangulation
12.2 Data Sources
12.2.1 Secondary Sources
12.2.2 Primary Sources
12.3 Disclaimer
List of Tables
Table 1 Market Segmentation Analysis
Table 2 Global Metaverse in Education Market Companies with Areas Served
Table 3 Products Offerings Global Metaverse in Education Market
Table 4 Low Growth Scenario Forecasts
Table 5 Reference Case Growth Scenario
Table 6 High Growth Case Scenario
Table 7 Global Metaverse in Education Revenue (USD Million) And CAGR (%) By Type (2018-2030)
Table 8 Global Metaverse in Education Revenue (USD Million) And CAGR (%) By Applications (2018-2030)
Table 9 Global Metaverse in Education Revenue (USD Million) And CAGR (%) By Regions (2018-2030)
Table 10 Global Metaverse in Education Revenue (USD Million) By Type (2018-2022)
Table 11 Global Metaverse in Education Revenue Market Share (%) By Type (2018-2022)
Table 12 Global Metaverse in Education Revenue (USD Million) By Applications (2018-2022)
Table 13 Global Metaverse in Education Revenue Market Share (%) By Applications (2018-2022)
Table 14 Global Metaverse in Education Market Revenue (USD Million) By Regions (2018-2022)
Table 15 Global Metaverse in Education Market Share (%) By Regions (2018-2022)
Table 16 North America Metaverse in Education Revenue (USD Million) By Country (2018-2022)
Table 17 North America Metaverse in Education Revenue (USD Million) By Type (2018-2022)
Table 18 North America Metaverse in Education Revenue (USD Million) By Applications (2018-2022)
Table 19 Europe Metaverse in Education Revenue (USD Million) By Country (2018-2022)
Table 20 Europe Metaverse in Education Revenue (USD Million) By Type (2018-2022)
Table 21 Europe Metaverse in Education Revenue (USD Million) By Applications (2018-2022)
Table 22 Asia Pacific Metaverse in Education Revenue (USD Million) By Country (2018-2022)
Table 23 Asia Pacific Metaverse in Education Revenue (USD Million) By Type (2018-2022)
Table 24 Asia Pacific Metaverse in Education Revenue (USD Million) By Applications (2018-2022)
Table 25 South America Metaverse in Education Revenue (USD Million) By Country (2018-2022)
Table 26 South America Metaverse in Education Revenue (USD Million) By Type (2018-2022)
Table 27 South America Metaverse in Education Revenue (USD Million) By Applications (2018-2022)
Table 28 Middle East and Africa Metaverse in Education Revenue (USD Million) By Region (2018-2022)
Table 29 Middle East and Africa Metaverse in Education Revenue (USD Million) By Type (2018-2022)
Table 30 Middle East and Africa Metaverse in Education Revenue (USD Million) By Applications (2018-2022)
Table 31 Financial Analysis
Table 32 Global Metaverse in Education Revenue (USD Million) By Type (2023-2030)
Table 33 Global Metaverse in Education Revenue Market Share (%) By Type (2023-2030)
Table 34 Global Metaverse in Education Revenue (USD Million) By Applications (2023-2030)
Table 35 Global Metaverse in Education Revenue Market Share (%) By Applications (2023-2030)
Table 36 Global Metaverse in Education Market Revenue (USD Million), And Revenue (USD Million) By Regions (2023-2030)
Table 37 North America Metaverse in Education Revenue (USD)By Country (2023-2030)
Table 38 North America Metaverse in Education Revenue (USD Million) By Type (2023-2030)
Table 39 North America Metaverse in Education Revenue (USD Million) By Applications (2023-2030)
Table 40 Europe Metaverse in Education Revenue (USD Million) By Country (2023-2030)
Table 41 Europe Metaverse in Education Revenue (USD Million) By Type (2023-2030)
Table 42 Europe Metaverse in Education Revenue (USD Million) By Applications (2023-2030)
Table 43 Asia Pacific Metaverse in Education Revenue (USD Million) By Country (2023-2030)
Table 44 Asia Pacific Metaverse in Education Revenue (USD Million) By Type (2023-2030)
Table 45 Asia Pacific Metaverse in Education Revenue (USD Million) By Applications (2023-2030)
Table 46 South America Metaverse in Education Revenue (USD Million) By Country (2023-2030)
Table 47 South America Metaverse in Education Revenue (USD Million) By Type (2023-2030)
Table 48 South America Metaverse in Education Revenue (USD Million) By Applications (2023-2030)
Table 49 Middle East and Africa Metaverse in Education Revenue (USD Million) By Region (2023-2030)
Table 50 Middle East and Africa Metaverse in Education Revenue (USD Million) By Region (2023-2030)
Table 51 Middle East and Africa Metaverse in Education Revenue (USD Million) By Type (2023-2030)
Table 52 Middle East and Africa Metaverse in Education Revenue (USD Million) By Applications (2023-2030)
Table 53 Research Programs/Design for This Report
Table 54 Key Data Information from Secondary Sources
Table 55 Key Data Information from Primary Sources
List of Figures
Figure 1 Market Scope
Figure 2 Porter’s Five Forces
Figure 3 Global Metaverse in Education Revenue (USD Million) By Type (2018-2022)
Figure 4 Global Metaverse in Education Revenue Market Share (%) By Type (2022)
Figure 5 Global Metaverse in Education Revenue (USD Million) By Applications (2018-2022)
Figure 6 Global Metaverse in Education Revenue Market Share (%) By Applications (2022)
Figure 7 Global Metaverse in Education Market Revenue (USD Million) By Regions (2018-2022)
Figure 8 Global Metaverse in Education Market Share (%) By Regions (2022)
Figure 9 North America Metaverse in Education Revenue (USD Million) By Country (2018-2022)
Figure 10 North America Metaverse in Education Revenue (USD Million) By Type (2018-2022)
Figure 11 North America Metaverse in Education Revenue (USD Million) By Applications (2018-2022)
Figure 12 Europe Metaverse in Education Revenue (USD Million) By Country (2018-2022)
Figure 13 Europe Metaverse in Education Revenue (USD Million) By Type (2018-2022)
Figure 14 Europe Metaverse in Education Revenue (USD Million) By Applications (2018-2022)
Figure 15 Asia Pacific Metaverse in Education Revenue (USD Million) By Country (2018-2022)
Figure 16 Asia Pacific Metaverse in Education Revenue (USD Million) By Type (2018-2022)
Figure 17 Asia Pacific Metaverse in Education Revenue (USD Million) By Applications (2018-2022)
Figure 18 South America Metaverse in Education Revenue (USD Million) By Country (2018-2022)
Figure 19 South America Metaverse in Education Revenue (USD Million) By Type (2018-2022)
Figure 20 South America Metaverse in Education Revenue (USD Million) By Applications (2018-2022)
Figure 21 Middle East and Africa Metaverse in Education Revenue (USD Million) By Region (2018-2022)
Figure 22 Middle East and Africa Metaverse in Education Revenue (USD Million) By Type (2018-2022)
Figure 23 Middle East and Africa Metaverse in Education Revenue (USD Million) By Applications (2018-2022)
Figure 24 Global Metaverse in Education Revenue (USD Million) By Type (2023-2030)
Figure 25 Global Metaverse in Education Revenue Market Share (%) By Type (2030)
Figure 26 Global Metaverse in Education Revenue (USD Million) By Applications (2023-2030)
Figure 27 Global Metaverse in Education Revenue Market Share (%) By Applications (2030)
Figure 28 Global Metaverse in Education Market Revenue (USD Million) By Regions (2023-2030)
Figure 29 North America Metaverse in Education Revenue (USD Million) By Country (2023-2030)
Figure 30 North America Metaverse in Education Revenue (USD Million) By Type (2023-2030)
Figure 31 North America Metaverse in Education Revenue (USD Million) By Applications (2023-2030)
Figure 32 Europe Metaverse in Education Revenue (USD Million) By Country (2023-2030)
Figure 33 Europe Metaverse in Education Revenue (USD Million) By Type (2023-2030)
Figure 34 Europe Metaverse in Education Revenue (USD Million) By Applications (2023-2030)
Figure 35 Asia Pacific Metaverse in Education Revenue (USD Million) By Country (2023-2030)
Figure 36 Asia Pacific Metaverse in Education Revenue (USD Million) By Type (2023-2030)
Figure 37 Asia Pacific Metaverse in Education Revenue (USD Million) By Applications (2023-2030)
Figure 38 South America Metaverse in Education Revenue (USD Million) By Country (2023-2030)
Figure 39 South America Metaverse in Education Revenue (USD Million) By Type (2023-2030)
Figure 40 South America Metaverse in Education Revenue (USD Million) By Applications (2023-2030)
Figure 41 Middle East and Africa Metaverse in Education Revenue (USD Million) By Region (2023-2030)
Figure 42 Middle East and Africa Metaverse in Education Revenue (USD Million) By Region (2023-2030)
Figure 43 Middle East and Africa Metaverse in Education Revenue (USD Million) By Type (2023-2030)
Figure 44 Middle East and Africa Metaverse in Education Revenue (USD Million) By Applications (2023-2030)
Figure 45 Bottom-Up and Top-Down Approaches For This Report
Figure 46 Data Triangulation
