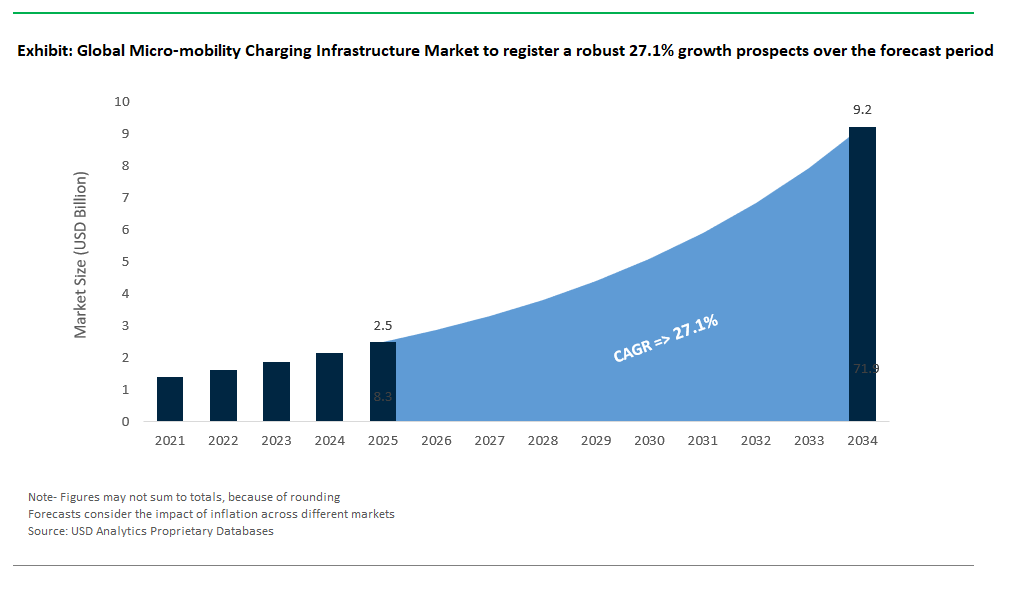
The Global Micro-mobility Charging Infrastructure Market Size is estimated at $8.3 Billion in 2025 and is forecast to register an annual growth rate (CAGR) of 27.1% to reach $71.5 Billion by 2034.
The global Micro-mobility Charging Infrastructure Market Study analyzes and forecasts the market size across 6 regions and 24 countries for diverse segments -By Vehicle (E-scooters, E-bikes, E-unicycles, E-skateboards), By Charger (Wired, Wireless), By Power Source (Solar Powered, Battery Powered), By End-User (Commercial, Residential).
An Introduction to Micro-mobility Charging Infrastructure Market in 2025
The micro-mobility charging infrastructure market is witnessing robust growth as urban areas increasingly adopt electric scooters, bikes, and other small, sustainable transportation options. With the rise in popularity of these micro-mobility solutions, there is a parallel surge in demand for efficient, accessible, and scalable charging infrastructure. This market encompasses various elements such as charging stations, smart grid integration, and innovative power management systems designed to support the expanding fleet of electric micro-mobility vehicles. The shift towards micro-mobility is driven by the need for reduced traffic congestion, lower carbon emissions, and enhanced urban mobility. As cities invest in infrastructure to support these eco-friendly transportation options, the micro-mobility charging infrastructure market is poised for significant growth, propelled by advancements in technology and increased consumer adoption.
Micro-mobility Charging Infrastructure Competitive Landscape
The market report analyses the leading companies in the industry including Ather Energy, bike-energy, Bikeep, Flower Turbines, Get Charged Inc, Giulio Barbieri SRL, Ground Control Systems, Magment, Perch Mobility, Robert Bosch GmbH, Solum, SWIFTMILE, The Mobility House GmbH, and others.
Micro-mobility Charging Infrastructure Market Dynamics
Market Trend: Growth of Charging Hubs and Network Expansion
A significant trend in the micro mobility charging infrastructure market is the growth of charging hubs and network expansion. As micro mobility solutions like e-scooters and e-bikes become more prevalent in urban areas, the need for widespread and accessible charging infrastructure is increasing. Companies are investing in establishing dedicated charging hubs and expanding their networks to support the growing fleet of electric micro mobility vehicles. These hubs not only provide convenient charging options but also facilitate the management of charging logistics and data collection. The trend towards creating extensive charging networks reflects a broader effort to support the sustainable growth of micro mobility services and enhance user convenience.
Market Driver: Surge in Micro Mobility Usage and Urban Mobility Solutions
The surge in micro mobility usage and the push for urban mobility solutions are key drivers of the micro mobility charging infrastructure market. As cities face challenges related to traffic congestion and pollution, there is a growing adoption of e-scooters, e-bikes, and other electric micro mobility options as alternatives to traditional transportation. This increase in usage drives the demand for adequate and efficient charging infrastructure to support these vehicles. Urban planners and service providers are investing in charging solutions to ensure that micro mobility options are reliable and accessible, thus contributing to the growth of the market.
Market Opportunity: Integration with Smart City Technologies
An opportunity in the micro mobility charging infrastructure market lies in the integration with smart city technologies. By incorporating IoT (Internet of Things) capabilities, real-time data analytics, and automated systems, charging infrastructure can be optimized for efficiency and user convenience. Smart charging solutions can provide features such as dynamic pricing, predictive maintenance, and integrated payment systems. This integration not only enhances the functionality of charging stations but also aligns with broader smart city initiatives aimed at improving urban mobility and sustainability. Companies that develop and deploy advanced, technology-driven charging solutions can tap into the expanding market and support the evolving needs of urban transportation systems.
Micro mobility Charging Infrastructure Market Share Analysis: E-Scooters generated the highest revenue in 2024
In the Micro Mobility Charging Infrastructure Market, e-scooters represent the largest segment due to their widespread adoption and popularity among urban commuters. E-scooters are favored for their convenience, affordability, and efficiency in short-distance travel, making them a common choice for both personal use and shared mobility services. The infrastructure required to support e-scooters includes a significant number of dedicated charging stations, which drives the market demand for such facilities. The large volume of e-scooter deployments and the ongoing expansion of scooter-sharing programs contribute to the dominance of e-scooters in this market segment. This widespread use necessitates a robust charging infrastructure, solidifying e-scooters as the largest vehicle type in the micro mobility charging sector.
Micro mobility Charging Infrastructure Market Share Analysis: Wireless Chargers is poised to register the fastest CAGR over the forecast period
Within the Micro Mobility Charging Infrastructure Market, wireless chargers are the fastest-growing segment due to their advanced technology and user convenience. Wireless charging solutions offer significant advantages over traditional wired chargers, including ease of use, reduced wear and tear on physical connectors, and enhanced durability. The increasing adoption of wireless charging technology is driven by the desire for seamless and efficient charging experiences for micro mobility vehicles such as e-scooters and e-bikes. As technology advances and infrastructure develops to support these systems, the demand for wireless chargers is expected to grow rapidly, making it the fastest-growing segment in the market.
Micro mobility Charging Infrastructure Market Share Analysis: Solar Powered generated the highest revenue in 2024
In the Micro Mobility Charging Infrastructure Market, solar-powered charging solutions are the largest segment due to their sustainability and energy efficiency. Solar-powered chargers harness renewable energy to provide a green alternative for charging micro mobility vehicles, aligning with the broader trend towards eco-friendly transportation solutions. The extensive deployment of solar panels in various urban environments and their integration into existing infrastructure support the significant market presence of solar-powered chargers. The benefits of reducing dependence on grid electricity and lowering operational costs further contribute to the prominence of solar-powered solutions in the micro mobility charging infrastructure market.
Micro mobility Charging Infrastructure Market Share Analysis: Commercial is poised to register the fastest CAGR over the forecast period
In the Micro Mobility Charging Infrastructure Market, the commercial segment is the fastest-growing due to the expanding adoption of micro mobility solutions by businesses and public services. Commercial entities, including rental companies, logistics providers, and public transportation authorities, are increasingly investing in micro mobility fleets and the necessary charging infrastructure to support them. The growth in this segment is driven by the increasing demand for shared mobility services, the need for efficient urban transportation solutions, and the potential for reduced operational costs through the deployment of micro mobility vehicles. As commercial investments in micro mobility infrastructure accelerate, this segment is experiencing rapid expansion, making it the fastest-growing end-user category in the market.
Micro-mobility Charging Infrastructure Market Report Scope
|
Parameter
|
Details
|
|
Market Size (2025)
|
$ 8.3 Billion
|
|
Market Size (2034)
|
$ 71.5 Billion
|
|
Market Growth Rate
|
27.1%
|
|
Segments
|
By Vehicle (E-scooters, E-bikes, E-unicycles, E-skateboards), By Charger (Wired, Wireless), By Power Source (Solar Powered, Battery Powered), By End-User (Commercial, Residential)
|
|
Study Period
|
2019- 2024 and 2025-2034
|
|
Units
|
Revenue (USD)
|
|
Qualitative Analysis
|
Porter’s Five Forces, SWOT Profile, Market Share, Scenario Forecasts, Market Ecosystem, Company Ranking, Market Dynamics, Industry Benchmarking
|
|
Companies
|
Ather Energy, bike-energy, Bikeep, Flower Turbines, Get Charged Inc, Giulio Barbieri SRL, Ground Control Systems, Magment, Perch Mobility, Robert Bosch GmbH, Solum, SWIFTMILE, The Mobility House GmbH
|
|
Countries
|
US, Canada, Mexico, Germany, France, Spain, Italy, UK, Russia, China, India, Japan, South Korea, Australia, South East Asia, Brazil, Argentina, Middle East, Africa
|
Micro-mobility Charging Infrastructure Market Segmentation
By Vehicle
E-scooters
E-bikes
E-unicycles
E-skateboards
By Charger
Wired
Wireless
By Power Source
Solar Powered
Battery Powered
By End-User
Commercial
Residential
Countries Analyzed
North America (US, Canada, Mexico)
Europe (Germany, UK, France, Spain, Italy, Russia, Rest of Europe)
Asia Pacific (China, India, Japan, South Korea, Australia, South East Asia, Rest of Asia)
South America (Brazil, Argentina, Rest of South America)
Middle East and Africa (Saudi Arabia, UAE, Rest of Middle East, South Africa, Egypt, Rest of Africa)
Micro-mobility Charging Infrastructure Companies Profiled in the Study
Ather Energy
bike-energy
Bikeep
Flower Turbines
Get Charged Inc
Giulio Barbieri SRL
Ground Control Systems
Magment
Perch Mobility
Robert Bosch GmbH
Solum
SWIFTMILE
The Mobility House GmbH
*- List Not Exhaustive
About USD Analytics
Table of Contents
List of Charts and Exhibits
List of Tables
1. Executive Summary
What’s New in 2025?
Top 10 Takeaways from the industry
Potential Opportunities for Industry Stakeholders
Strategic Imperatives
Company Market Positioning
Industry Benchmarking Matrix
2. Research Scope and Methodology
Market Definition
Market Segments
Companies Profiled
Research Methodology
Bottom-Up Method
Top-Down Method
Data Triangulation
Forecast Methodology
Data Sources
USDA Proprietary Databases
External Sources
Primary Research and Interviews
Conversion Rates for USD
Abbreviations
3. Strategic Landscape: Key Insights and Implications
Spotlight: Key Strategies opted by Business Leaders
Competitive Landscape
Market Size ($ Million) and Share (%) by Company, 2024
SWOT Analysis
- Key Market Strengths
- Key Market Weaknesses
- Potential Opportunities
- Potential Threats
Porter’s Five Force Analysis
- Summary
- Bargaining Power of Buyers- Impact Analysis
- Bargaining Power of Suppliers- Impact Analysis
- Threat of new entrants- Impact Analysis
- Intensity of Competitive Rivalry- Impact Analysis
Macro-Environmental Analysis
- Economic forecasts by Country, 2010- 2035
- Population forecasts by Country, 2010- 2035
- Inflation Outlook by Country, 2010-2035
- Impact of Russia-Ukraine Conflict, Sluggish China Growth, US Developments
5. Growth Opportunity Analysis
Trends at a Glance
- What are the most noteworthy trends in the market
- Where should leaders pay attention?
- What industries are likely to be affected by the growth?
Market Dynamics
- Charting a path forward
- Growth Drivers
- Growth Barriers
Key Industry Stakeholders
- Suppliers
- Manufacturers and Service Providers
- Distribution Channels
- End-Users and Applications
- Regulators
- Investors, Traders, and R&D Institutes
Regulatory Landscape
6. Market Size Outlook to 2034
Global Nanocoatings Market Size Forecast, USD Million, 2018- 2034
- Historic Market Size, 2018- 2024
- Forecast Market Size, 2024- 2034
Scenario Analysis
- Low Growth Scenario: Definition and Outlook to 2034
- Reference Case: Definition and Outlook to 2034
- High Growth Scenario: Definition and Outlook to 2034
Pricing Analysis and Outlook
- Nanocoatings Average Price Forecast, 2021- 2034
- Key Factors Shaping the Pricing Patterns
7. Historical Nanocoatings Market Size by Segments, 2018- 2024
Key Statistics, 2024
Nanocoatings Market Size Outlook by Type, USD Million, 2018- 2024
Growth Comparison (y-o-y) across Nanocoatings Types, 2018- 2024
Nanocoatings Market Size Outlook by Application, USD Million, 2018- 2024
Growth Comparison (y-o-y) across Nanocoatings Applications, 2018- 2024
8. Nanocoatings Market Size Outlook by Segments, 2024- 2034
By Vehicle
E-scooters
E-bikes
E-unicycles
E-skateboards
By Charger
Wired
Wireless
By Power Source
Solar Powered
Battery Powered
By End-User
Commercial
Residential
9. Nanocoatings Market Size Outlook by Region
North America
Key Market Dynamics
North America Nanocoatings Market Size Outlook by Type, USD Million, 2021-2034
North America Nanocoatings Market Size Outlook by Application, USD Million, 2021-2034
North America Nanocoatings Market Size Outlook by Sales Channel, USD Million, 2021-2034
North America Nanocoatings Market Size Outlook by Country, USD Million, 2021-2034
Europe
Key Market Dynamics
Europe Nanocoatings Market Size Outlook by Type, USD Million, 2021-2034
Europe Nanocoatings Market Size Outlook by Application, USD Million, 2021-2034
Europe Nanocoatings Market Size Outlook by Sales Channel, USD Million, 2021-2034
Europe Nanocoatings Market Size Outlook by Country, USD Million, 2021-2034
Asia Pacific
Key Market Dynamics
Asia Pacific Nanocoatings Market Size Outlook by Type, USD Million, 2021-2034
Asia Pacific Nanocoatings Market Size Outlook by Application, USD Million, 2021-2034
Asia Pacific Nanocoatings Market Size Outlook by Sales Channel, USD Million, 2021-2034
Asia Pacific Nanocoatings Market Size Outlook by Country, USD Million, 2021-2034
South America
Key Market Dynamics
South America Nanocoatings Market Size Outlook by Type, USD Million, 2021-2034
South America Nanocoatings Market Size Outlook by Application, USD Million, 2021-2034
South America Nanocoatings Market Size Outlook by Sales Channel, USD Million, 2021-2034
South America Nanocoatings Market Size Outlook by Country, USD Million, 2021-2034
Middle East and Africa
Key Market Dynamics
Middle East and Africa Nanocoatings Market Size Outlook by Type, USD Million, 2021-2034
Middle East and Africa Nanocoatings Market Size Outlook by Application, USD Million, 2021-2034
Middle East and Africa Nanocoatings Market Size Outlook by Sales Channel, USD Million, 2021-2034
Middle East and Africa Nanocoatings Market Size Outlook by Country, USD Million, 2021-2034
10. United States Nanocoatings Market Analysis and Outlook, 2021- 2034
Key Statistics
United States Nanocoatings Market Size Outlook by Type, 2021- 2034
United States Nanocoatings Market Size Outlook by Application, 2021- 2034
United States Nanocoatings Market Size Outlook by End-User, 2021- 2034
11. Canada Nanocoatings Market Analysis and Outlook, 2021- 2034
Key Statistics
Canada Nanocoatings Market Size Outlook by Type, 2021- 2034
Canada Nanocoatings Market Size Outlook by Application, 2021- 2034
Canada Nanocoatings Market Size Outlook by End-User, 2021- 2034
12. Mexico Nanocoatings Market Analysis and Outlook, 2021- 2034
Key Statistics
Mexico Nanocoatings Market Size Outlook by Type, 2021- 2034
Mexico Nanocoatings Market Size Outlook by Application, 2021- 2034
Mexico Nanocoatings Market Size Outlook by End-User, 2021- 2034
13. Germany Nanocoatings Market Analysis and Outlook, 2021- 2034
Key Statistics
Germany Nanocoatings Market Size Outlook by Type, 2021- 2034
Germany Nanocoatings Market Size Outlook by Application, 2021- 2034
Germany Nanocoatings Market Size Outlook by End-User, 2021- 2034
14. France Nanocoatings Market Analysis and Outlook, 2021- 2034
Key Statistics
France Nanocoatings Market Size Outlook by Type, 2021- 2034
France Nanocoatings Market Size Outlook by Application, 2021- 2034
France Nanocoatings Market Size Outlook by End-User, 2021- 2034
15. United Kingdom Nanocoatings Market Analysis and Outlook, 2021- 2034
Key Statistics
United Kingdom Nanocoatings Market Size Outlook by Type, 2021- 2034
United Kingdom Nanocoatings Market Size Outlook by Application, 2021- 2034
United Kingdom Nanocoatings Market Size Outlook by End-User, 2021- 2034
16. Spain Nanocoatings Market Analysis and Outlook, 2021- 2034
Key Statistics
Spain Nanocoatings Market Size Outlook by Type, 2021- 2034
Spain Nanocoatings Market Size Outlook by Application, 2021- 2034
Spain Nanocoatings Market Size Outlook by End-User, 2021- 2034
17. Italy Nanocoatings Market Analysis and Outlook, 2021- 2034
Key Statistics
Italy Nanocoatings Market Size Outlook by Type, 2021- 2034
Italy Nanocoatings Market Size Outlook by Application, 2021- 2034
Italy Nanocoatings Market Size Outlook by End-User, 2021- 2034
18. Benelux Nanocoatings Market Analysis and Outlook, 2021- 2034
Key Statistics
Benelux Nanocoatings Market Size Outlook by Type, 2021- 2034
Benelux Nanocoatings Market Size Outlook by Application, 2021- 2034
Benelux Nanocoatings Market Size Outlook by End-User, 2021- 2034
19. Nordic Nanocoatings Market Analysis and Outlook, 2021- 2034
Key Statistics
Nordic Nanocoatings Market Size Outlook by Type, 2021- 2034
Nordic Nanocoatings Market Size Outlook by Application, 2021- 2034
Nordic Nanocoatings Market Size Outlook by End-User, 2021- 2034
20. Rest of Europe Nanocoatings Market Analysis and Outlook, 2021- 2034
Key Statistics
Rest of Europe Nanocoatings Market Size Outlook by Type, 2021- 2034
Rest of Europe Nanocoatings Market Size Outlook by Application, 2021- 2034
Rest of Europe Nanocoatings Market Size Outlook by End-User, 2021- 2034
21. China Nanocoatings Market Analysis and Outlook, 2021- 2034
Key Statistics
China Nanocoatings Market Size Outlook by Type, 2021- 2034
China Nanocoatings Market Size Outlook by Application, 2021- 2034
China Nanocoatings Market Size Outlook by End-User, 2021- 2034
22. India Nanocoatings Market Analysis and Outlook, 2021- 2034
Key Statistics
India Nanocoatings Market Size Outlook by Type, 2021- 2034
India Nanocoatings Market Size Outlook by Application, 2021- 2034
India Nanocoatings Market Size Outlook by End-User, 2021- 2034
23. Japan Nanocoatings Market Analysis and Outlook, 2021- 2034
Key Statistics
Japan Nanocoatings Market Size Outlook by Type, 2021- 2034
Japan Nanocoatings Market Size Outlook by Application, 2021- 2034
Japan Nanocoatings Market Size Outlook by End-User, 2021- 2034
24. South Korea Nanocoatings Market Analysis and Outlook, 2021- 2034
Key Statistics
South Korea Nanocoatings Market Size Outlook by Type, 2021- 2034
South Korea Nanocoatings Market Size Outlook by Application, 2021- 2034
South Korea Nanocoatings Market Size Outlook by End-User, 2021- 2034
25. Australia Nanocoatings Market Analysis and Outlook, 2021- 2034
Key Statistics
Australia Nanocoatings Market Size Outlook by Type, 2021- 2034
Australia Nanocoatings Market Size Outlook by Application, 2021- 2034
Australia Nanocoatings Market Size Outlook by End-User, 2021- 2034
26. South East Asia Nanocoatings Market Analysis and Outlook, 2021- 2034
Key Statistics
South East Asia Nanocoatings Market Size Outlook by Type, 2021- 2034
South East Asia Nanocoatings Market Size Outlook by Application, 2021- 2034
South East Asia Nanocoatings Market Size Outlook by End-User, 2021- 2034
27. Rest of Asia Pacific Nanocoatings Market Analysis and Outlook, 2021- 2034
Key Statistics
Rest of Asia Pacific Nanocoatings Market Size Outlook by Type, 2021- 2034
Rest of Asia Pacific Nanocoatings Market Size Outlook by Application, 2021- 2034
Rest of Asia Pacific Nanocoatings Market Size Outlook by End-User, 2021- 2034
28. Brazil Nanocoatings Market Analysis and Outlook, 2021- 2034
Key Statistics
Brazil Nanocoatings Market Size Outlook by Type, 2021- 2034
Brazil Nanocoatings Market Size Outlook by Application, 2021- 2034
Brazil Nanocoatings Market Size Outlook by End-User, 2021- 2034
29. Argentina Nanocoatings Market Analysis and Outlook, 2021- 2034
Key Statistics
Argentina Nanocoatings Market Size Outlook by Type, 2021- 2034
Argentina Nanocoatings Market Size Outlook by Application, 2021- 2034
Argentina Nanocoatings Market Size Outlook by End-User, 2021- 2034
30. Rest of South America Nanocoatings Market Analysis and Outlook, 2021- 2034
Key Statistics
Rest of South America Nanocoatings Market Size Outlook by Type, 2021- 2034
Rest of South America Nanocoatings Market Size Outlook by Application, 2021- 2034
Rest of South America Nanocoatings Market Size Outlook by End-User, 2021- 2034
31. United Arab Emirates Nanocoatings Market Analysis and Outlook, 2021- 2034
Key Statistics
United Arab Emirates Nanocoatings Market Size Outlook by Type, 2021- 2034
United Arab Emirates Nanocoatings Market Size Outlook by Application, 2021- 2034
United Arab Emirates Nanocoatings Market Size Outlook by End-User, 2021- 2034
32. Saudi Arabia Nanocoatings Market Analysis and Outlook, 2021- 2034
Key Statistics
Saudi Arabia Nanocoatings Market Size Outlook by Type, 2021- 2034
Saudi Arabia Nanocoatings Market Size Outlook by Application, 2021- 2034
Saudi Arabia Nanocoatings Market Size Outlook by End-User, 2021- 2034
33. Rest of Middle East Nanocoatings Market Analysis and Outlook, 2021- 2034
Key Statistics
Rest of Middle East Nanocoatings Market Size Outlook by Type, 2021- 2034
Rest of Middle East Nanocoatings Market Size Outlook by Application, 2021- 2034
Rest of Middle East Nanocoatings Market Size Outlook by End-User, 2021- 2034
34. South Africa Nanocoatings Market Analysis and Outlook, 2021- 2034
Key Statistics
South Africa Nanocoatings Market Size Outlook by Type, 2021- 2034
South Africa Nanocoatings Market Size Outlook by Application, 2021- 2034
South Africa Nanocoatings Market Size Outlook by End-User, 2021- 2034
35. Rest of Africa Nanocoatings Market Analysis and Outlook, 2021- 2034
Key Statistics
Rest of Africa Nanocoatings Market Size Outlook by Type, 2021- 2034
Rest of Africa Nanocoatings Market Size Outlook by Application, 2021- 2034
Rest of Africa Nanocoatings Market Size Outlook by End-User, 2021- 2034
36. Key Companies
Market Share Analysis
Ather Energy
bike-energy
Bikeep
Flower Turbines
Get Charged Inc
Giulio Barbieri SRL
Ground Control Systems
Magment
Perch Mobility
Robert Bosch GmbH
Solum
SWIFTMILE
The Mobility House GmbH
Company Benchmarking
Financial Analysis
37. Recent Market Developments
38. Appendix
Looking Ahead
Research Methodology
Legal Disclaimer
