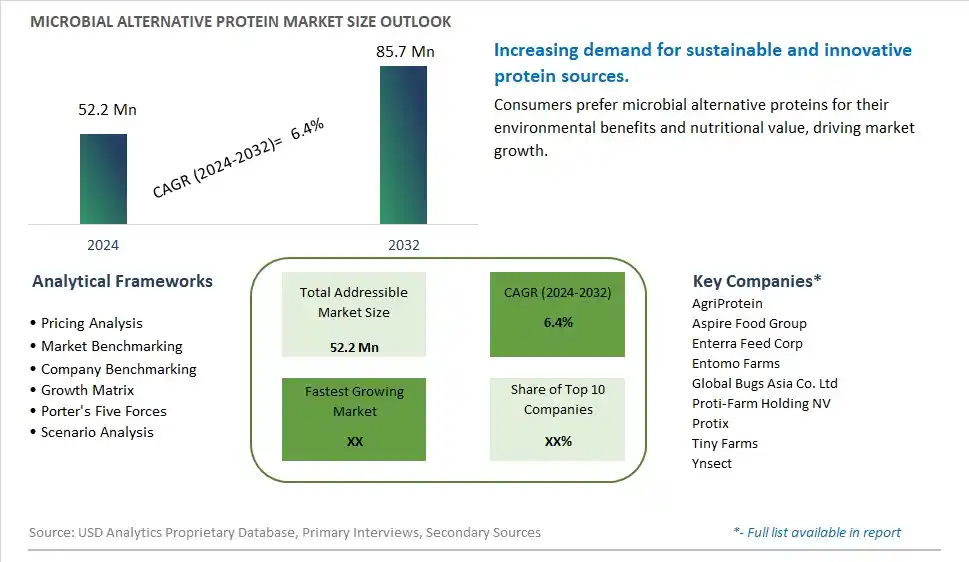
Global Microbial Alternative Protein Market Size is valued at $52.2 Million in 2024 and is forecast to register a growth rate (CAGR) of 6.4% to reach $85.7 Million by 2032.
The global Microbial Alternative Protein Market Comprehensive Study analyzes and forecasts the market size across 6 regions and 24 countries for diverse segments -By Type (Emerging Alternative Protein, Adolescent Alternative Protein, Matured Alternative Protein), By Application (Food, Feed, Others)
An Introduction to Microbial Alternative Protein Market
In 2024, the microbial alternative protein market is expanding rapidly, driven by the demand for sustainable and efficient protein sources. Microbial proteins, produced through fermentation processes, offer a high-quality, eco-friendly alternative to traditional animal and plant proteins. The market benefits from innovations in fermentation technology and microbial strain development that enhance protein yield and functionality. The trend towards clean label and natural ingredients is influencing product development. Increasing consumer interest in sustainable and ethical eating, supported by the rise of plant-based and alternative protein diets, is further propelling market growth.
Microbial Alternative Protein Competitive Landscape
The market report analyses the leading companies in the industry including AgriProtein, Aspire Food Group, Enterra Feed Corp, Entomo Farms, Global Bugs Asia Co. Ltd, Proti-Farm Holding NV, Protix, Tiny Farms, Ynsect, and Others.
Microbial Alternative Protein Market Dynamics
Microbial Alternative Protein Market Trend: Increasing Demand for Sustainable Protein Sources
The most prominent trend in the Microbial Alternative Protein Market is the increasing demand for sustainable protein sources. As the global population grows and environmental concerns about traditional animal farming rise, microbial proteins offer a sustainable alternative that reduces the environmental footprint of protein production.
Microbial Alternative Protein Market Driver: Rise of Plant-Based and Alternative Diets
A key driver in the Microbial Alternative Protein Market is the rise of plant-based and alternative diets. Consumers seeking to reduce their meat consumption or adopt vegan and vegetarian lifestyles are turning to microbial proteins as a nutritious and environmentally friendly option.
Microbial Alternative Protein Market Opportunity: Innovation in Food Applications
One significant opportunity in the Microbial Alternative Protein Market lies in innovation in food applications. Companies can develop new products that incorporate microbial proteins into a variety of food items, such as meat substitutes, dairy alternatives, and snack foods. By offering diverse and tasty products, manufacturers can attract a broader consumer base and drive market growth.
Microbial Alternative Protein Market Share Analysis- Largest Segment by Type
The Matured Alternative Protein segment is the largest in the Microbial Alternative Protein Market by type. This dominance is driven by the high consumer demand for well-established and proven alternative protein sources that offer consistent quality and nutritional benefits. Matured alternative proteins, such as those derived from fungi and yeast, have a long history of use in food products and are widely recognized for their protein content, sustainability, and versatility. The continuous innovation in matured alternative protein formulations, including the development of new food products and applications, enhances their appeal. Additionally, the extensive availability of matured alternative proteins in various food categories, such as meat substitutes, dairy alternatives, and protein supplements, further boosts their market share. The strong consumer preference for reliable and high-quality alternative protein sources reinforces the dominant position of the matured alternative protein segment in the market.
Microbial Alternative Protein Market Share Analysis- Fastest Growing Segment by Application
The Food segment is poised to grow the fastest in the Microbial Alternative Protein Market by application over the next five years. This rapid growth is driven by the increasing consumer demand for sustainable and plant-based protein sources in food products. Microbial alternative proteins are highly valued for their ability to provide complete protein profiles, making them suitable for a wide range of food applications, including meat substitutes, dairy alternatives, and protein-rich snacks. The continuous innovation in food formulations using microbial proteins, including the development of new textures, flavors, and nutritional profiles, enhances their appeal. Additionally, the growing trend of plant-based and sustainable diets supports the fast growth of the food segment, as consumers seek protein sources that align with their dietary preferences and environmental concerns. The influence of culinary innovation and food technology further drives the demand for microbial alternative proteins in the food sector.
Microbial Alternative Protein Market Segmentation
By Type
Emerging Alternative Protein
Adolescent Alternative Protein
Matured Alternative Protein
By Application
Food
Feed
Others
Countries Analyzed
North America (US, Canada, Mexico)
Europe (Germany, UK, France, Spain, Italy, Russia, Rest of Europe)
Asia Pacific (China, India, Japan, South Korea, Australia, South East Asia, Rest of Asia)
South America (Brazil, Argentina, Rest of South America)
Middle East and Africa (Saudi Arabia, UAE, Rest of Middle East, South Africa, Egypt, Rest of Africa)
Microbial Alternative Protein Companies Profiled in the Study
AgriProtein
Aspire Food Group
Enterra Feed Corp
Entomo Farms
Global Bugs Asia Co. Ltd
Proti-Farm Holding NV
Protix
Tiny Farms
Ynsect
*- List Not Exhaustive
Chapter 1. TABLE OF CONTENTS
Chapter 2. Introduction to Microbial Alternative Protein Market
2.1. Market Overview
2.2. Key Statistics and Report Highlights
2.3. Scope of the Comprehensive Study
2.3.1. Market Definition
2.3.2 Countries and Regions Covered
2.3.3 Research Objective
2.3.4 Units, Currency, and Conversions
2.3.5 Industry Value Chain
2.4. Key Market Segments
2.5. Key Companies
2.6. Study Period
Chapter 3. Strategic Analysis Review
3.1. Microbial Alternative Protein Pricing Analysis and Forecast
3.2. Porter’s Five Forces
3.3. Market Ecosystem
3.4. SWOT Analysis
3.5. Regulatory Scenario
3.3. Effects of Inflation, Russia-Ukraine War, moderating economic growth, and other macroeconomic factors
Chapter 4. Competitive Landscape
4.1. Market Share Analysis
4.1.1. Global Microbial Alternative Protein Market Share by Company, 2023
4.1.2. Product Offerings of Leading Microbial Alternative Protein Companies
4.2. Market Entropy
4.2.1. New Product Launches in the Industry
4.2.2. Mergers, Acquisitions, Joint ventures, and Partnerships
4.3. Key Strategies and Best Practices
Chapter 5. Global Market Projections: Best, Reference, and Low Case Scenarios
5.1. Growth Analysis- Case Scenario Definitions
5.2. Low Growth Case Scenario Forecasts
5.3. Reference Growth Case Scenario Forecasts
5.4. High Growth Case Scenario Forecasts
Chapter 6. Market Dynamics
6.1. Microbial Alternative Protein Market Drivers
6.2. Microbial Alternative Protein Market Challenges
6.6. Microbial Alternative Protein Market Opportunities
6.4. Microbial Alternative Protein Market Trends
Chapter 7. Global Microbial Alternative Protein Market Outlook Trends
7.1. Global Microbial Alternative Protein Revenue (USD Million) and CAGR (%) by Type (2021-2032)
7.2. Global Microbial Alternative Protein Revenue (USD Million) and CAGR (%) by Application (2021-2032)
7.3. Global Microbial Alternative Protein Revenue (USD Million) and CAGR (%) by Product (2021-2032)
By Type
Emerging Alternative Protein
Adolescent Alternative Protein
Matured Alternative Protein
By Application
Food
Feed
Others
Chapter 8. Global Microbial Alternative Protein Regional Analysis and Outlook
8.1. Global Microbial Alternative Protein Revenue (USD Million) By Regions (2021- 2032)
8.2. North America Microbial Alternative Protein Revenue (USD Million) by Country (2021-2032)
8.2.1. United States Microbial Alternative Protein Regional Analysis and Outlook
8.2.2. Canada Microbial Alternative Protein Regional Analysis and Outlook
8.2.3. Mexico Microbial Alternative Protein Regional Analysis and Outlook
8.3. Europe Microbial Alternative Protein Revenue (USD Million), by Country (2021-2032)
8.3.1. Germany Microbial Alternative Protein Regional Analysis and Outlook
8.3.2. France Microbial Alternative Protein Regional Analysis and Outlook
8.3.3. United Kingdom Microbial Alternative Protein Regional Analysis and Outlook
8.3.4. Spain Microbial Alternative Protein Regional Analysis and Outlook
8.3.5. Italy Microbial Alternative Protein Regional Analysis and Outlook
8.3.6. Russia Microbial Alternative Protein Regional Analysis and Outlook
8.3.7. Rest of Europe Microbial Alternative Protein Regional Analysis and Outlook
8.4. Asia Pacific Microbial Alternative Protein Revenue (USD Million) by Country (2021-2032)
8.4.1. China Microbial Alternative Protein Regional Analysis and Outlook
8.4.2. Japan Microbial Alternative Protein Regional Analysis and Outlook
8.4.3. India Microbial Alternative Protein Regional Analysis and Outlook
8.4.4. South Korea Microbial Alternative Protein Regional Analysis and Outlook
8.4.5. Australia Microbial Alternative Protein Regional Analysis and Outlook
8.4.6. South East Asia Microbial Alternative Protein Regional Analysis and Outlook
8.4.7. Rest of Asia Pacific Microbial Alternative Protein Regional Analysis and Outlook
8.5. South America Microbial Alternative Protein Revenue (USD Million), by Country (2021-2032)
8.5.1. Brazil Microbial Alternative Protein Regional Analysis and Outlook
8.5.2. Argentina Microbial Alternative Protein Regional Analysis and Outlook
8.5.3. Rest of South America Microbial Alternative Protein Regional Analysis and Outlook
8.6. Middle East and Africa Microbial Alternative Protein Revenue (USD Million) by Country (2021-2032)
8.6.1. Middle East Microbial Alternative Protein Regional Analysis and Outlook
8.6.2. Africa Microbial Alternative Protein Regional Analysis and Outlook
Chapter 9. North America Microbial Alternative Protein Analysis and Outlook
9.1. North America Microbial Alternative Protein Revenue (USD Million) by Segments (2021-2032)
9.1.1. North America Microbial Alternative Protein Revenue (USD Million) by Type (2021-2032)
9.1.2. North America Microbial Alternative Protein Revenue (USD Million) by Application (2021-2032)
9.1.3. North America Microbial Alternative Protein Revenue (USD Million) by Product (2021-2032)
By Type
Emerging Alternative Protein
Adolescent Alternative Protein
Matured Alternative Protein
By Application
Food
Feed
Others
Chapter 10. Europe Microbial Alternative Protein Analysis and Outlook
10.1. Europe Microbial Alternative Protein Revenue (USD Million), by Segments (USD Million) (2021-2032)
10.1.1. Europe Microbial Alternative Protein Revenue (USD Million) by Type (2021-2032)
10.1.2. Europe Microbial Alternative Protein Revenue (USD Million) by Application (2021-2032)
10.1.3. Europe Microbial Alternative Protein Revenue (USD Million) by Product (2021-2032)
By Type
Emerging Alternative Protein
Adolescent Alternative Protein
Matured Alternative Protein
By Application
Food
Feed
Others
Chapter 11. Asia Pacific Microbial Alternative Protein Analysis and Outlook
11.1. Asia Pacific Microbial Alternative Protein Revenue (USD Million), and Revenue (USD Million) by Segments (2021-2032)
11.1.1. Asia Pacific Microbial Alternative Protein Revenue (USD Million) by Type (2021-2032)
11.1.2. Asia Pacific Microbial Alternative Protein Revenue (USD Million) by Application (2021-2032)
11.1.3. Asia Pacific Microbial Alternative Protein Revenue (USD Million) by Product (2021-2032)
By Type
Emerging Alternative Protein
Adolescent Alternative Protein
Matured Alternative Protein
By Application
Food
Feed
Others
Chapter 12. South America Microbial Alternative Protein Analysis and Outlook
12.1. South America Microbial Alternative Protein Revenue (USD Million), by Segments (2021-2032)
12.1.1. South America Microbial Alternative Protein Revenue (USD Million) by Type (2021-2032)
12.1.2. South America Microbial Alternative Protein Revenue (USD Million) by Application (2021-2032)
12.1.3. South America Microbial Alternative Protein Revenue (USD Million) by Product (2021-2032)
By Type
Emerging Alternative Protein
Adolescent Alternative Protein
Matured Alternative Protein
By Application
Food
Feed
Others
Chapter 13. Middle East and Africa Microbial Alternative Protein Analysis and Outlook
13.1. Middle East and Africa Microbial Alternative Protein Revenue (USD Million), by Segments (2021-2032)
13.1.1. Middle East and Africa Microbial Alternative Protein Revenue (USD Million) by Type (2021-2032)
13.1.2. Middle East and Africa Microbial Alternative Protein Revenue (USD Million) by Application (2021-2032)
13.1.3. Middle East and Africa Microbial Alternative Protein Revenue (USD Million) by Product (2021-2032)
By Type
Emerging Alternative Protein
Adolescent Alternative Protein
Matured Alternative Protein
By Application
Food
Feed
Others
Chapter 14. Microbial Alternative Protein Company Profiles
14.1 Business Overview
14.2 Product Profiles
14.3 SWOT Profiles
14.5 Recent Developments
14.6 Financial Profile
List of Companies
AgriProtein
Aspire Food Group
Enterra Feed Corp
Entomo Farms
Global Bugs Asia Co. Ltd
Proti-Farm Holding NV
Protix
Tiny Farms
Ynsect
15. Methodology and Data Sources
15.1 Customization Offerings
15.2 Subscription Services
15.3 Related Reports
15.4 Publisher Expertise
LIST OF TABLES
Table 1 Market Segmentation Analysis
Table 2 Global Microbial Alternative Protein Market Share of Leading Companies, 2023
Table 3 Product Offerings of Leading Companies
Table 4 Low Growth Scenario Forecasts
Table 5 Reference Case Growth Scenario
Table 6 High Growth Case Scenario
Table 7 Global Microbial Alternative Protein Revenue (USD Million) And CAGR (%) By Type (2021-2032)
Table 8 Global Microbial Alternative Protein Revenue (USD Million) And CAGR (%) By Application (2021-2032)
Table 9 Global Microbial Alternative Protein Revenue (USD Million) And CAGR (%) By Product (2021-2032)
Table 10 Global Microbial Alternative Protein Market Revenue (USD Million) By Regions (2021-2032)
Table 11 Global Microbial Alternative Protein Market Share (%) By Regions (2021-2032)
Table 12 North America Microbial Alternative Protein Revenue (USD Million) By Country (2021-2032)
Table 13 Europe Microbial Alternative Protein Revenue (USD Million) By Country (2021-2032)
Table 14 Asia Pacific Microbial Alternative Protein Revenue (USD Million) By Country (2021-2032)
Table 15 South America Microbial Alternative Protein Revenue (USD Million) By Country (2021-2032)
Table 16 Middle East and Africa Microbial Alternative Protein Revenue (USD Million) By Region (2021-2032)
Table 17 North America Microbial Alternative Protein Revenue (USD Million) By Type (2021-2032)
Table 18 North America Microbial Alternative Protein Revenue (USD Million) By Application (2021-2032)
Table 19 North America Microbial Alternative Protein Revenue (USD Million) By Product (2021-2032)
Table 20 Europe Microbial Alternative Protein Revenue (USD Million) By Type (2021-2032)
Table 21 Europe Microbial Alternative Protein Revenue (USD Million) By Application (2021-2032)
Table 22 Europe Microbial Alternative Protein Revenue (USD Million) By Product (2021-2032)
Table 23 Asia Pacific Microbial Alternative Protein Revenue (USD Million) By Type (2021-2032)
Table 24 Asia Pacific Microbial Alternative Protein Revenue (USD Million) By Application (2021-2032)
Table 25 Asia Pacific Microbial Alternative Protein Revenue (USD Million) By Product (2021-2032)
Table 26 South America Microbial Alternative Protein Revenue (USD Million) By Type (2021-2032)
Table 27 South America Microbial Alternative Protein Revenue (USD Million) By Application (2021-2032)
Table 28 South America Microbial Alternative Protein Revenue (USD Million) By Product (2021-2032)
Table 29 Middle East and Africa Microbial Alternative Protein Revenue (USD Million) By Type (2021-2032)
Table 30 Middle East and Africa Microbial Alternative Protein Revenue (USD Million) By Application (2021-2032)
Table 31 Middle East and Africa Microbial Alternative Protein Revenue (USD Million) By Product (2021-2032)
LIST OF FIGURES
Figure 1. Market Scope
Figure 2. Pricing Forecasts Per Unit, 2023- 2032
Figure 3. Porter’s Five Forces
Figure 4. Global Microbial Alternative Protein Market Revenue (USD Million) By Regions (2021-2032)
Figure 5. Global Microbial Alternative Protein Market Share (%) By Regions (2023)
Figure 6. North America Microbial Alternative Protein Revenue (USD Million) By Country (2021-2032)
Figure 7. United States Microbial Alternative Protein Revenue (USD Million) By Country (2021-2032)
Figure 8. Canada Microbial Alternative Protein Revenue (USD Million) By Country (2021-2032)
Figure 9. Mexico Microbial Alternative Protein Revenue (USD Million) By Country (2021-2032)
Figure 10. Europe Microbial Alternative Protein Revenue (USD Million) By Country (2021-2032)
Figure 11. Germany Microbial Alternative Protein Revenue (USD Million) By Country (2021-2032)
Figure 12. France Microbial Alternative Protein Revenue (USD Million) By Country (2021-2032)
Figure 13. United Kingdom Microbial Alternative Protein Revenue (USD Million) By Country (2021-2032)
Figure 14. Spain Microbial Alternative Protein Revenue (USD Million) By Country (2021-2032)
Figure 15. Italy Microbial Alternative Protein Revenue (USD Million) By Country (2021-2032)
Figure 16. Russia Microbial Alternative Protein Revenue (USD Million) By Country (2021-2032)
Figure 17. Rest of Europe Microbial Alternative Protein Revenue (USD Million) By Country (2021-2032)
Figure 11. Asia Pacific Microbial Alternative Protein Revenue (USD Million) By Country (2021-2032)
Figure 12. China Microbial Alternative Protein Revenue (USD Million) By Country (2021-2032)
Figure 13. Japan Microbial Alternative Protein Revenue (USD Million) By Country (2021-2032)
Figure 14. India Microbial Alternative Protein Revenue (USD Million) By Country (2021-2032)
Figure 15. South Korea Microbial Alternative Protein Revenue (USD Million) By Country (2021-2032)
Figure 16. Australia Microbial Alternative Protein Revenue (USD Million) By Country (2021-2032)
Figure 17. South East Asia Microbial Alternative Protein Revenue (USD Million) By Country (2021-2032)
Figure 18. South America Microbial Alternative Protein Revenue (USD Million) By Country (2021-2032)
Figure 19. Brazil Microbial Alternative Protein Revenue (USD Million) By Country (2021-2032)
Figure 20. Argentina Microbial Alternative Protein Revenue (USD Million) By Country (2021-2032)
Figure 21. Rest of Asia Pacific Microbial Alternative Protein Revenue (USD Million) By Country (2021-2032)
Figure 22. Middle East and Africa Microbial Alternative Protein Revenue (USD Million) By Region (2021-2032)
Figure 23. Saudi Arabia Microbial Alternative Protein Revenue (USD Million) By Region (2021-2032)
Figure 24. The UAE Microbial Alternative Protein Revenue (USD Million) By Region (2021-2032)
Figure 25. Rest of Middle East Microbial Alternative Protein Revenue (USD Million) By Region (2021-2032)
Figure 26. South Africa Microbial Alternative Protein Revenue (USD Million) By Region (2021-2032)
Figure 27. Africa Microbial Alternative Protein Revenue (USD Million) By Region (2021-2032)
Figure 28. North America Microbial Alternative Protein Revenue (USD Million) By Type (2021-2032)
Figure 29. North America Microbial Alternative Protein Revenue (USD Million) By Application (2021-2032)
Figure 30. North America Microbial Alternative Protein Revenue (USD Million) By Product (2021-2032)
Figure 31. Europe Microbial Alternative Protein Revenue (USD Million) By Type (2021-2032)
Figure 32. Europe Microbial Alternative Protein Revenue (USD Million) By Application (2021-2032)
Figure 33. Europe Microbial Alternative Protein Revenue (USD Million) By Product (2021-2032)
Figure 34. Asia Pacific Microbial Alternative Protein Revenue (USD Million) By Type (2021-2032)
Figure 35. Asia Pacific Microbial Alternative Protein Revenue (USD Million) By Application (2021-2032)
Figure 36. Asia Pacific Microbial Alternative Protein Revenue (USD Million) By Product (2021-2032)
Figure 37. South America Microbial Alternative Protein Revenue (USD Million) By Type (2021-2032)
Figure 38. South America Microbial Alternative Protein Revenue (USD Million) By Application (2021-2032)
Figure 39. South America Microbial Alternative Protein Revenue (USD Million) By Product (2021-2032)
Figure 40. Middle East and Africa Microbial Alternative Protein Revenue (USD Million) By Type (2021-2032)
Figure 41. Middle East and Africa Microbial Alternative Protein Revenue (USD Million) By Application (2021-2032)
Figure 42. Middle East and Africa Microbial Alternative Protein Revenue (USD Million) By Product (2021-2032)
By Type
Emerging Alternative Protein
Adolescent Alternative Protein
Matured Alternative Protein
By Application
Food
Feed
Others
Countries Analyzed
North America (US, Canada, Mexico)
Europe (Germany, UK, France, Spain, Italy, Russia, Rest of Europe)
Asia Pacific (China, India, Japan, South Korea, Australia, South East Asia, Rest of Asia)
South America (Brazil, Argentina, Rest of South America)
Middle East and Africa (Saudi Arabia, UAE, Rest of Middle East, South Africa, Egypt, Rest of Africa)
