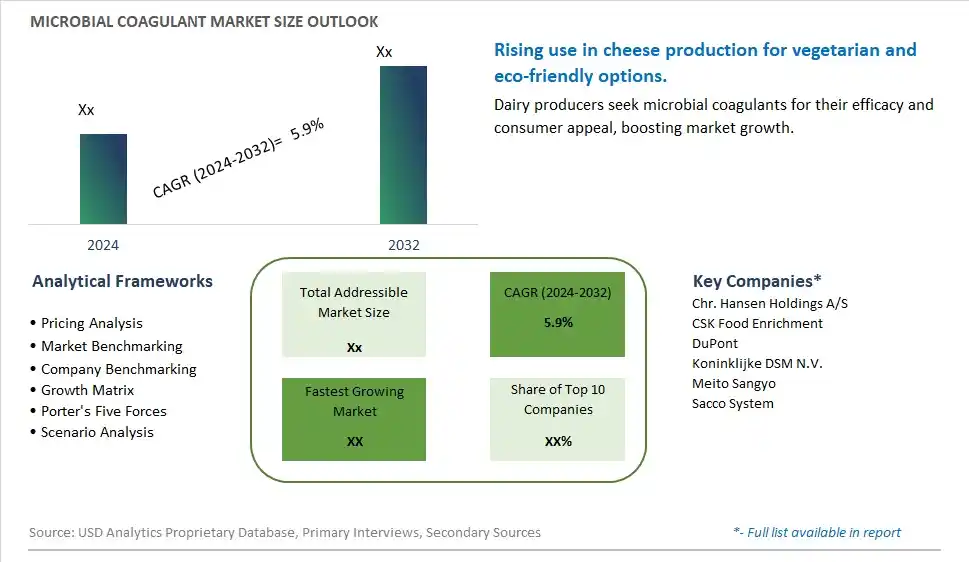
Global Microbial Coagulant Market Size is valued at $XX Million in 2024 and is forecast to register a growth rate (CAGR) of 5.9% to reach $XX Million by 2032.
The global Microbial Coagulant Market Comprehensive Study analyzes and forecasts the market size across 6 regions and 24 countries for diverse segments -By Type (Liquid, Dry), By Application (Supermarkets/Hypermarkets, Convenience Stores, Specialty Stores, Online Retail, Others)
An Introduction to Microbial Coagulant Market
The microbial coagulant market in 2024 is thriving, driven by the demand for vegetarian and microbial-based alternatives to traditional animal-derived coagulants in cheese making and other food applications. Microbial coagulants, derived from specific microbial cultures, are used to coagulate milk and create various cheese textures. The market benefits from advancements in microbial culture development and fermentation technology. The trend towards clean label and natural ingredients is influencing product development. Increasing consumer interest in vegetarian and vegan products, along with the rise of artisanal and specialty cheeses, is further supporting market growth.
Microbial Coagulant Competitive Landscape
The market report analyses the leading companies in the industry including Chr. Hansen Holdings A/S, CSK Food Enrichment, DuPont, Koninklijke DSM N.V., Meito Sangyo, Sacco System, and Others.
Microbial Coagulant Market Dynamics
Microbial Coagulant Market Trend: Growing Use in Dairy Production
The most prominent trend in the Microbial Coagulant Market is the growing use of microbial coagulants in dairy production. Microbial coagulants are increasingly preferred over traditional animal-derived rennet for cheese making, driven by the demand for vegetarian and kosher products.
Microbial Coagulant Market Driver: Increasing Demand for Vegetarian and Kosher Cheese
A key driver in the Microbial Coagulant Market is the increasing demand for vegetarian and kosher cheese. As more consumers seek dairy products that meet their dietary restrictions, the need for microbial coagulants, which align with these requirements, is rising.
Microbial Coagulant Market Opportunity: Development of Advanced Coagulant Strains
One significant opportunity in the Microbial Coagulant Market lies in the development of advanced coagulant strains. Companies can innovate by creating microbial coagulants with enhanced activity, stability, and specificity for different types of cheese. By improving the efficiency and quality of cheese production, manufacturers can attract more dairy producers and drive market growth.
Microbial Coagulant Market Share Analysis- Largest Segment by Type
The Dry segment is the largest in the Microbial Coagulant Market by type. This dominance is driven by the high consumer demand for convenient and stable coagulant forms that offer ease of use and long shelf life. Dry microbial coagulants are widely used in the food industry, particularly in cheese-making and other dairy applications, for their ability to consistently produce high-quality products. The continuous innovation in dry coagulant formulations, including the development of standardized and concentrated forms, enhances their appeal. Additionally, the extensive availability of dry microbial coagulants in the food processing industry and their ability to provide consistent results further boosts their market share. The strong consumer preference for reliable and easy-to-use coagulants reinforces the dominant position of the dry segment in the market.
Microbial Coagulant Market Share Analysis- Fastest Growing Segment by Application
The Online Retail segment is poised to grow the fastest in the Microbial Coagulant Market by application over the next five years. This rapid growth is driven by the increasing consumer preference for the convenience and accessibility of online shopping. E-commerce platforms provide a wide variety of microbial coagulant products, including niche and specialty items that may not be readily available in physical stores. The convenience of browsing and purchasing from home, coupled with the option of home delivery, appeals to a broad range of consumers. The COVID-19 pandemic has further accelerated the adoption of online shopping, and this trend continues as consumers appreciate the safety and convenience of having products delivered to their doorstep. Additionally, online retailers often offer competitive pricing, detailed product information, and customer reviews, which further drive consumer confidence and sales. The growth of digital marketing and targeted online advertisements also boosts the visibility and sales of microbial coagulant products through e-commerce channels.
Microbial Coagulant Market Segmentation
By Type
Liquid
Dry
By Application
Supermarkets/Hypermarkets
Convenience Stores
Specialty Stores
Online Retail
Others
Countries Analyzed
North America (US, Canada, Mexico)
Europe (Germany, UK, France, Spain, Italy, Russia, Rest of Europe)
Asia Pacific (China, India, Japan, South Korea, Australia, South East Asia, Rest of Asia)
South America (Brazil, Argentina, Rest of South America)
Middle East and Africa (Saudi Arabia, UAE, Rest of Middle East, South Africa, Egypt, Rest of Africa)
Microbial Coagulant Companies Profiled in the Study
Chr. Hansen Holdings A/S
CSK Food Enrichment
DuPont
Koninklijke DSM N.V.
Meito Sangyo
Sacco System
*- List Not Exhaustive
Chapter 1. TABLE OF CONTENTS
Chapter 2. Introduction to Microbial Coagulant Market
2.1. Market Overview
2.2. Key Statistics and Report Highlights
2.3. Scope of the Comprehensive Study
2.3.1. Market Definition
2.3.2 Countries and Regions Covered
2.3.3 Research Objective
2.3.4 Units, Currency, and Conversions
2.3.5 Industry Value Chain
2.4. Key Market Segments
2.5. Key Companies
2.6. Study Period
Chapter 3. Strategic Analysis Review
3.1. Microbial Coagulant Pricing Analysis and Forecast
3.2. Porter’s Five Forces
3.3. Market Ecosystem
3.4. SWOT Analysis
3.5. Regulatory Scenario
3.3. Effects of Inflation, Russia-Ukraine War, moderating economic growth, and other macroeconomic factors
Chapter 4. Competitive Landscape
4.1. Market Share Analysis
4.1.1. Global Microbial Coagulant Market Share by Company, 2023
4.1.2. Product Offerings of Leading Microbial Coagulant Companies
4.2. Market Entropy
4.2.1. New Product Launches in the Industry
4.2.2. Mergers, Acquisitions, Joint ventures, and Partnerships
4.3. Key Strategies and Best Practices
Chapter 5. Global Market Projections: Best, Reference, and Low Case Scenarios
5.1. Growth Analysis- Case Scenario Definitions
5.2. Low Growth Case Scenario Forecasts
5.3. Reference Growth Case Scenario Forecasts
5.4. High Growth Case Scenario Forecasts
Chapter 6. Market Dynamics
6.1. Microbial Coagulant Market Drivers
6.2. Microbial Coagulant Market Challenges
6.6. Microbial Coagulant Market Opportunities
6.4. Microbial Coagulant Market Trends
Chapter 7. Global Microbial Coagulant Market Outlook Trends
7.1. Global Microbial Coagulant Revenue (USD Million) and CAGR (%) by Type (2021-2032)
7.2. Global Microbial Coagulant Revenue (USD Million) and CAGR (%) by Application (2021-2032)
7.3. Global Microbial Coagulant Revenue (USD Million) and CAGR (%) by Product (2021-2032)
By Type
Liquid
Dry
By Application
Supermarkets/Hypermarkets
Convenience Stores
Specialty Stores
Online Retail
Others
Chapter 8. Global Microbial Coagulant Regional Analysis and Outlook
8.1. Global Microbial Coagulant Revenue (USD Million) By Regions (2021- 2032)
8.2. North America Microbial Coagulant Revenue (USD Million) by Country (2021-2032)
8.2.1. United States Microbial Coagulant Regional Analysis and Outlook
8.2.2. Canada Microbial Coagulant Regional Analysis and Outlook
8.2.3. Mexico Microbial Coagulant Regional Analysis and Outlook
8.3. Europe Microbial Coagulant Revenue (USD Million), by Country (2021-2032)
8.3.1. Germany Microbial Coagulant Regional Analysis and Outlook
8.3.2. France Microbial Coagulant Regional Analysis and Outlook
8.3.3. United Kingdom Microbial Coagulant Regional Analysis and Outlook
8.3.4. Spain Microbial Coagulant Regional Analysis and Outlook
8.3.5. Italy Microbial Coagulant Regional Analysis and Outlook
8.3.6. Russia Microbial Coagulant Regional Analysis and Outlook
8.3.7. Rest of Europe Microbial Coagulant Regional Analysis and Outlook
8.4. Asia Pacific Microbial Coagulant Revenue (USD Million) by Country (2021-2032)
8.4.1. China Microbial Coagulant Regional Analysis and Outlook
8.4.2. Japan Microbial Coagulant Regional Analysis and Outlook
8.4.3. India Microbial Coagulant Regional Analysis and Outlook
8.4.4. South Korea Microbial Coagulant Regional Analysis and Outlook
8.4.5. Australia Microbial Coagulant Regional Analysis and Outlook
8.4.6. South East Asia Microbial Coagulant Regional Analysis and Outlook
8.4.7. Rest of Asia Pacific Microbial Coagulant Regional Analysis and Outlook
8.5. South America Microbial Coagulant Revenue (USD Million), by Country (2021-2032)
8.5.1. Brazil Microbial Coagulant Regional Analysis and Outlook
8.5.2. Argentina Microbial Coagulant Regional Analysis and Outlook
8.5.3. Rest of South America Microbial Coagulant Regional Analysis and Outlook
8.6. Middle East and Africa Microbial Coagulant Revenue (USD Million) by Country (2021-2032)
8.6.1. Middle East Microbial Coagulant Regional Analysis and Outlook
8.6.2. Africa Microbial Coagulant Regional Analysis and Outlook
Chapter 9. North America Microbial Coagulant Analysis and Outlook
9.1. North America Microbial Coagulant Revenue (USD Million) by Segments (2021-2032)
9.1.1. North America Microbial Coagulant Revenue (USD Million) by Type (2021-2032)
9.1.2. North America Microbial Coagulant Revenue (USD Million) by Application (2021-2032)
9.1.3. North America Microbial Coagulant Revenue (USD Million) by Product (2021-2032)
By Type
Liquid
Dry
By Application
Supermarkets/Hypermarkets
Convenience Stores
Specialty Stores
Online Retail
Others
Chapter 10. Europe Microbial Coagulant Analysis and Outlook
10.1. Europe Microbial Coagulant Revenue (USD Million), by Segments (USD Million) (2021-2032)
10.1.1. Europe Microbial Coagulant Revenue (USD Million) by Type (2021-2032)
10.1.2. Europe Microbial Coagulant Revenue (USD Million) by Application (2021-2032)
10.1.3. Europe Microbial Coagulant Revenue (USD Million) by Product (2021-2032)
By Type
Liquid
Dry
By Application
Supermarkets/Hypermarkets
Convenience Stores
Specialty Stores
Online Retail
Others
Chapter 11. Asia Pacific Microbial Coagulant Analysis and Outlook
11.1. Asia Pacific Microbial Coagulant Revenue (USD Million), and Revenue (USD Million) by Segments (2021-2032)
11.1.1. Asia Pacific Microbial Coagulant Revenue (USD Million) by Type (2021-2032)
11.1.2. Asia Pacific Microbial Coagulant Revenue (USD Million) by Application (2021-2032)
11.1.3. Asia Pacific Microbial Coagulant Revenue (USD Million) by Product (2021-2032)
By Type
Liquid
Dry
By Application
Supermarkets/Hypermarkets
Convenience Stores
Specialty Stores
Online Retail
Others
Chapter 12. South America Microbial Coagulant Analysis and Outlook
12.1. South America Microbial Coagulant Revenue (USD Million), by Segments (2021-2032)
12.1.1. South America Microbial Coagulant Revenue (USD Million) by Type (2021-2032)
12.1.2. South America Microbial Coagulant Revenue (USD Million) by Application (2021-2032)
12.1.3. South America Microbial Coagulant Revenue (USD Million) by Product (2021-2032)
By Type
Liquid
Dry
By Application
Supermarkets/Hypermarkets
Convenience Stores
Specialty Stores
Online Retail
Others
Chapter 13. Middle East and Africa Microbial Coagulant Analysis and Outlook
13.1. Middle East and Africa Microbial Coagulant Revenue (USD Million), by Segments (2021-2032)
13.1.1. Middle East and Africa Microbial Coagulant Revenue (USD Million) by Type (2021-2032)
13.1.2. Middle East and Africa Microbial Coagulant Revenue (USD Million) by Application (2021-2032)
13.1.3. Middle East and Africa Microbial Coagulant Revenue (USD Million) by Product (2021-2032)
By Type
Liquid
Dry
By Application
Supermarkets/Hypermarkets
Convenience Stores
Specialty Stores
Online Retail
Others
Chapter 14. Microbial Coagulant Company Profiles
14.1 Business Overview
14.2 Product Profiles
14.3 SWOT Profiles
14.5 Recent Developments
14.6 Financial Profile
List of Companies
Chr. Hansen Holdings A/S
CSK Food Enrichment
DuPont
Koninklijke DSM N.V.
Meito Sangyo
Sacco System
15. Methodology and Data Sources
15.1 Customization Offerings
15.2 Subscription Services
15.3 Related Reports
15.4 Publisher Expertise
LIST OF TABLES
Table 1 Market Segmentation Analysis
Table 2 Global Microbial Coagulant Market Share of Leading Companies, 2023
Table 3 Product Offerings of Leading Companies
Table 4 Low Growth Scenario Forecasts
Table 5 Reference Case Growth Scenario
Table 6 High Growth Case Scenario
Table 7 Global Microbial Coagulant Revenue (USD Million) And CAGR (%) By Type (2021-2032)
Table 8 Global Microbial Coagulant Revenue (USD Million) And CAGR (%) By Application (2021-2032)
Table 9 Global Microbial Coagulant Revenue (USD Million) And CAGR (%) By Product (2021-2032)
Table 10 Global Microbial Coagulant Market Revenue (USD Million) By Regions (2021-2032)
Table 11 Global Microbial Coagulant Market Share (%) By Regions (2021-2032)
Table 12 North America Microbial Coagulant Revenue (USD Million) By Country (2021-2032)
Table 13 Europe Microbial Coagulant Revenue (USD Million) By Country (2021-2032)
Table 14 Asia Pacific Microbial Coagulant Revenue (USD Million) By Country (2021-2032)
Table 15 South America Microbial Coagulant Revenue (USD Million) By Country (2021-2032)
Table 16 Middle East and Africa Microbial Coagulant Revenue (USD Million) By Region (2021-2032)
Table 17 North America Microbial Coagulant Revenue (USD Million) By Type (2021-2032)
Table 18 North America Microbial Coagulant Revenue (USD Million) By Application (2021-2032)
Table 19 North America Microbial Coagulant Revenue (USD Million) By Product (2021-2032)
Table 20 Europe Microbial Coagulant Revenue (USD Million) By Type (2021-2032)
Table 21 Europe Microbial Coagulant Revenue (USD Million) By Application (2021-2032)
Table 22 Europe Microbial Coagulant Revenue (USD Million) By Product (2021-2032)
Table 23 Asia Pacific Microbial Coagulant Revenue (USD Million) By Type (2021-2032)
Table 24 Asia Pacific Microbial Coagulant Revenue (USD Million) By Application (2021-2032)
Table 25 Asia Pacific Microbial Coagulant Revenue (USD Million) By Product (2021-2032)
Table 26 South America Microbial Coagulant Revenue (USD Million) By Type (2021-2032)
Table 27 South America Microbial Coagulant Revenue (USD Million) By Application (2021-2032)
Table 28 South America Microbial Coagulant Revenue (USD Million) By Product (2021-2032)
Table 29 Middle East and Africa Microbial Coagulant Revenue (USD Million) By Type (2021-2032)
Table 30 Middle East and Africa Microbial Coagulant Revenue (USD Million) By Application (2021-2032)
Table 31 Middle East and Africa Microbial Coagulant Revenue (USD Million) By Product (2021-2032)
LIST OF FIGURES
Figure 1. Market Scope
Figure 2. Pricing Forecasts Per Unit, 2023- 2032
Figure 3. Porter’s Five Forces
Figure 4. Global Microbial Coagulant Market Revenue (USD Million) By Regions (2021-2032)
Figure 5. Global Microbial Coagulant Market Share (%) By Regions (2023)
Figure 6. North America Microbial Coagulant Revenue (USD Million) By Country (2021-2032)
Figure 7. United States Microbial Coagulant Revenue (USD Million) By Country (2021-2032)
Figure 8. Canada Microbial Coagulant Revenue (USD Million) By Country (2021-2032)
Figure 9. Mexico Microbial Coagulant Revenue (USD Million) By Country (2021-2032)
Figure 10. Europe Microbial Coagulant Revenue (USD Million) By Country (2021-2032)
Figure 11. Germany Microbial Coagulant Revenue (USD Million) By Country (2021-2032)
Figure 12. France Microbial Coagulant Revenue (USD Million) By Country (2021-2032)
Figure 13. United Kingdom Microbial Coagulant Revenue (USD Million) By Country (2021-2032)
Figure 14. Spain Microbial Coagulant Revenue (USD Million) By Country (2021-2032)
Figure 15. Italy Microbial Coagulant Revenue (USD Million) By Country (2021-2032)
Figure 16. Russia Microbial Coagulant Revenue (USD Million) By Country (2021-2032)
Figure 17. Rest of Europe Microbial Coagulant Revenue (USD Million) By Country (2021-2032)
Figure 11. Asia Pacific Microbial Coagulant Revenue (USD Million) By Country (2021-2032)
Figure 12. China Microbial Coagulant Revenue (USD Million) By Country (2021-2032)
Figure 13. Japan Microbial Coagulant Revenue (USD Million) By Country (2021-2032)
Figure 14. India Microbial Coagulant Revenue (USD Million) By Country (2021-2032)
Figure 15. South Korea Microbial Coagulant Revenue (USD Million) By Country (2021-2032)
Figure 16. Australia Microbial Coagulant Revenue (USD Million) By Country (2021-2032)
Figure 17. South East Asia Microbial Coagulant Revenue (USD Million) By Country (2021-2032)
Figure 18. South America Microbial Coagulant Revenue (USD Million) By Country (2021-2032)
Figure 19. Brazil Microbial Coagulant Revenue (USD Million) By Country (2021-2032)
Figure 20. Argentina Microbial Coagulant Revenue (USD Million) By Country (2021-2032)
Figure 21. Rest of Asia Pacific Microbial Coagulant Revenue (USD Million) By Country (2021-2032)
Figure 22. Middle East and Africa Microbial Coagulant Revenue (USD Million) By Region (2021-2032)
Figure 23. Saudi Arabia Microbial Coagulant Revenue (USD Million) By Region (2021-2032)
Figure 24. The UAE Microbial Coagulant Revenue (USD Million) By Region (2021-2032)
Figure 25. Rest of Middle East Microbial Coagulant Revenue (USD Million) By Region (2021-2032)
Figure 26. South Africa Microbial Coagulant Revenue (USD Million) By Region (2021-2032)
Figure 27. Africa Microbial Coagulant Revenue (USD Million) By Region (2021-2032)
Figure 28. North America Microbial Coagulant Revenue (USD Million) By Type (2021-2032)
Figure 29. North America Microbial Coagulant Revenue (USD Million) By Application (2021-2032)
Figure 30. North America Microbial Coagulant Revenue (USD Million) By Product (2021-2032)
Figure 31. Europe Microbial Coagulant Revenue (USD Million) By Type (2021-2032)
Figure 32. Europe Microbial Coagulant Revenue (USD Million) By Application (2021-2032)
Figure 33. Europe Microbial Coagulant Revenue (USD Million) By Product (2021-2032)
Figure 34. Asia Pacific Microbial Coagulant Revenue (USD Million) By Type (2021-2032)
Figure 35. Asia Pacific Microbial Coagulant Revenue (USD Million) By Application (2021-2032)
Figure 36. Asia Pacific Microbial Coagulant Revenue (USD Million) By Product (2021-2032)
Figure 37. South America Microbial Coagulant Revenue (USD Million) By Type (2021-2032)
Figure 38. South America Microbial Coagulant Revenue (USD Million) By Application (2021-2032)
Figure 39. South America Microbial Coagulant Revenue (USD Million) By Product (2021-2032)
Figure 40. Middle East and Africa Microbial Coagulant Revenue (USD Million) By Type (2021-2032)
Figure 41. Middle East and Africa Microbial Coagulant Revenue (USD Million) By Application (2021-2032)
Figure 42. Middle East and Africa Microbial Coagulant Revenue (USD Million) By Product (2021-2032)
By Type
Liquid
Dry
By Application
Supermarkets/Hypermarkets
Convenience Stores
Specialty Stores
Online Retail
Others
Countries Analyzed
North America (US, Canada, Mexico)
Europe (Germany, UK, France, Spain, Italy, Russia, Rest of Europe)
Asia Pacific (China, India, Japan, South Korea, Australia, South East Asia, Rest of Asia)
South America (Brazil, Argentina, Rest of South America)
Middle East and Africa (Saudi Arabia, UAE, Rest of Middle East, South Africa, Egypt, Rest of Africa)
