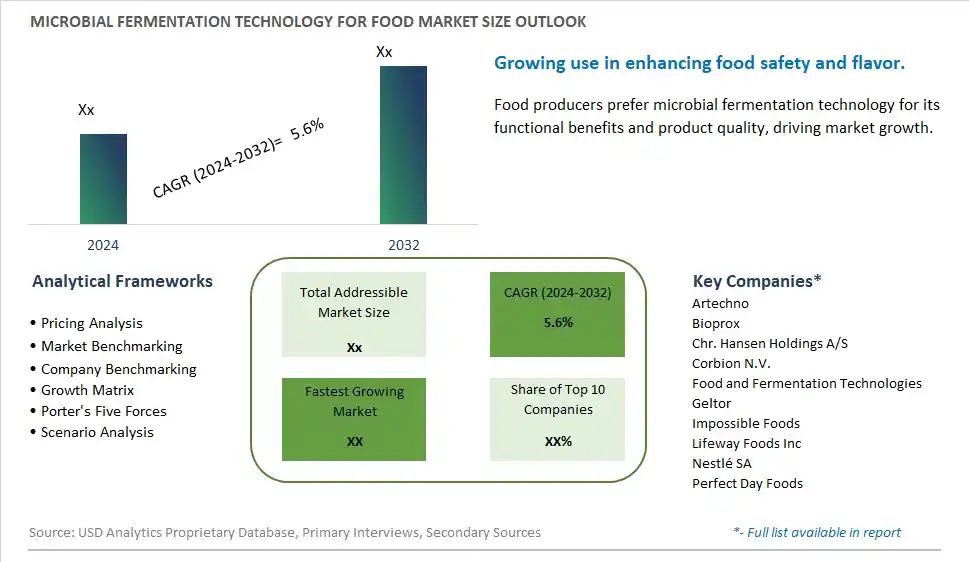
Global Microbial Fermentation Technology for Food Market Size is valued at $XX Million in 2024 and is forecast to register a growth rate (CAGR) of 5.6% to reach $XX Million by 2032.
The global Microbial Fermentation Technology for Food Market Comprehensive Study analyzes and forecasts the market size across 6 regions and 24 countries for diverse segments -By Type (Animal Protein Production, Plant Protein Production, Others), By Application (Food Industry, Feed, Others)
An Introduction to Microbial Fermentation Technology for Food Market
In 2024, the microbial fermentation technology for food market is expanding rapidly, driven by the demand for high-quality fermented foods and ingredients. Microbial fermentation technology, which uses beneficial microbes to enhance food flavor, texture, and nutritional value, is widely applied in the production of dairy products, bread, and beverages. The market benefits from innovations in fermentation processes and microbial strain development that improve efficiency and product quality. The trend towards clean label and natural foods is influencing market dynamics. Increasing consumer interest in probiotic-rich and functional foods is further propelling market growth.
Microbial Fermentation Technology for Food Competitive Landscape
The market report analyses the leading companies in the industry including Artechno, Bioprox, Chr. Hansen Holdings A/S, Corbion N.V., Food and Fermentation Technologies, Geltor, Impossible Foods, Lifeway Foods Inc, Nestlé SA, Perfect Day Foods, and Others.
Microbial Fermentation Technology for Food Market Dynamics
Microbial Fermentation Technology for Food Market Trend: Increasing Use of Fermentation in Food Production
The most prominent trend in the Microbial Fermentation Technology for Food Market is the increasing use of fermentation in food production. Fermentation technology is being leveraged to produce a variety of food products, including probiotics, fermented beverages, and plant-based meats, driven by the demand for functional and innovative foods.
Microbial Fermentation Technology for Food Market Driver: Health Benefits of Fermented Foods
A key driver in the Microbial Fermentation Technology for Food Market is the health benefits of fermented foods. Fermented foods are known for their probiotic content and potential to improve gut health, boosting consumer interest and market demand.
Microbial Fermentation Technology for Food Market Opportunity: Expansion into Alternative Protein Production
One significant opportunity in the Microbial Fermentation Technology for Food Market lies in the expansion into alternative protein production. Companies can use fermentation technology to create high-quality plant-based and microbial proteins that cater to the growing market for sustainable and nutritious protein sources. By focusing on alternative proteins, manufacturers can attract health-conscious and environmentally aware consumers.
Microbial Fermentation Technology for Food Market Share Analysis- Largest Segment by Type
The Plant Protein Production segment is the largest in the Microbial Fermentation Technology for Food Market by type. This dominance is driven by the high consumer demand for sustainable and plant-based protein sources that offer a viable alternative to animal proteins. Microbial fermentation technology is widely used to produce plant-based proteins with enhanced nutritional profiles and functional properties. The continuous innovation in plant protein fermentation processes, including the development of new strains and fermentation techniques, enhances their appeal. Additionally, the growing trend of plant-based diets supports the significant market share of the plant protein production segment, as consumers seek protein sources that align with their dietary preferences and environmental concerns. The extensive availability of plant-based protein products in various food categories, such as meat substitutes, dairy alternatives, and protein supplements, further boosts their market share. The strong consumer preference for sustainable and healthful protein sources reinforces the dominant position of the plant protein production segment in the market.
Microbial Fermentation Technology for Food Market Share Analysis- Fastest Growing Segment by Application
The Food Industry segment is poised to grow the fastest in the Microbial Fermentation Technology for Food Market by application over the next five years. This rapid growth is driven by the increasing demand for sustainable and efficient food production methods that enhance nutritional content and product quality. Microbial fermentation technology is widely used to develop novel food ingredients, enhance flavors, and improve the shelf life of food products. The continuous innovation in fermentation processes, including the use of genetically engineered microbes and precision fermentation, enhances the appeal of this technology in the food industry. Additionally, the growing consumer preference for clean-label and naturally fermented foods supports the fast growth of the food industry segment, as it aligns with the trend towards healthier and more sustainable food choices. The influence of regulatory approvals and the adoption of fermentation technology by major food manufacturers further contribute to the rapid growth of this segment.
Microbial Fermentation Technology for Food Market Segmentation
By Type
Animal Protein Production
Plant Protein Production
Others
By Application
Food Industry
Feed
Others
Countries Analyzed
North America (US, Canada, Mexico)
Europe (Germany, UK, France, Spain, Italy, Russia, Rest of Europe)
Asia Pacific (China, India, Japan, South Korea, Australia, South East Asia, Rest of Asia)
South America (Brazil, Argentina, Rest of South America)
Middle East and Africa (Saudi Arabia, UAE, Rest of Middle East, South Africa, Egypt, Rest of Africa)
Microbial Fermentation Technology for Food Companies Profiled in the Study
Artechno
Bioprox
Chr. Hansen Holdings A/S
Corbion N.V.
Food and Fermentation Technologies
Geltor
Impossible Foods
Lifeway Foods Inc
Nestlé SA
Perfect Day Foods
*- List Not Exhaustive
Chapter 1. TABLE OF CONTENTS
Chapter 2. Introduction to Microbial Fermentation Technology for Food Market
2.1. Market Overview
2.2. Key Statistics and Report Highlights
2.3. Scope of the Comprehensive Study
2.3.1. Market Definition
2.3.2 Countries and Regions Covered
2.3.3 Research Objective
2.3.4 Units, Currency, and Conversions
2.3.5 Industry Value Chain
2.4. Key Market Segments
2.5. Key Companies
2.6. Study Period
Chapter 3. Strategic Analysis Review
3.1. Microbial Fermentation Technology for Food Pricing Analysis and Forecast
3.2. Porter’s Five Forces
3.3. Market Ecosystem
3.4. SWOT Analysis
3.5. Regulatory Scenario
3.3. Effects of Inflation, Russia-Ukraine War, moderating economic growth, and other macroeconomic factors
Chapter 4. Competitive Landscape
4.1. Market Share Analysis
4.1.1. Global Microbial Fermentation Technology for Food Market Share by Company, 2023
4.1.2. Product Offerings of Leading Microbial Fermentation Technology for Food Companies
4.2. Market Entropy
4.2.1. New Product Launches in the Industry
4.2.2. Mergers, Acquisitions, Joint ventures, and Partnerships
4.3. Key Strategies and Best Practices
Chapter 5. Global Market Projections: Best, Reference, and Low Case Scenarios
5.1. Growth Analysis- Case Scenario Definitions
5.2. Low Growth Case Scenario Forecasts
5.3. Reference Growth Case Scenario Forecasts
5.4. High Growth Case Scenario Forecasts
Chapter 6. Market Dynamics
6.1. Microbial Fermentation Technology for Food Market Drivers
6.2. Microbial Fermentation Technology for Food Market Challenges
6.6. Microbial Fermentation Technology for Food Market Opportunities
6.4. Microbial Fermentation Technology for Food Market Trends
Chapter 7. Global Microbial Fermentation Technology for Food Market Outlook Trends
7.1. Global Microbial Fermentation Technology for Food Revenue (USD Million) and CAGR (%) by Type (2021-2032)
7.2. Global Microbial Fermentation Technology for Food Revenue (USD Million) and CAGR (%) by Application (2021-2032)
7.3. Global Microbial Fermentation Technology for Food Revenue (USD Million) and CAGR (%) by Product (2021-2032)
By Type
Animal Protein Production
Plant Protein Production
Others
By Application
Food Industry
Feed
Others
Chapter 8. Global Microbial Fermentation Technology for Food Regional Analysis and Outlook
8.1. Global Microbial Fermentation Technology for Food Revenue (USD Million) By Regions (2021- 2032)
8.2. North America Microbial Fermentation Technology for Food Revenue (USD Million) by Country (2021-2032)
8.2.1. United States Microbial Fermentation Technology for Food Regional Analysis and Outlook
8.2.2. Canada Microbial Fermentation Technology for Food Regional Analysis and Outlook
8.2.3. Mexico Microbial Fermentation Technology for Food Regional Analysis and Outlook
8.3. Europe Microbial Fermentation Technology for Food Revenue (USD Million), by Country (2021-2032)
8.3.1. Germany Microbial Fermentation Technology for Food Regional Analysis and Outlook
8.3.2. France Microbial Fermentation Technology for Food Regional Analysis and Outlook
8.3.3. United Kingdom Microbial Fermentation Technology for Food Regional Analysis and Outlook
8.3.4. Spain Microbial Fermentation Technology for Food Regional Analysis and Outlook
8.3.5. Italy Microbial Fermentation Technology for Food Regional Analysis and Outlook
8.3.6. Russia Microbial Fermentation Technology for Food Regional Analysis and Outlook
8.3.7. Rest of Europe Microbial Fermentation Technology for Food Regional Analysis and Outlook
8.4. Asia Pacific Microbial Fermentation Technology for Food Revenue (USD Million) by Country (2021-2032)
8.4.1. China Microbial Fermentation Technology for Food Regional Analysis and Outlook
8.4.2. Japan Microbial Fermentation Technology for Food Regional Analysis and Outlook
8.4.3. India Microbial Fermentation Technology for Food Regional Analysis and Outlook
8.4.4. South Korea Microbial Fermentation Technology for Food Regional Analysis and Outlook
8.4.5. Australia Microbial Fermentation Technology for Food Regional Analysis and Outlook
8.4.6. South East Asia Microbial Fermentation Technology for Food Regional Analysis and Outlook
8.4.7. Rest of Asia Pacific Microbial Fermentation Technology for Food Regional Analysis and Outlook
8.5. South America Microbial Fermentation Technology for Food Revenue (USD Million), by Country (2021-2032)
8.5.1. Brazil Microbial Fermentation Technology for Food Regional Analysis and Outlook
8.5.2. Argentina Microbial Fermentation Technology for Food Regional Analysis and Outlook
8.5.3. Rest of South America Microbial Fermentation Technology for Food Regional Analysis and Outlook
8.6. Middle East and Africa Microbial Fermentation Technology for Food Revenue (USD Million) by Country (2021-2032)
8.6.1. Middle East Microbial Fermentation Technology for Food Regional Analysis and Outlook
8.6.2. Africa Microbial Fermentation Technology for Food Regional Analysis and Outlook
Chapter 9. North America Microbial Fermentation Technology for Food Analysis and Outlook
9.1. North America Microbial Fermentation Technology for Food Revenue (USD Million) by Segments (2021-2032)
9.1.1. North America Microbial Fermentation Technology for Food Revenue (USD Million) by Type (2021-2032)
9.1.2. North America Microbial Fermentation Technology for Food Revenue (USD Million) by Application (2021-2032)
9.1.3. North America Microbial Fermentation Technology for Food Revenue (USD Million) by Product (2021-2032)
By Type
Animal Protein Production
Plant Protein Production
Others
By Application
Food Industry
Feed
Others
Chapter 10. Europe Microbial Fermentation Technology for Food Analysis and Outlook
10.1. Europe Microbial Fermentation Technology for Food Revenue (USD Million), by Segments (USD Million) (2021-2032)
10.1.1. Europe Microbial Fermentation Technology for Food Revenue (USD Million) by Type (2021-2032)
10.1.2. Europe Microbial Fermentation Technology for Food Revenue (USD Million) by Application (2021-2032)
10.1.3. Europe Microbial Fermentation Technology for Food Revenue (USD Million) by Product (2021-2032)
By Type
Animal Protein Production
Plant Protein Production
Others
By Application
Food Industry
Feed
Others
Chapter 11. Asia Pacific Microbial Fermentation Technology for Food Analysis and Outlook
11.1. Asia Pacific Microbial Fermentation Technology for Food Revenue (USD Million), and Revenue (USD Million) by Segments (2021-2032)
11.1.1. Asia Pacific Microbial Fermentation Technology for Food Revenue (USD Million) by Type (2021-2032)
11.1.2. Asia Pacific Microbial Fermentation Technology for Food Revenue (USD Million) by Application (2021-2032)
11.1.3. Asia Pacific Microbial Fermentation Technology for Food Revenue (USD Million) by Product (2021-2032)
By Type
Animal Protein Production
Plant Protein Production
Others
By Application
Food Industry
Feed
Others
Chapter 12. South America Microbial Fermentation Technology for Food Analysis and Outlook
12.1. South America Microbial Fermentation Technology for Food Revenue (USD Million), by Segments (2021-2032)
12.1.1. South America Microbial Fermentation Technology for Food Revenue (USD Million) by Type (2021-2032)
12.1.2. South America Microbial Fermentation Technology for Food Revenue (USD Million) by Application (2021-2032)
12.1.3. South America Microbial Fermentation Technology for Food Revenue (USD Million) by Product (2021-2032)
By Type
Animal Protein Production
Plant Protein Production
Others
By Application
Food Industry
Feed
Others
Chapter 13. Middle East and Africa Microbial Fermentation Technology for Food Analysis and Outlook
13.1. Middle East and Africa Microbial Fermentation Technology for Food Revenue (USD Million), by Segments (2021-2032)
13.1.1. Middle East and Africa Microbial Fermentation Technology for Food Revenue (USD Million) by Type (2021-2032)
13.1.2. Middle East and Africa Microbial Fermentation Technology for Food Revenue (USD Million) by Application (2021-2032)
13.1.3. Middle East and Africa Microbial Fermentation Technology for Food Revenue (USD Million) by Product (2021-2032)
By Type
Animal Protein Production
Plant Protein Production
Others
By Application
Food Industry
Feed
Others
Chapter 14. Microbial Fermentation Technology for Food Company Profiles
14.1 Business Overview
14.2 Product Profiles
14.3 SWOT Profiles
14.5 Recent Developments
14.6 Financial Profile
List of Companies
Artechno
Bioprox
Chr. Hansen Holdings A/S
Corbion N.V.
Food and Fermentation Technologies
Geltor
Impossible Foods
Lifeway Foods Inc
Nestlé SA
Perfect Day Foods
15. Methodology and Data Sources
15.1 Customization Offerings
15.2 Subscription Services
15.3 Related Reports
15.4 Publisher Expertise
LIST OF TABLES
Table 1 Market Segmentation Analysis
Table 2 Global Microbial Fermentation Technology for Food Market Share of Leading Companies, 2023
Table 3 Product Offerings of Leading Companies
Table 4 Low Growth Scenario Forecasts
Table 5 Reference Case Growth Scenario
Table 6 High Growth Case Scenario
Table 7 Global Microbial Fermentation Technology for Food Revenue (USD Million) And CAGR (%) By Type (2021-2032)
Table 8 Global Microbial Fermentation Technology for Food Revenue (USD Million) And CAGR (%) By Application (2021-2032)
Table 9 Global Microbial Fermentation Technology for Food Revenue (USD Million) And CAGR (%) By Product (2021-2032)
Table 10 Global Microbial Fermentation Technology for Food Market Revenue (USD Million) By Regions (2021-2032)
Table 11 Global Microbial Fermentation Technology for Food Market Share (%) By Regions (2021-2032)
Table 12 North America Microbial Fermentation Technology for Food Revenue (USD Million) By Country (2021-2032)
Table 13 Europe Microbial Fermentation Technology for Food Revenue (USD Million) By Country (2021-2032)
Table 14 Asia Pacific Microbial Fermentation Technology for Food Revenue (USD Million) By Country (2021-2032)
Table 15 South America Microbial Fermentation Technology for Food Revenue (USD Million) By Country (2021-2032)
Table 16 Middle East and Africa Microbial Fermentation Technology for Food Revenue (USD Million) By Region (2021-2032)
Table 17 North America Microbial Fermentation Technology for Food Revenue (USD Million) By Type (2021-2032)
Table 18 North America Microbial Fermentation Technology for Food Revenue (USD Million) By Application (2021-2032)
Table 19 North America Microbial Fermentation Technology for Food Revenue (USD Million) By Product (2021-2032)
Table 20 Europe Microbial Fermentation Technology for Food Revenue (USD Million) By Type (2021-2032)
Table 21 Europe Microbial Fermentation Technology for Food Revenue (USD Million) By Application (2021-2032)
Table 22 Europe Microbial Fermentation Technology for Food Revenue (USD Million) By Product (2021-2032)
Table 23 Asia Pacific Microbial Fermentation Technology for Food Revenue (USD Million) By Type (2021-2032)
Table 24 Asia Pacific Microbial Fermentation Technology for Food Revenue (USD Million) By Application (2021-2032)
Table 25 Asia Pacific Microbial Fermentation Technology for Food Revenue (USD Million) By Product (2021-2032)
Table 26 South America Microbial Fermentation Technology for Food Revenue (USD Million) By Type (2021-2032)
Table 27 South America Microbial Fermentation Technology for Food Revenue (USD Million) By Application (2021-2032)
Table 28 South America Microbial Fermentation Technology for Food Revenue (USD Million) By Product (2021-2032)
Table 29 Middle East and Africa Microbial Fermentation Technology for Food Revenue (USD Million) By Type (2021-2032)
Table 30 Middle East and Africa Microbial Fermentation Technology for Food Revenue (USD Million) By Application (2021-2032)
Table 31 Middle East and Africa Microbial Fermentation Technology for Food Revenue (USD Million) By Product (2021-2032)
LIST OF FIGURES
Figure 1. Market Scope
Figure 2. Pricing Forecasts Per Unit, 2023- 2032
Figure 3. Porter’s Five Forces
Figure 4. Global Microbial Fermentation Technology for Food Market Revenue (USD Million) By Regions (2021-2032)
Figure 5. Global Microbial Fermentation Technology for Food Market Share (%) By Regions (2023)
Figure 6. North America Microbial Fermentation Technology for Food Revenue (USD Million) By Country (2021-2032)
Figure 7. United States Microbial Fermentation Technology for Food Revenue (USD Million) By Country (2021-2032)
Figure 8. Canada Microbial Fermentation Technology for Food Revenue (USD Million) By Country (2021-2032)
Figure 9. Mexico Microbial Fermentation Technology for Food Revenue (USD Million) By Country (2021-2032)
Figure 10. Europe Microbial Fermentation Technology for Food Revenue (USD Million) By Country (2021-2032)
Figure 11. Germany Microbial Fermentation Technology for Food Revenue (USD Million) By Country (2021-2032)
Figure 12. France Microbial Fermentation Technology for Food Revenue (USD Million) By Country (2021-2032)
Figure 13. United Kingdom Microbial Fermentation Technology for Food Revenue (USD Million) By Country (2021-2032)
Figure 14. Spain Microbial Fermentation Technology for Food Revenue (USD Million) By Country (2021-2032)
Figure 15. Italy Microbial Fermentation Technology for Food Revenue (USD Million) By Country (2021-2032)
Figure 16. Russia Microbial Fermentation Technology for Food Revenue (USD Million) By Country (2021-2032)
Figure 17. Rest of Europe Microbial Fermentation Technology for Food Revenue (USD Million) By Country (2021-2032)
Figure 11. Asia Pacific Microbial Fermentation Technology for Food Revenue (USD Million) By Country (2021-2032)
Figure 12. China Microbial Fermentation Technology for Food Revenue (USD Million) By Country (2021-2032)
Figure 13. Japan Microbial Fermentation Technology for Food Revenue (USD Million) By Country (2021-2032)
Figure 14. India Microbial Fermentation Technology for Food Revenue (USD Million) By Country (2021-2032)
Figure 15. South Korea Microbial Fermentation Technology for Food Revenue (USD Million) By Country (2021-2032)
Figure 16. Australia Microbial Fermentation Technology for Food Revenue (USD Million) By Country (2021-2032)
Figure 17. South East Asia Microbial Fermentation Technology for Food Revenue (USD Million) By Country (2021-2032)
Figure 18. South America Microbial Fermentation Technology for Food Revenue (USD Million) By Country (2021-2032)
Figure 19. Brazil Microbial Fermentation Technology for Food Revenue (USD Million) By Country (2021-2032)
Figure 20. Argentina Microbial Fermentation Technology for Food Revenue (USD Million) By Country (2021-2032)
Figure 21. Rest of Asia Pacific Microbial Fermentation Technology for Food Revenue (USD Million) By Country (2021-2032)
Figure 22. Middle East and Africa Microbial Fermentation Technology for Food Revenue (USD Million) By Region (2021-2032)
Figure 23. Saudi Arabia Microbial Fermentation Technology for Food Revenue (USD Million) By Region (2021-2032)
Figure 24. The UAE Microbial Fermentation Technology for Food Revenue (USD Million) By Region (2021-2032)
Figure 25. Rest of Middle East Microbial Fermentation Technology for Food Revenue (USD Million) By Region (2021-2032)
Figure 26. South Africa Microbial Fermentation Technology for Food Revenue (USD Million) By Region (2021-2032)
Figure 27. Africa Microbial Fermentation Technology for Food Revenue (USD Million) By Region (2021-2032)
Figure 28. North America Microbial Fermentation Technology for Food Revenue (USD Million) By Type (2021-2032)
Figure 29. North America Microbial Fermentation Technology for Food Revenue (USD Million) By Application (2021-2032)
Figure 30. North America Microbial Fermentation Technology for Food Revenue (USD Million) By Product (2021-2032)
Figure 31. Europe Microbial Fermentation Technology for Food Revenue (USD Million) By Type (2021-2032)
Figure 32. Europe Microbial Fermentation Technology for Food Revenue (USD Million) By Application (2021-2032)
Figure 33. Europe Microbial Fermentation Technology for Food Revenue (USD Million) By Product (2021-2032)
Figure 34. Asia Pacific Microbial Fermentation Technology for Food Revenue (USD Million) By Type (2021-2032)
Figure 35. Asia Pacific Microbial Fermentation Technology for Food Revenue (USD Million) By Application (2021-2032)
Figure 36. Asia Pacific Microbial Fermentation Technology for Food Revenue (USD Million) By Product (2021-2032)
Figure 37. South America Microbial Fermentation Technology for Food Revenue (USD Million) By Type (2021-2032)
Figure 38. South America Microbial Fermentation Technology for Food Revenue (USD Million) By Application (2021-2032)
Figure 39. South America Microbial Fermentation Technology for Food Revenue (USD Million) By Product (2021-2032)
Figure 40. Middle East and Africa Microbial Fermentation Technology for Food Revenue (USD Million) By Type (2021-2032)
Figure 41. Middle East and Africa Microbial Fermentation Technology for Food Revenue (USD Million) By Application (2021-2032)
Figure 42. Middle East and Africa Microbial Fermentation Technology for Food Revenue (USD Million) By Product (2021-2032)
By Type
Animal Protein Production
Plant Protein Production
Others
By Application
Food Industry
Feed
Others
Countries Analyzed
North America (US, Canada, Mexico)
Europe (Germany, UK, France, Spain, Italy, Russia, Rest of Europe)
Asia Pacific (China, India, Japan, South Korea, Australia, South East Asia, Rest of Asia)
South America (Brazil, Argentina, Rest of South America)
Middle East and Africa (Saudi Arabia, UAE, Rest of Middle East, South Africa, Egypt, Rest of Africa)
