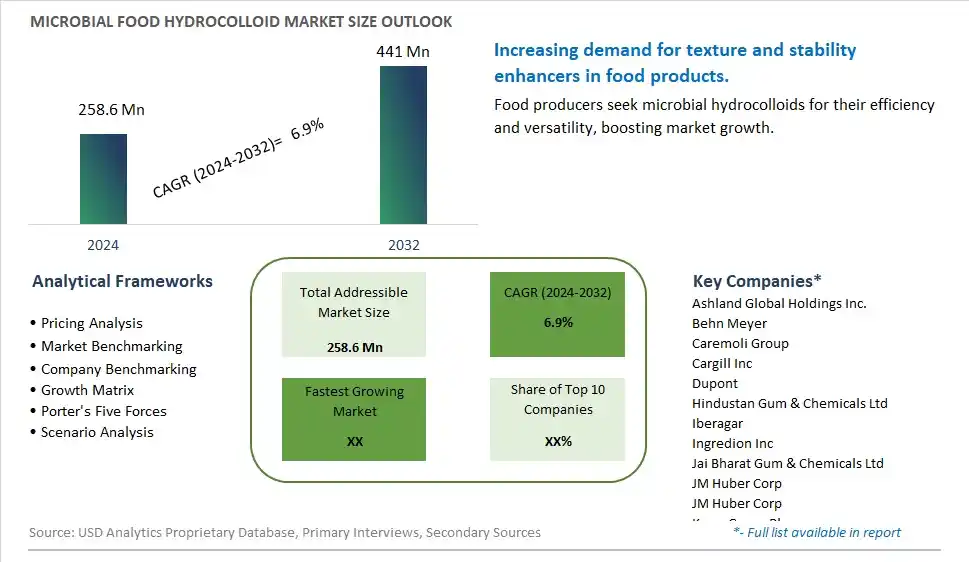
Global Microbial Food Hydrocolloid Market Size is valued at $258.6 Million in 2024 and is forecast to register a growth rate (CAGR) of 6.9% to reach $441 Million by 2032.
The global Microbial Food Hydrocolloid Market Comprehensive Study analyzes and forecasts the market size across 6 regions and 24 countries for diverse segments -By Type (Carboxymethylcellulose, Gelatin, Guar Gum, Gum Acacia, Xanthan Gum, Others), By Application (Bakery & Confectionery, Meat & Poultry, Sauces & Dressings, Beverages, Dairy Products, Others)
An Introduction to Microbial Food Hydrocolloid Market
The microbial food hydrocolloid market in 2024 is thriving, fueled by the demand for natural and functional ingredients that improve the texture and stability of food products. Microbial hydrocolloids, such as xanthan gum and gellan gum, are used as thickening, gelling, and stabilizing agents in various food applications. The market benefits from advancements in microbial fermentation and extraction technologies that enhance product quality and functionality. The trend towards clean label and natural ingredients is influencing product development. Increasing consumer interest in plant-based and gluten-free foods is further supporting market growth.
Microbial Food Hydrocolloid Competitive Landscape
The market report analyses the leading companies in the industry including Ashland Global Holdings Inc., Behn Meyer, Caremoli Group, Cargill Inc, Dupont, Hindustan Gum & Chemicals Ltd, Iberagar, Ingredion Inc, Jai Bharat Gum & Chemicals Ltd, JM Huber Corp, JM Huber Corp, Kerry Group Plc, Koninklijke DSM N.V., Meihua, The Kraft Heinz Company, and Others.
Microbial Food Hydrocolloid Market Dynamics
Microbial Food Hydrocolloid Market Trend: Increasing Demand for Natural Food Additives
The most prominent trend in the Microbial Food Hydrocolloid Market is the increasing demand for natural food additives. Microbial hydrocolloids, such as xanthan gum and gellan gum, are used to improve the texture, stability, and shelf life of food products, driven by consumer preference for natural and clean label ingredients.
Microbial Food Hydrocolloid Market Driver: Growth of the Processed Food Industry
A key driver in the Microbial Food Hydrocolloid Market is the growth of the processed food industry. As the demand for convenience foods and ready-to-eat meals continues to rise, there is an increasing need for hydrocolloids that enhance the quality and appeal of these products.
Microbial Food Hydrocolloid Market Opportunity: Innovation in Hydrocolloid Applications
One significant opportunity in the Microbial Food Hydrocolloid Market lies in innovation in hydrocolloid applications. Companies can develop new hydrocolloid formulations that cater to specific food products, such as gluten-free baked goods, plant-based dairy alternatives, and functional beverages. By offering versatile and high-performance hydrocolloids, manufacturers can attract a broader range of food producers and drive market growth.
Microbial Food Hydrocolloid Market Share Analysis- Largest Segment by Type
The Xanthan Gum segment is the largest in the Microbial Food Hydrocolloid Market by type. This dominance is driven by the high demand for xanthan gum as a versatile and effective thickening and stabilizing agent in the food industry. Xanthan gum is widely used in various food applications, including sauces, dressings, bakery products, and dairy products, due to its ability to provide desirable texture and consistency. The continuous innovation in xanthan gum production and its compatibility with various food formulations enhance its appeal. Additionally, the extensive availability of xanthan gum in the market and its cost-effectiveness further boost its market share. The strong consumer preference for products with consistent texture and stability reinforces the dominant position of the xanthan gum segment in the market.
Microbial Food Hydrocolloid Market Share Analysis- Fastest Growing Segment by Application
The Dairy Products segment is poised to grow the fastest in the Microbial Food Hydrocolloid Market by application over the next five years. This rapid growth is driven by the increasing demand for hydrocolloids in dairy products to improve texture, stability, and shelf life. Hydrocolloids such as gelatin, xanthan gum, and guar gum are essential in the formulation of various dairy products, including yogurt, cheese, and ice cream, for their thickening, gelling, and stabilizing properties. The continuous innovation in hydrocolloid applications and the development of new formulations that enhance the sensory attributes of dairy products support the fast growth of this segment. Additionally, the growing trend of functional and fortified dairy products supports the demand for hydrocolloids in the dairy industry. The influence of consumer preferences for high-quality and stable dairy products further contributes to the rapid growth of the dairy products segment.
Microbial Food Hydrocolloid Market Segmentation
By Type
Carboxymethylcellulose
Gelatin
Guar Gum
Gum Acacia
Xanthan Gum
Others
By Application
Bakery & Confectionery
Meat & Poultry
Sauces & Dressings
Beverages
Dairy Products
Others
Countries Analyzed
North America (US, Canada, Mexico)
Europe (Germany, UK, France, Spain, Italy, Russia, Rest of Europe)
Asia Pacific (China, India, Japan, South Korea, Australia, South East Asia, Rest of Asia)
South America (Brazil, Argentina, Rest of South America)
Middle East and Africa (Saudi Arabia, UAE, Rest of Middle East, South Africa, Egypt, Rest of Africa)
Microbial Food Hydrocolloid Companies Profiled in the Study
Ashland Global Holdings Inc.
Behn Meyer
Caremoli Group
Cargill Inc
Dupont
Hindustan Gum & Chemicals Ltd
Iberagar
Ingredion Inc
Jai Bharat Gum & Chemicals Ltd
JM Huber Corp
JM Huber Corp
Kerry Group Plc
Koninklijke DSM N.V.
Meihua
The Kraft Heinz Company
*- List Not Exhaustive
Chapter 1. TABLE OF CONTENTS
Chapter 2. Introduction to Microbial Food Hydrocolloid Market
2.1. Market Overview
2.2. Key Statistics and Report Highlights
2.3. Scope of the Comprehensive Study
2.3.1. Market Definition
2.3.2 Countries and Regions Covered
2.3.3 Research Objective
2.3.4 Units, Currency, and Conversions
2.3.5 Industry Value Chain
2.4. Key Market Segments
2.5. Key Companies
2.6. Study Period
Chapter 3. Strategic Analysis Review
3.1. Microbial Food Hydrocolloid Pricing Analysis and Forecast
3.2. Porter’s Five Forces
3.3. Market Ecosystem
3.4. SWOT Analysis
3.5. Regulatory Scenario
3.3. Effects of Inflation, Russia-Ukraine War, moderating economic growth, and other macroeconomic factors
Chapter 4. Competitive Landscape
4.1. Market Share Analysis
4.1.1. Global Microbial Food Hydrocolloid Market Share by Company, 2023
4.1.2. Product Offerings of Leading Microbial Food Hydrocolloid Companies
4.2. Market Entropy
4.2.1. New Product Launches in the Industry
4.2.2. Mergers, Acquisitions, Joint ventures, and Partnerships
4.3. Key Strategies and Best Practices
Chapter 5. Global Market Projections: Best, Reference, and Low Case Scenarios
5.1. Growth Analysis- Case Scenario Definitions
5.2. Low Growth Case Scenario Forecasts
5.3. Reference Growth Case Scenario Forecasts
5.4. High Growth Case Scenario Forecasts
Chapter 6. Market Dynamics
6.1. Microbial Food Hydrocolloid Market Drivers
6.2. Microbial Food Hydrocolloid Market Challenges
6.6. Microbial Food Hydrocolloid Market Opportunities
6.4. Microbial Food Hydrocolloid Market Trends
Chapter 7. Global Microbial Food Hydrocolloid Market Outlook Trends
7.1. Global Microbial Food Hydrocolloid Revenue (USD Million) and CAGR (%) by Type (2021-2032)
7.2. Global Microbial Food Hydrocolloid Revenue (USD Million) and CAGR (%) by Application (2021-2032)
7.3. Global Microbial Food Hydrocolloid Revenue (USD Million) and CAGR (%) by Product (2021-2032)
By Type
Carboxymethylcellulose
Gelatin
Guar Gum
Gum Acacia
Xanthan Gum
Others
By Application
Bakery & Confectionery
Meat & Poultry
Sauces & Dressings
Beverages
Dairy Products
Others
Chapter 8. Global Microbial Food Hydrocolloid Regional Analysis and Outlook
8.1. Global Microbial Food Hydrocolloid Revenue (USD Million) By Regions (2021- 2032)
8.2. North America Microbial Food Hydrocolloid Revenue (USD Million) by Country (2021-2032)
8.2.1. United States Microbial Food Hydrocolloid Regional Analysis and Outlook
8.2.2. Canada Microbial Food Hydrocolloid Regional Analysis and Outlook
8.2.3. Mexico Microbial Food Hydrocolloid Regional Analysis and Outlook
8.3. Europe Microbial Food Hydrocolloid Revenue (USD Million), by Country (2021-2032)
8.3.1. Germany Microbial Food Hydrocolloid Regional Analysis and Outlook
8.3.2. France Microbial Food Hydrocolloid Regional Analysis and Outlook
8.3.3. United Kingdom Microbial Food Hydrocolloid Regional Analysis and Outlook
8.3.4. Spain Microbial Food Hydrocolloid Regional Analysis and Outlook
8.3.5. Italy Microbial Food Hydrocolloid Regional Analysis and Outlook
8.3.6. Russia Microbial Food Hydrocolloid Regional Analysis and Outlook
8.3.7. Rest of Europe Microbial Food Hydrocolloid Regional Analysis and Outlook
8.4. Asia Pacific Microbial Food Hydrocolloid Revenue (USD Million) by Country (2021-2032)
8.4.1. China Microbial Food Hydrocolloid Regional Analysis and Outlook
8.4.2. Japan Microbial Food Hydrocolloid Regional Analysis and Outlook
8.4.3. India Microbial Food Hydrocolloid Regional Analysis and Outlook
8.4.4. South Korea Microbial Food Hydrocolloid Regional Analysis and Outlook
8.4.5. Australia Microbial Food Hydrocolloid Regional Analysis and Outlook
8.4.6. South East Asia Microbial Food Hydrocolloid Regional Analysis and Outlook
8.4.7. Rest of Asia Pacific Microbial Food Hydrocolloid Regional Analysis and Outlook
8.5. South America Microbial Food Hydrocolloid Revenue (USD Million), by Country (2021-2032)
8.5.1. Brazil Microbial Food Hydrocolloid Regional Analysis and Outlook
8.5.2. Argentina Microbial Food Hydrocolloid Regional Analysis and Outlook
8.5.3. Rest of South America Microbial Food Hydrocolloid Regional Analysis and Outlook
8.6. Middle East and Africa Microbial Food Hydrocolloid Revenue (USD Million) by Country (2021-2032)
8.6.1. Middle East Microbial Food Hydrocolloid Regional Analysis and Outlook
8.6.2. Africa Microbial Food Hydrocolloid Regional Analysis and Outlook
Chapter 9. North America Microbial Food Hydrocolloid Analysis and Outlook
9.1. North America Microbial Food Hydrocolloid Revenue (USD Million) by Segments (2021-2032)
9.1.1. North America Microbial Food Hydrocolloid Revenue (USD Million) by Type (2021-2032)
9.1.2. North America Microbial Food Hydrocolloid Revenue (USD Million) by Application (2021-2032)
9.1.3. North America Microbial Food Hydrocolloid Revenue (USD Million) by Product (2021-2032)
By Type
Carboxymethylcellulose
Gelatin
Guar Gum
Gum Acacia
Xanthan Gum
Others
By Application
Bakery & Confectionery
Meat & Poultry
Sauces & Dressings
Beverages
Dairy Products
Others
Chapter 10. Europe Microbial Food Hydrocolloid Analysis and Outlook
10.1. Europe Microbial Food Hydrocolloid Revenue (USD Million), by Segments (USD Million) (2021-2032)
10.1.1. Europe Microbial Food Hydrocolloid Revenue (USD Million) by Type (2021-2032)
10.1.2. Europe Microbial Food Hydrocolloid Revenue (USD Million) by Application (2021-2032)
10.1.3. Europe Microbial Food Hydrocolloid Revenue (USD Million) by Product (2021-2032)
By Type
Carboxymethylcellulose
Gelatin
Guar Gum
Gum Acacia
Xanthan Gum
Others
By Application
Bakery & Confectionery
Meat & Poultry
Sauces & Dressings
Beverages
Dairy Products
Others
Chapter 11. Asia Pacific Microbial Food Hydrocolloid Analysis and Outlook
11.1. Asia Pacific Microbial Food Hydrocolloid Revenue (USD Million), and Revenue (USD Million) by Segments (2021-2032)
11.1.1. Asia Pacific Microbial Food Hydrocolloid Revenue (USD Million) by Type (2021-2032)
11.1.2. Asia Pacific Microbial Food Hydrocolloid Revenue (USD Million) by Application (2021-2032)
11.1.3. Asia Pacific Microbial Food Hydrocolloid Revenue (USD Million) by Product (2021-2032)
By Type
Carboxymethylcellulose
Gelatin
Guar Gum
Gum Acacia
Xanthan Gum
Others
By Application
Bakery & Confectionery
Meat & Poultry
Sauces & Dressings
Beverages
Dairy Products
Others
Chapter 12. South America Microbial Food Hydrocolloid Analysis and Outlook
12.1. South America Microbial Food Hydrocolloid Revenue (USD Million), by Segments (2021-2032)
12.1.1. South America Microbial Food Hydrocolloid Revenue (USD Million) by Type (2021-2032)
12.1.2. South America Microbial Food Hydrocolloid Revenue (USD Million) by Application (2021-2032)
12.1.3. South America Microbial Food Hydrocolloid Revenue (USD Million) by Product (2021-2032)
By Type
Carboxymethylcellulose
Gelatin
Guar Gum
Gum Acacia
Xanthan Gum
Others
By Application
Bakery & Confectionery
Meat & Poultry
Sauces & Dressings
Beverages
Dairy Products
Others
Chapter 13. Middle East and Africa Microbial Food Hydrocolloid Analysis and Outlook
13.1. Middle East and Africa Microbial Food Hydrocolloid Revenue (USD Million), by Segments (2021-2032)
13.1.1. Middle East and Africa Microbial Food Hydrocolloid Revenue (USD Million) by Type (2021-2032)
13.1.2. Middle East and Africa Microbial Food Hydrocolloid Revenue (USD Million) by Application (2021-2032)
13.1.3. Middle East and Africa Microbial Food Hydrocolloid Revenue (USD Million) by Product (2021-2032)
By Type
Carboxymethylcellulose
Gelatin
Guar Gum
Gum Acacia
Xanthan Gum
Others
By Application
Bakery & Confectionery
Meat & Poultry
Sauces & Dressings
Beverages
Dairy Products
Others
Chapter 14. Microbial Food Hydrocolloid Company Profiles
14.1 Business Overview
14.2 Product Profiles
14.3 SWOT Profiles
14.5 Recent Developments
14.6 Financial Profile
List of Companies
Ashland Global Holdings Inc.
Behn Meyer
Caremoli Group
Cargill Inc
Dupont
Hindustan Gum & Chemicals Ltd
Iberagar
Ingredion Inc
Jai Bharat Gum & Chemicals Ltd
JM Huber Corp
JM Huber Corp
Kerry Group Plc
Koninklijke DSM N.V.
Meihua
The Kraft Heinz Company
15. Methodology and Data Sources
15.1 Customization Offerings
15.2 Subscription Services
15.3 Related Reports
15.4 Publisher Expertise
LIST OF TABLES
Table 1 Market Segmentation Analysis
Table 2 Global Microbial Food Hydrocolloid Market Share of Leading Companies, 2023
Table 3 Product Offerings of Leading Companies
Table 4 Low Growth Scenario Forecasts
Table 5 Reference Case Growth Scenario
Table 6 High Growth Case Scenario
Table 7 Global Microbial Food Hydrocolloid Revenue (USD Million) And CAGR (%) By Type (2021-2032)
Table 8 Global Microbial Food Hydrocolloid Revenue (USD Million) And CAGR (%) By Application (2021-2032)
Table 9 Global Microbial Food Hydrocolloid Revenue (USD Million) And CAGR (%) By Product (2021-2032)
Table 10 Global Microbial Food Hydrocolloid Market Revenue (USD Million) By Regions (2021-2032)
Table 11 Global Microbial Food Hydrocolloid Market Share (%) By Regions (2021-2032)
Table 12 North America Microbial Food Hydrocolloid Revenue (USD Million) By Country (2021-2032)
Table 13 Europe Microbial Food Hydrocolloid Revenue (USD Million) By Country (2021-2032)
Table 14 Asia Pacific Microbial Food Hydrocolloid Revenue (USD Million) By Country (2021-2032)
Table 15 South America Microbial Food Hydrocolloid Revenue (USD Million) By Country (2021-2032)
Table 16 Middle East and Africa Microbial Food Hydrocolloid Revenue (USD Million) By Region (2021-2032)
Table 17 North America Microbial Food Hydrocolloid Revenue (USD Million) By Type (2021-2032)
Table 18 North America Microbial Food Hydrocolloid Revenue (USD Million) By Application (2021-2032)
Table 19 North America Microbial Food Hydrocolloid Revenue (USD Million) By Product (2021-2032)
Table 20 Europe Microbial Food Hydrocolloid Revenue (USD Million) By Type (2021-2032)
Table 21 Europe Microbial Food Hydrocolloid Revenue (USD Million) By Application (2021-2032)
Table 22 Europe Microbial Food Hydrocolloid Revenue (USD Million) By Product (2021-2032)
Table 23 Asia Pacific Microbial Food Hydrocolloid Revenue (USD Million) By Type (2021-2032)
Table 24 Asia Pacific Microbial Food Hydrocolloid Revenue (USD Million) By Application (2021-2032)
Table 25 Asia Pacific Microbial Food Hydrocolloid Revenue (USD Million) By Product (2021-2032)
Table 26 South America Microbial Food Hydrocolloid Revenue (USD Million) By Type (2021-2032)
Table 27 South America Microbial Food Hydrocolloid Revenue (USD Million) By Application (2021-2032)
Table 28 South America Microbial Food Hydrocolloid Revenue (USD Million) By Product (2021-2032)
Table 29 Middle East and Africa Microbial Food Hydrocolloid Revenue (USD Million) By Type (2021-2032)
Table 30 Middle East and Africa Microbial Food Hydrocolloid Revenue (USD Million) By Application (2021-2032)
Table 31 Middle East and Africa Microbial Food Hydrocolloid Revenue (USD Million) By Product (2021-2032)
LIST OF FIGURES
Figure 1. Market Scope
Figure 2. Pricing Forecasts Per Unit, 2023- 2032
Figure 3. Porter’s Five Forces
Figure 4. Global Microbial Food Hydrocolloid Market Revenue (USD Million) By Regions (2021-2032)
Figure 5. Global Microbial Food Hydrocolloid Market Share (%) By Regions (2023)
Figure 6. North America Microbial Food Hydrocolloid Revenue (USD Million) By Country (2021-2032)
Figure 7. United States Microbial Food Hydrocolloid Revenue (USD Million) By Country (2021-2032)
Figure 8. Canada Microbial Food Hydrocolloid Revenue (USD Million) By Country (2021-2032)
Figure 9. Mexico Microbial Food Hydrocolloid Revenue (USD Million) By Country (2021-2032)
Figure 10. Europe Microbial Food Hydrocolloid Revenue (USD Million) By Country (2021-2032)
Figure 11. Germany Microbial Food Hydrocolloid Revenue (USD Million) By Country (2021-2032)
Figure 12. France Microbial Food Hydrocolloid Revenue (USD Million) By Country (2021-2032)
Figure 13. United Kingdom Microbial Food Hydrocolloid Revenue (USD Million) By Country (2021-2032)
Figure 14. Spain Microbial Food Hydrocolloid Revenue (USD Million) By Country (2021-2032)
Figure 15. Italy Microbial Food Hydrocolloid Revenue (USD Million) By Country (2021-2032)
Figure 16. Russia Microbial Food Hydrocolloid Revenue (USD Million) By Country (2021-2032)
Figure 17. Rest of Europe Microbial Food Hydrocolloid Revenue (USD Million) By Country (2021-2032)
Figure 11. Asia Pacific Microbial Food Hydrocolloid Revenue (USD Million) By Country (2021-2032)
Figure 12. China Microbial Food Hydrocolloid Revenue (USD Million) By Country (2021-2032)
Figure 13. Japan Microbial Food Hydrocolloid Revenue (USD Million) By Country (2021-2032)
Figure 14. India Microbial Food Hydrocolloid Revenue (USD Million) By Country (2021-2032)
Figure 15. South Korea Microbial Food Hydrocolloid Revenue (USD Million) By Country (2021-2032)
Figure 16. Australia Microbial Food Hydrocolloid Revenue (USD Million) By Country (2021-2032)
Figure 17. South East Asia Microbial Food Hydrocolloid Revenue (USD Million) By Country (2021-2032)
Figure 18. South America Microbial Food Hydrocolloid Revenue (USD Million) By Country (2021-2032)
Figure 19. Brazil Microbial Food Hydrocolloid Revenue (USD Million) By Country (2021-2032)
Figure 20. Argentina Microbial Food Hydrocolloid Revenue (USD Million) By Country (2021-2032)
Figure 21. Rest of Asia Pacific Microbial Food Hydrocolloid Revenue (USD Million) By Country (2021-2032)
Figure 22. Middle East and Africa Microbial Food Hydrocolloid Revenue (USD Million) By Region (2021-2032)
Figure 23. Saudi Arabia Microbial Food Hydrocolloid Revenue (USD Million) By Region (2021-2032)
Figure 24. The UAE Microbial Food Hydrocolloid Revenue (USD Million) By Region (2021-2032)
Figure 25. Rest of Middle East Microbial Food Hydrocolloid Revenue (USD Million) By Region (2021-2032)
Figure 26. South Africa Microbial Food Hydrocolloid Revenue (USD Million) By Region (2021-2032)
Figure 27. Africa Microbial Food Hydrocolloid Revenue (USD Million) By Region (2021-2032)
Figure 28. North America Microbial Food Hydrocolloid Revenue (USD Million) By Type (2021-2032)
Figure 29. North America Microbial Food Hydrocolloid Revenue (USD Million) By Application (2021-2032)
Figure 30. North America Microbial Food Hydrocolloid Revenue (USD Million) By Product (2021-2032)
Figure 31. Europe Microbial Food Hydrocolloid Revenue (USD Million) By Type (2021-2032)
Figure 32. Europe Microbial Food Hydrocolloid Revenue (USD Million) By Application (2021-2032)
Figure 33. Europe Microbial Food Hydrocolloid Revenue (USD Million) By Product (2021-2032)
Figure 34. Asia Pacific Microbial Food Hydrocolloid Revenue (USD Million) By Type (2021-2032)
Figure 35. Asia Pacific Microbial Food Hydrocolloid Revenue (USD Million) By Application (2021-2032)
Figure 36. Asia Pacific Microbial Food Hydrocolloid Revenue (USD Million) By Product (2021-2032)
Figure 37. South America Microbial Food Hydrocolloid Revenue (USD Million) By Type (2021-2032)
Figure 38. South America Microbial Food Hydrocolloid Revenue (USD Million) By Application (2021-2032)
Figure 39. South America Microbial Food Hydrocolloid Revenue (USD Million) By Product (2021-2032)
Figure 40. Middle East and Africa Microbial Food Hydrocolloid Revenue (USD Million) By Type (2021-2032)
Figure 41. Middle East and Africa Microbial Food Hydrocolloid Revenue (USD Million) By Application (2021-2032)
Figure 42. Middle East and Africa Microbial Food Hydrocolloid Revenue (USD Million) By Product (2021-2032)
By Type
Carboxymethylcellulose
Gelatin
Guar Gum
Gum Acacia
Xanthan Gum
Others
By Application
Bakery & Confectionery
Meat & Poultry
Sauces & Dressings
Beverages
Dairy Products
Others
Countries Analyzed
North America (US, Canada, Mexico)
Europe (Germany, UK, France, Spain, Italy, Russia, Rest of Europe)
Asia Pacific (China, India, Japan, South Korea, Australia, South East Asia, Rest of Asia)
South America (Brazil, Argentina, Rest of South America)
Middle East and Africa (Saudi Arabia, UAE, Rest of Middle East, South Africa, Egypt, Rest of Africa)
