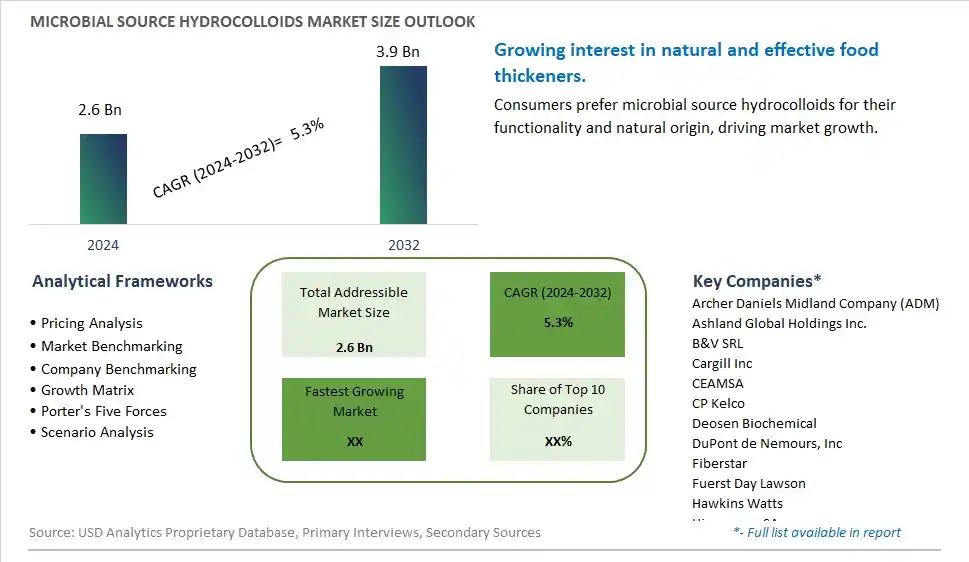
Global Microbial Source Hydrocolloids Market Size is valued at $2.6 Billion in 2024 and is forecast to register a growth rate (CAGR) of 5.3% to reach $3.9 Billion by 2032.
The global Microbial Source Hydrocolloids Market Comprehensive Study analyzes and forecasts the market size across 6 regions and 24 countries for diverse segments -By Type (Xanthan Gum, Curdlan, Gellan Gum), By Application (Bakery and Confectionery, Dairy, Beverages, Meat & Poultry, Others)
An Introduction to Microbial Source Hydrocolloids Market
In 2024, the microbial source hydrocolloids market is expanding rapidly, driven by the demand for natural and sustainable hydrocolloids in the food, pharmaceutical, and cosmetics industries. Microbial hydrocolloids, produced through fermentation processes, offer functional properties such as thickening, gelling, and stabilizing. The market benefits from innovations in microbial fermentation and processing technologies that enhance product quality and scalability. The trend towards clean label and natural ingredients is influencing market dynamics. Increasing consumer awareness of the benefits of microbial hydrocolloids and the popularity of functional and natural ingredients are further propelling market growth.
Microbial Source Hydrocolloids Competitive Landscape
The market report analyses the leading companies in the industry including Archer Daniels Midland Company (ADM), Ashland Global Holdings Inc., B&V SRL, Cargill Inc, CEAMSA, CP Kelco, Deosen Biochemical, DuPont de Nemours, Inc, Fiberstar, Fuerst Day Lawson, Hawkins Watts, Hispanagar SA, Ingredion Inc, Jungbunzlauer, Koninklijke DSM N.V., Nestlé SA, Tate & Lyle Plc, The Lubrizol Corporation, and Others.
Microbial Source Hydrocolloids Market Dynamics
Microbial Source Hydrocolloids Market Trend: Growing Popularity of Clean Label Ingredients
The most prominent trend in the Microbial Source Hydrocolloids Market is the growing popularity of clean label ingredients. Consumers are increasingly seeking products with natural and recognizable ingredients, driving the demand for microbial hydrocolloids that align with clean label standards.
Microbial Source Hydrocolloids Market Driver: Increased Use in Food and Beverage Industry
A key driver in the Microbial Source Hydrocolloids Market is the increased use in the food and beverage industry. Microbial hydrocolloids, such as xanthan gum and gellan gum, are widely used for their functional properties, including thickening, stabilizing, and emulsifying, supporting the production of high-quality food and beverages.
Microbial Source Hydrocolloids Market Opportunity: Development of Specialty Hydrocolloid Products
One significant opportunity in the Microbial Source Hydrocolloids Market lies in the development of specialty hydrocolloid products. Companies can innovate by creating hydrocolloids tailored for specific applications, such as low-sugar formulations, gluten-free products, and vegan alternatives. By offering specialized solutions, manufacturers can attract a diverse customer base and drive market growth.
Microbial Source Hydrocolloids Market Share Analysis- Largest Segment by Type
The Xanthan Gum segment is the largest in the Microbial Source Hydrocolloids Market by type. This dominance is driven by the high demand for xanthan gum due to its excellent thickening, stabilizing, and emulsifying properties. Xanthan gum is widely used in a variety of food and beverage applications, including sauces, dressings, dairy products, and bakery products, for its ability to improve texture and consistency. The continuous innovation in xanthan gum production and its cost-effectiveness enhance its appeal. Additionally, the extensive availability of xanthan gum in the market and its compatibility with various food formulations further boost its market share. The strong consumer preference for products with consistent quality and stability reinforces the dominant position of the xanthan gum segment in the market.
Microbial Source Hydrocolloids Market Share Analysis- Fastest Growing Segment by Application
The Dairy segment is poised to grow the fastest in the Microbial Source Hydrocolloids Market by application over the next five years. This rapid growth is driven by the increasing demand for hydrocolloids in dairy products to improve texture, stability, and shelf life. Hydrocolloids such as xanthan gum, gellan gum, and curdlan are essential in the formulation of various dairy products, including yogurt, cheese, and ice cream, for their thickening, gelling, and stabilizing properties. The continuous innovation in hydrocolloid applications and the development of new formulations that enhance the sensory attributes of dairy products support the fast growth of this segment. Additionally, the growing trend of functional and fortified dairy products supports the demand for hydrocolloids in the dairy industry. The influence of consumer preferences for high-quality and stable dairy products further contributes to the rapid growth of the dairy segment.
Microbial Source Hydrocolloids Market Segmentation
By Type
Xanthan Gum
Curdlan
Gellan Gum
By Application
Bakery and Confectionery
Dairy
Beverages
Meat & Poultry
Others
Countries Analyzed
North America (US, Canada, Mexico)
Europe (Germany, UK, France, Spain, Italy, Russia, Rest of Europe)
Asia Pacific (China, India, Japan, South Korea, Australia, South East Asia, Rest of Asia)
South America (Brazil, Argentina, Rest of South America)
Middle East and Africa (Saudi Arabia, UAE, Rest of Middle East, South Africa, Egypt, Rest of Africa)
Microbial Source Hydrocolloids Companies Profiled in the Study
Archer Daniels Midland Company (ADM)
Ashland Global Holdings Inc.
B&V SRL
Cargill Inc
CEAMSA
CP Kelco
Deosen Biochemical
DuPont de Nemours, Inc
Fiberstar
Fuerst Day Lawson
Hawkins Watts
Hispanagar SA
Ingredion Inc
Jungbunzlauer
Koninklijke DSM N.V.
Nestlé SA
Tate & Lyle Plc
The Lubrizol Corporation
*- List Not Exhaustive
Chapter 1. TABLE OF CONTENTS
Chapter 2. Introduction to Microbial Source Hydrocolloids Market
2.1. Market Overview
2.2. Key Statistics and Report Highlights
2.3. Scope of the Comprehensive Study
2.3.1. Market Definition
2.3.2 Countries and Regions Covered
2.3.3 Research Objective
2.3.4 Units, Currency, and Conversions
2.3.5 Industry Value Chain
2.4. Key Market Segments
2.5. Key Companies
2.6. Study Period
Chapter 3. Strategic Analysis Review
3.1. Microbial Source Hydrocolloids Pricing Analysis and Forecast
3.2. Porter’s Five Forces
3.3. Market Ecosystem
3.4. SWOT Analysis
3.5. Regulatory Scenario
3.3. Effects of Inflation, Russia-Ukraine War, moderating economic growth, and other macroeconomic factors
Chapter 4. Competitive Landscape
4.1. Market Share Analysis
4.1.1. Global Microbial Source Hydrocolloids Market Share by Company, 2023
4.1.2. Product Offerings of Leading Microbial Source Hydrocolloids Companies
4.2. Market Entropy
4.2.1. New Product Launches in the Industry
4.2.2. Mergers, Acquisitions, Joint ventures, and Partnerships
4.3. Key Strategies and Best Practices
Chapter 5. Global Market Projections: Best, Reference, and Low Case Scenarios
5.1. Growth Analysis- Case Scenario Definitions
5.2. Low Growth Case Scenario Forecasts
5.3. Reference Growth Case Scenario Forecasts
5.4. High Growth Case Scenario Forecasts
Chapter 6. Market Dynamics
6.1. Microbial Source Hydrocolloids Market Drivers
6.2. Microbial Source Hydrocolloids Market Challenges
6.6. Microbial Source Hydrocolloids Market Opportunities
6.4. Microbial Source Hydrocolloids Market Trends
Chapter 7. Global Microbial Source Hydrocolloids Market Outlook Trends
7.1. Global Microbial Source Hydrocolloids Revenue (USD Million) and CAGR (%) by Type (2021-2032)
7.2. Global Microbial Source Hydrocolloids Revenue (USD Million) and CAGR (%) by Application (2021-2032)
7.3. Global Microbial Source Hydrocolloids Revenue (USD Million) and CAGR (%) by Product (2021-2032)
By Type
Xanthan Gum
Curdlan
Gellan Gum
By Application
Bakery and Confectionery
Dairy
Beverages
Meat & Poultry
Others
Chapter 8. Global Microbial Source Hydrocolloids Regional Analysis and Outlook
8.1. Global Microbial Source Hydrocolloids Revenue (USD Million) By Regions (2021- 2032)
8.2. North America Microbial Source Hydrocolloids Revenue (USD Million) by Country (2021-2032)
8.2.1. United States Microbial Source Hydrocolloids Regional Analysis and Outlook
8.2.2. Canada Microbial Source Hydrocolloids Regional Analysis and Outlook
8.2.3. Mexico Microbial Source Hydrocolloids Regional Analysis and Outlook
8.3. Europe Microbial Source Hydrocolloids Revenue (USD Million), by Country (2021-2032)
8.3.1. Germany Microbial Source Hydrocolloids Regional Analysis and Outlook
8.3.2. France Microbial Source Hydrocolloids Regional Analysis and Outlook
8.3.3. United Kingdom Microbial Source Hydrocolloids Regional Analysis and Outlook
8.3.4. Spain Microbial Source Hydrocolloids Regional Analysis and Outlook
8.3.5. Italy Microbial Source Hydrocolloids Regional Analysis and Outlook
8.3.6. Russia Microbial Source Hydrocolloids Regional Analysis and Outlook
8.3.7. Rest of Europe Microbial Source Hydrocolloids Regional Analysis and Outlook
8.4. Asia Pacific Microbial Source Hydrocolloids Revenue (USD Million) by Country (2021-2032)
8.4.1. China Microbial Source Hydrocolloids Regional Analysis and Outlook
8.4.2. Japan Microbial Source Hydrocolloids Regional Analysis and Outlook
8.4.3. India Microbial Source Hydrocolloids Regional Analysis and Outlook
8.4.4. South Korea Microbial Source Hydrocolloids Regional Analysis and Outlook
8.4.5. Australia Microbial Source Hydrocolloids Regional Analysis and Outlook
8.4.6. South East Asia Microbial Source Hydrocolloids Regional Analysis and Outlook
8.4.7. Rest of Asia Pacific Microbial Source Hydrocolloids Regional Analysis and Outlook
8.5. South America Microbial Source Hydrocolloids Revenue (USD Million), by Country (2021-2032)
8.5.1. Brazil Microbial Source Hydrocolloids Regional Analysis and Outlook
8.5.2. Argentina Microbial Source Hydrocolloids Regional Analysis and Outlook
8.5.3. Rest of South America Microbial Source Hydrocolloids Regional Analysis and Outlook
8.6. Middle East and Africa Microbial Source Hydrocolloids Revenue (USD Million) by Country (2021-2032)
8.6.1. Middle East Microbial Source Hydrocolloids Regional Analysis and Outlook
8.6.2. Africa Microbial Source Hydrocolloids Regional Analysis and Outlook
Chapter 9. North America Microbial Source Hydrocolloids Analysis and Outlook
9.1. North America Microbial Source Hydrocolloids Revenue (USD Million) by Segments (2021-2032)
9.1.1. North America Microbial Source Hydrocolloids Revenue (USD Million) by Type (2021-2032)
9.1.2. North America Microbial Source Hydrocolloids Revenue (USD Million) by Application (2021-2032)
9.1.3. North America Microbial Source Hydrocolloids Revenue (USD Million) by Product (2021-2032)
By Type
Xanthan Gum
Curdlan
Gellan Gum
By Application
Bakery and Confectionery
Dairy
Beverages
Meat & Poultry
Others
Chapter 10. Europe Microbial Source Hydrocolloids Analysis and Outlook
10.1. Europe Microbial Source Hydrocolloids Revenue (USD Million), by Segments (USD Million) (2021-2032)
10.1.1. Europe Microbial Source Hydrocolloids Revenue (USD Million) by Type (2021-2032)
10.1.2. Europe Microbial Source Hydrocolloids Revenue (USD Million) by Application (2021-2032)
10.1.3. Europe Microbial Source Hydrocolloids Revenue (USD Million) by Product (2021-2032)
By Type
Xanthan Gum
Curdlan
Gellan Gum
By Application
Bakery and Confectionery
Dairy
Beverages
Meat & Poultry
Others
Chapter 11. Asia Pacific Microbial Source Hydrocolloids Analysis and Outlook
11.1. Asia Pacific Microbial Source Hydrocolloids Revenue (USD Million), and Revenue (USD Million) by Segments (2021-2032)
11.1.1. Asia Pacific Microbial Source Hydrocolloids Revenue (USD Million) by Type (2021-2032)
11.1.2. Asia Pacific Microbial Source Hydrocolloids Revenue (USD Million) by Application (2021-2032)
11.1.3. Asia Pacific Microbial Source Hydrocolloids Revenue (USD Million) by Product (2021-2032)
By Type
Xanthan Gum
Curdlan
Gellan Gum
By Application
Bakery and Confectionery
Dairy
Beverages
Meat & Poultry
Others
Chapter 12. South America Microbial Source Hydrocolloids Analysis and Outlook
12.1. South America Microbial Source Hydrocolloids Revenue (USD Million), by Segments (2021-2032)
12.1.1. South America Microbial Source Hydrocolloids Revenue (USD Million) by Type (2021-2032)
12.1.2. South America Microbial Source Hydrocolloids Revenue (USD Million) by Application (2021-2032)
12.1.3. South America Microbial Source Hydrocolloids Revenue (USD Million) by Product (2021-2032)
By Type
Xanthan Gum
Curdlan
Gellan Gum
By Application
Bakery and Confectionery
Dairy
Beverages
Meat & Poultry
Others
Chapter 13. Middle East and Africa Microbial Source Hydrocolloids Analysis and Outlook
13.1. Middle East and Africa Microbial Source Hydrocolloids Revenue (USD Million), by Segments (2021-2032)
13.1.1. Middle East and Africa Microbial Source Hydrocolloids Revenue (USD Million) by Type (2021-2032)
13.1.2. Middle East and Africa Microbial Source Hydrocolloids Revenue (USD Million) by Application (2021-2032)
13.1.3. Middle East and Africa Microbial Source Hydrocolloids Revenue (USD Million) by Product (2021-2032)
By Type
Xanthan Gum
Curdlan
Gellan Gum
By Application
Bakery and Confectionery
Dairy
Beverages
Meat & Poultry
Others
Chapter 14. Microbial Source Hydrocolloids Company Profiles
14.1 Business Overview
14.2 Product Profiles
14.3 SWOT Profiles
14.5 Recent Developments
14.6 Financial Profile
List of Companies
Archer Daniels Midland Company (ADM)
Ashland Global Holdings Inc.
B&V SRL
Cargill Inc
CEAMSA
CP Kelco
Deosen Biochemical
DuPont de Nemours, Inc
Fiberstar
Fuerst Day Lawson
Hawkins Watts
Hispanagar SA
Ingredion Inc
Jungbunzlauer
Koninklijke DSM N.V.
Nestlé SA
Tate & Lyle Plc
The Lubrizol Corporation
15. Methodology and Data Sources
15.1 Customization Offerings
15.2 Subscription Services
15.3 Related Reports
15.4 Publisher Expertise
LIST OF TABLES
Table 1 Market Segmentation Analysis
Table 2 Global Microbial Source Hydrocolloids Market Share of Leading Companies, 2023
Table 3 Product Offerings of Leading Companies
Table 4 Low Growth Scenario Forecasts
Table 5 Reference Case Growth Scenario
Table 6 High Growth Case Scenario
Table 7 Global Microbial Source Hydrocolloids Revenue (USD Million) And CAGR (%) By Type (2021-2032)
Table 8 Global Microbial Source Hydrocolloids Revenue (USD Million) And CAGR (%) By Application (2021-2032)
Table 9 Global Microbial Source Hydrocolloids Revenue (USD Million) And CAGR (%) By Product (2021-2032)
Table 10 Global Microbial Source Hydrocolloids Market Revenue (USD Million) By Regions (2021-2032)
Table 11 Global Microbial Source Hydrocolloids Market Share (%) By Regions (2021-2032)
Table 12 North America Microbial Source Hydrocolloids Revenue (USD Million) By Country (2021-2032)
Table 13 Europe Microbial Source Hydrocolloids Revenue (USD Million) By Country (2021-2032)
Table 14 Asia Pacific Microbial Source Hydrocolloids Revenue (USD Million) By Country (2021-2032)
Table 15 South America Microbial Source Hydrocolloids Revenue (USD Million) By Country (2021-2032)
Table 16 Middle East and Africa Microbial Source Hydrocolloids Revenue (USD Million) By Region (2021-2032)
Table 17 North America Microbial Source Hydrocolloids Revenue (USD Million) By Type (2021-2032)
Table 18 North America Microbial Source Hydrocolloids Revenue (USD Million) By Application (2021-2032)
Table 19 North America Microbial Source Hydrocolloids Revenue (USD Million) By Product (2021-2032)
Table 20 Europe Microbial Source Hydrocolloids Revenue (USD Million) By Type (2021-2032)
Table 21 Europe Microbial Source Hydrocolloids Revenue (USD Million) By Application (2021-2032)
Table 22 Europe Microbial Source Hydrocolloids Revenue (USD Million) By Product (2021-2032)
Table 23 Asia Pacific Microbial Source Hydrocolloids Revenue (USD Million) By Type (2021-2032)
Table 24 Asia Pacific Microbial Source Hydrocolloids Revenue (USD Million) By Application (2021-2032)
Table 25 Asia Pacific Microbial Source Hydrocolloids Revenue (USD Million) By Product (2021-2032)
Table 26 South America Microbial Source Hydrocolloids Revenue (USD Million) By Type (2021-2032)
Table 27 South America Microbial Source Hydrocolloids Revenue (USD Million) By Application (2021-2032)
Table 28 South America Microbial Source Hydrocolloids Revenue (USD Million) By Product (2021-2032)
Table 29 Middle East and Africa Microbial Source Hydrocolloids Revenue (USD Million) By Type (2021-2032)
Table 30 Middle East and Africa Microbial Source Hydrocolloids Revenue (USD Million) By Application (2021-2032)
Table 31 Middle East and Africa Microbial Source Hydrocolloids Revenue (USD Million) By Product (2021-2032)
LIST OF FIGURES
Figure 1. Market Scope
Figure 2. Pricing Forecasts Per Unit, 2023- 2032
Figure 3. Porter’s Five Forces
Figure 4. Global Microbial Source Hydrocolloids Market Revenue (USD Million) By Regions (2021-2032)
Figure 5. Global Microbial Source Hydrocolloids Market Share (%) By Regions (2023)
Figure 6. North America Microbial Source Hydrocolloids Revenue (USD Million) By Country (2021-2032)
Figure 7. United States Microbial Source Hydrocolloids Revenue (USD Million) By Country (2021-2032)
Figure 8. Canada Microbial Source Hydrocolloids Revenue (USD Million) By Country (2021-2032)
Figure 9. Mexico Microbial Source Hydrocolloids Revenue (USD Million) By Country (2021-2032)
Figure 10. Europe Microbial Source Hydrocolloids Revenue (USD Million) By Country (2021-2032)
Figure 11. Germany Microbial Source Hydrocolloids Revenue (USD Million) By Country (2021-2032)
Figure 12. France Microbial Source Hydrocolloids Revenue (USD Million) By Country (2021-2032)
Figure 13. United Kingdom Microbial Source Hydrocolloids Revenue (USD Million) By Country (2021-2032)
Figure 14. Spain Microbial Source Hydrocolloids Revenue (USD Million) By Country (2021-2032)
Figure 15. Italy Microbial Source Hydrocolloids Revenue (USD Million) By Country (2021-2032)
Figure 16. Russia Microbial Source Hydrocolloids Revenue (USD Million) By Country (2021-2032)
Figure 17. Rest of Europe Microbial Source Hydrocolloids Revenue (USD Million) By Country (2021-2032)
Figure 11. Asia Pacific Microbial Source Hydrocolloids Revenue (USD Million) By Country (2021-2032)
Figure 12. China Microbial Source Hydrocolloids Revenue (USD Million) By Country (2021-2032)
Figure 13. Japan Microbial Source Hydrocolloids Revenue (USD Million) By Country (2021-2032)
Figure 14. India Microbial Source Hydrocolloids Revenue (USD Million) By Country (2021-2032)
Figure 15. South Korea Microbial Source Hydrocolloids Revenue (USD Million) By Country (2021-2032)
Figure 16. Australia Microbial Source Hydrocolloids Revenue (USD Million) By Country (2021-2032)
Figure 17. South East Asia Microbial Source Hydrocolloids Revenue (USD Million) By Country (2021-2032)
Figure 18. South America Microbial Source Hydrocolloids Revenue (USD Million) By Country (2021-2032)
Figure 19. Brazil Microbial Source Hydrocolloids Revenue (USD Million) By Country (2021-2032)
Figure 20. Argentina Microbial Source Hydrocolloids Revenue (USD Million) By Country (2021-2032)
Figure 21. Rest of Asia Pacific Microbial Source Hydrocolloids Revenue (USD Million) By Country (2021-2032)
Figure 22. Middle East and Africa Microbial Source Hydrocolloids Revenue (USD Million) By Region (2021-2032)
Figure 23. Saudi Arabia Microbial Source Hydrocolloids Revenue (USD Million) By Region (2021-2032)
Figure 24. The UAE Microbial Source Hydrocolloids Revenue (USD Million) By Region (2021-2032)
Figure 25. Rest of Middle East Microbial Source Hydrocolloids Revenue (USD Million) By Region (2021-2032)
Figure 26. South Africa Microbial Source Hydrocolloids Revenue (USD Million) By Region (2021-2032)
Figure 27. Africa Microbial Source Hydrocolloids Revenue (USD Million) By Region (2021-2032)
Figure 28. North America Microbial Source Hydrocolloids Revenue (USD Million) By Type (2021-2032)
Figure 29. North America Microbial Source Hydrocolloids Revenue (USD Million) By Application (2021-2032)
Figure 30. North America Microbial Source Hydrocolloids Revenue (USD Million) By Product (2021-2032)
Figure 31. Europe Microbial Source Hydrocolloids Revenue (USD Million) By Type (2021-2032)
Figure 32. Europe Microbial Source Hydrocolloids Revenue (USD Million) By Application (2021-2032)
Figure 33. Europe Microbial Source Hydrocolloids Revenue (USD Million) By Product (2021-2032)
Figure 34. Asia Pacific Microbial Source Hydrocolloids Revenue (USD Million) By Type (2021-2032)
Figure 35. Asia Pacific Microbial Source Hydrocolloids Revenue (USD Million) By Application (2021-2032)
Figure 36. Asia Pacific Microbial Source Hydrocolloids Revenue (USD Million) By Product (2021-2032)
Figure 37. South America Microbial Source Hydrocolloids Revenue (USD Million) By Type (2021-2032)
Figure 38. South America Microbial Source Hydrocolloids Revenue (USD Million) By Application (2021-2032)
Figure 39. South America Microbial Source Hydrocolloids Revenue (USD Million) By Product (2021-2032)
Figure 40. Middle East and Africa Microbial Source Hydrocolloids Revenue (USD Million) By Type (2021-2032)
Figure 41. Middle East and Africa Microbial Source Hydrocolloids Revenue (USD Million) By Application (2021-2032)
Figure 42. Middle East and Africa Microbial Source Hydrocolloids Revenue (USD Million) By Product (2021-2032)
By Type
Xanthan Gum
Curdlan
Gellan Gum
By Application
Bakery and Confectionery
Dairy
Beverages
Meat & Poultry
Others
Countries Analyzed
North America (US, Canada, Mexico)
Europe (Germany, UK, France, Spain, Italy, Russia, Rest of Europe)
Asia Pacific (China, India, Japan, South Korea, Australia, South East Asia, Rest of Asia)
South America (Brazil, Argentina, Rest of South America)
Middle East and Africa (Saudi Arabia, UAE, Rest of Middle East, South Africa, Egypt, Rest of Africa)
